REVIEW 5 major objections 6 minor 79 references
A Global Commuting Origin-Destination Flow Dataset for Urban Sustainable Development
T0 review · 5 major / 6 minor · reviewed 2026-08-07 · deepseek-v4-flash
Pith's one-line read Generated commuting flows now cover 1,625 cities worldwide
desk verdict A useful global commuting OD dataset with real external validation, but the global reliability claim is overstretched and the core transferability assumption is unproven. read the letter →
The pith
A machine-rendered reading of the paper's core claim, the machinery that carries it, and where it could break.
The reading
What carries the argument
The load-bearing mechanism is WEDAN, a graph denoising diffusion model adapted for OD flow generation. In the construction pipeline, a city is a graph whose nodes are grid-based urban regions and whose edge weights are commuting flows; the forward process adds noise to real OD edge weights during training, and the reverse denoising process reconstructs them while being conditioned on node features. Those node features are 1,094-dimensional vectors assembled from WorldPop population and demographics (36 dimensions), RemoteCLIP-encoded satellite imagery (1,024 dimensions), and OpenStreetMap POI type counts (34 dimensions). Because the generator is conditioned on these urban semantic features, it can be applied to cities outside the training set using only public data, which is what makes worldwide coverage possible.
What would settle it
Take a set of 20 cities not used in WEDAN's training that have released national census OD matrices within the past five years; compute CPC and RMSE between the generated matrices and the census matrices. If the average CPC over these held-out cities falls close to a random baseline or substantially below the reported 0.572, the claimed transfer across all 1,625 cities is not supported.
Extended reading notes
Core claim
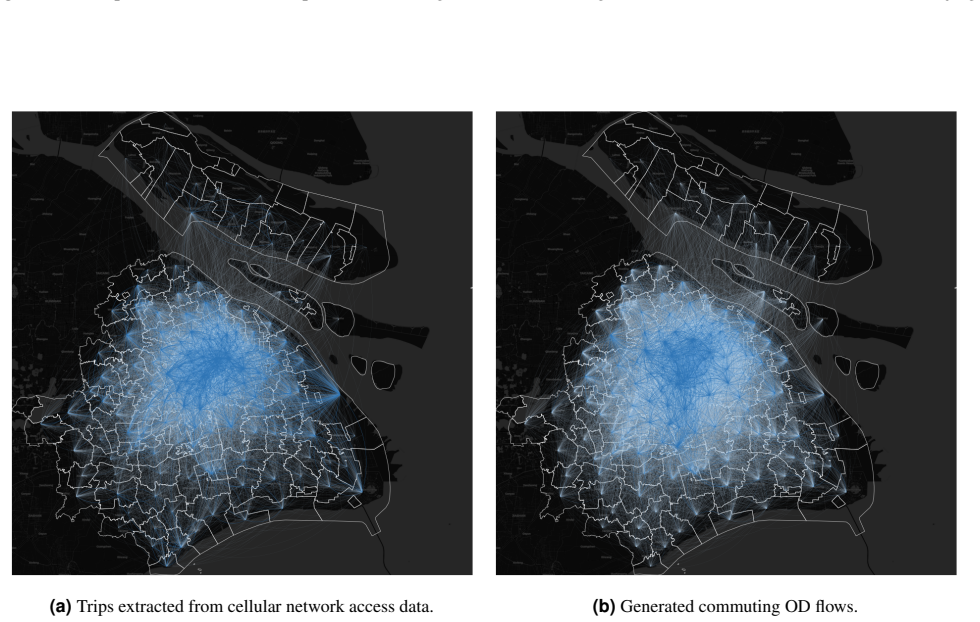
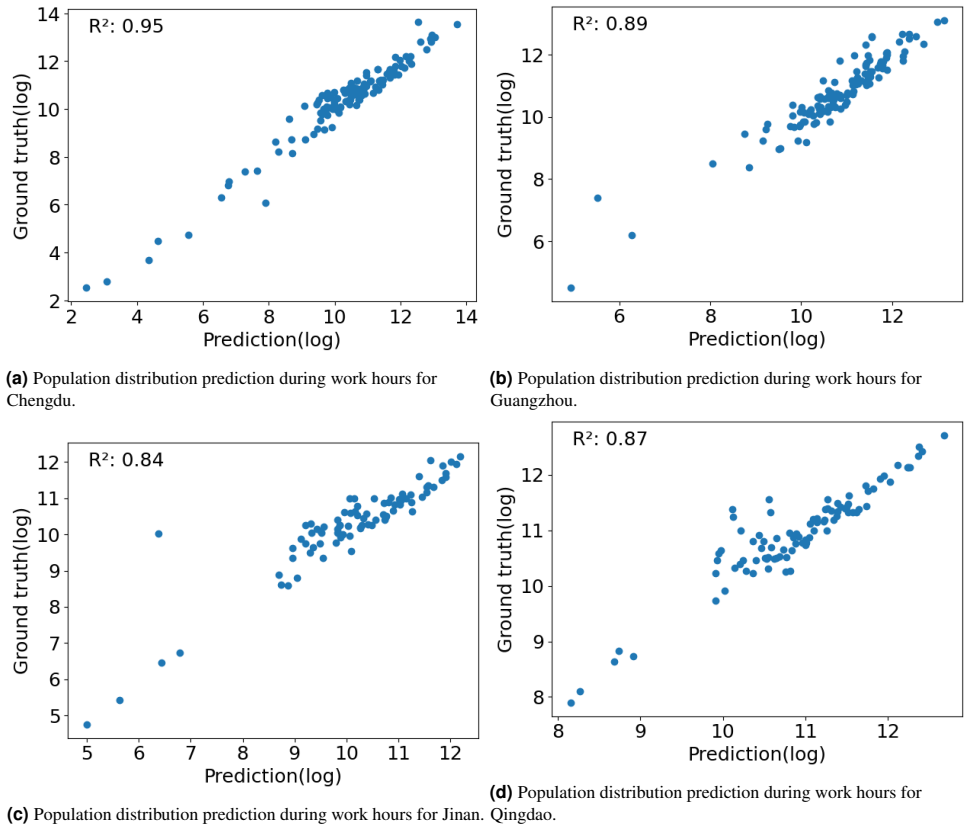
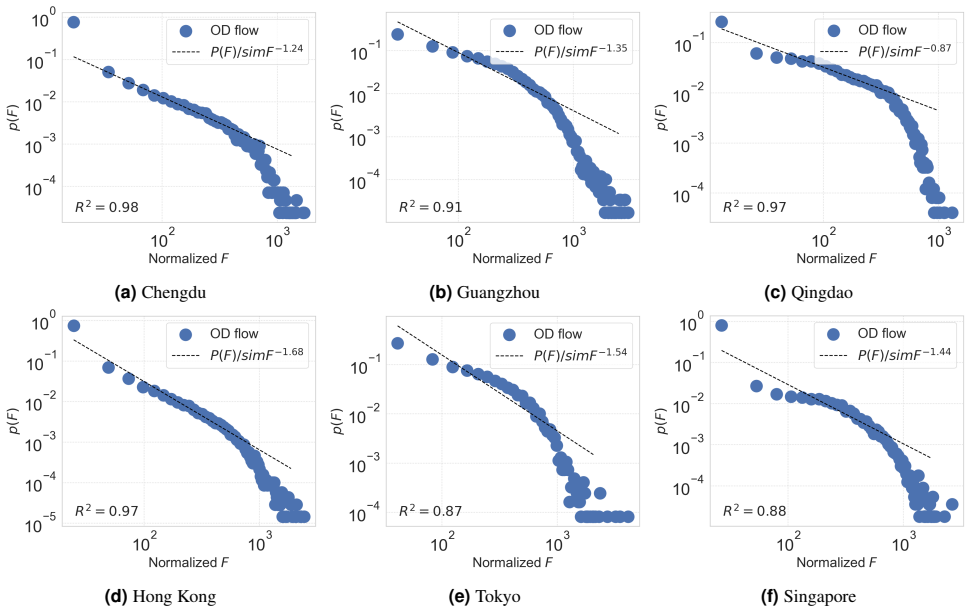
The paper's central claim is that a graph diffusion model can generate realistic city-wide commuting OD matrices for any city, given only publicly available geospatial features of its regions. Each city is divided into adaptive grid regions, and each region receives a 1,094-dimensional feature vector combining 36 demographic dimensions, 1,024 satellite-image semantic dimensions, and 34 POI-type dimensions. The WEDAN graph diffusion model treats commuting flows as weighted directed edges between these regions and generates them conditioned on the node features. Validation shows alignment with reference data across multiple independent measures: Spearman correlations between 0.477 and 0.816 against mobile-location commutes in four cities, a CPC of 0.572 against UK/US census flows, R² above 0.84 when predicting work-hour population in four Chinese cities, a 0.66 correlation with measured transport carbon emissions across cities, and a power-law commuting flow distribution consistent with scale-free networks. The dataset is released with region boundaries, region divisions, and OD matrices for all cities, alongside a web tool for generating flows for arbitrary regions.
Load-bearing premise
The load-bearing premise is that a model trained on commuting data from some cities can produce accurate commuting flows for all 1,625 cities using only public maps, population, and point-of-interest features, without being adjusted per city.
Editorial extensions
If this is right
- Researchers can compare commuting structure across 1,625 cities on a standardized grid, including many cities that have no travel survey or mobile-location data.
- Cities without local OD data can use the generated matrices to start transportation demand modeling, work-hour population estimation, and commuting-distance analysis rather than waiting for censuses.
- Sustainability indicators that depend on commuting—transportation carbon emissions, network resilience, and epidemic exposure—can be estimated for a global set of cities at once.
- The maintained web interface lets users generate commuting OD flows for arbitrary user-defined regions, extending coverage beyond the released 1,625 cities.
- The reported validation statistics (CPC, R², and power-law reproduction) give downstream users a baseline for how much error to expect when using the synthetic flows.
Reading between the lines
- A natural extension, not argued in the paper, is to retrain the same three-input pipeline to generate non-commuting trip types such as shopping, leisure, or freight, because POI and satellite signals encode activity destinations the same way they encode workplaces.
- The wide spread in validation correlations (0.477 in Senegal versus 0.816 in Rio) suggests users should treat generated matrices for regions with thin reference data as plausible structural priors, not exact counts; the paper itself attributes the Senegal gap to mobile-phone coverage.
- The city sample is constrained by available boundaries and by the 500-meter-to-5-kilometer grid rule, so the global coverage may systematically under-represent cities with irregular footprints or very small administrative extents.
- If the transfer claim holds, the same approach could produce temporally resolved flows by conditioning on periodic features such as time-of-day imagery, moving beyond static work-hour matrices.
Editorial analysis
A structured set of objections, weighed in public.
Referee Report
Summary. The paper introduces a global dataset of intra-city commuting Origin-Destination (OD) flows for 1,625 cities, generated by applying the WEDAN graph diffusion model conditioned on population, satellite imagery, and point-of-interest features. The dataset is publicly released with city boundaries, region divisions, and OD matrices. The authors validate the generated flows through comparisons with mobile-location-based flows in four cities, census data in the UK and US, geospatial visualization, downstream predictions of daytime population and transport carbon emissions, and scale-free network analysis, and they assert that the spatial distributions of the generated flows closely align with real-world observations.
Significance. If the accuracy claim is substantiated, the dataset is a valuable new resource: it provides unprecedented geographic coverage of intra-city commuting flows and pairs it with a public repository and a web interface. The external validations against UK/US census data and several mobile-location datasets are concrete strengths, and the downstream population and carbon-emission tasks show plausible behavior on the tested cities. However, the central reliability claim currently rests on an undocumented transfer of WEDAN to unseen cities and on aggregate error metrics (CPC=0.572, NRMSE=0.927) that are more consistent with a coarse approximation than with 'close alignment.' The paper's contribution is therefore significant but not yet fully established.
major comments (5)
- [Methods, 'Generating Commuting OD Flows via Generative Graph Diffusion Models'] The manuscript states 'we adopt WEDAN' but does not specify the OD flow data on which WEDAN was trained, whether any city-specific fine-tuning was performed, or whether any held-out cities were used to evaluate cross-city transfer. This omission is load-bearing because the central claim is that the generated flows are reliable for all 1,625 cities; if WEDAN was trained on a limited set of benchmark cities and applied without adaptation, the matrices for unvalidated cities may reflect the training distribution rather than local travel behavior. Please provide the training data provenance, the transfer procedure, and an explicit transfer experiment (e.g., train on a subset of cities, generate flows for held-out cities, and report the same metrics for those cities).
- [Technical Validation, Eq. (1)] The reported quantitative metrics do not support the abstract's claim that 'the spatial distributions of the generated flows closely align with real-world observations.' CPC=0.572 means only about 57.2% of commuting mass overlaps with the census flows, and NRMSE=0.927 means the RMSE is 92.7% of the standard deviation of the observed flow distribution—errors are almost as large as the spread of true flow values. The authors should temper the abstract and summary statements, report per-city CPC/NRMSE distributions instead of a single aggregate, and discuss how zero-heavy sparse OD matrices affect these metrics.
- [Technical Validation, 'Regression Analysis Based on Mobile Location Data'] The Senegal comparison yields SCC=0.477, which is weak, and the explanation that this is due to lower mobile phone coverage is offered without quantitative support. Because the dataset includes many low- and middle-income countries, the paper must present reference-data quality metrics (e.g., number of users, coverage fraction) for Senegal and the other validation cities, or explicitly acknowledge that accuracy degrades in data-scarce regions and quantify that degradation.
- [Technical Validation, 'Downstream Tasks in Multiple Urban Applications and Corresponding SDGs'] The carbon emission estimation uses fixed city-wide modal shares (60% private cars, 35% public transit, 5% cycling/walking) and fixed emission factors without city-specific calibration. The reported correlation of 0.66 with Carbon Monitor Cities may substantially reflect city population or geographic size rather than the accuracy of the OD flows; no normalization by population and no comparison against a simpler null model (e.g., using only population or a gravity model) are reported. Please state whether emissions are total or per capita and include such a baseline comparison.
- [Technical Validation, Figures 6-14] The quantitative validations cover only a small subset of the 1,625 cities (Beijing, Shanghai, Rio de Janeiro, Senegal, UK/US census cities, and four Chinese cities), and no error metrics are provided for the remaining cities. The claim that the dataset is reliable at global scale is thus only demonstrated for a few urban contexts. The authors should either expand the validation to a larger, more diverse sample of cities or explicitly restrict the reliability claim to the validated subset and present the remainder as unvalidated synthetic output.
minor comments (6)
- [Technical Validation, Eq. (1)] The text defines P_F, P_hatF, and KL divergence, but the displayed equations contain no KL term; this appears to be a leftover definition from a previous version and should be corrected or removed.
- [Data Records, 'Commuting OD Flows'] The sentence 'The matrices contains commuting OD flows' should read 'The matrices contain commuting OD flows,' and 'gives a intuitive physical representation' should read 'gives an intuitive physical representation.'
- [Figure 16] The carbon-emission comparison plot lacks axis labels and units; please specify whether values are total emissions or per capita, and describe the city sample used in the comparison.
- [Technical Validation, 'Error Analysis of Generated Flows Against Census Data in the UK and US'] The phrase 'This is a very high level in the perspective of commuting OD flow generation' is vague; please specify the exact benchmark used from ref. 41 and the corresponding CPC value so that the comparison is quantitative and reproducible.
- [Methods, 'Determining City Boundaries and Geographic Units'] The grid-size heuristic (5% of total boundary length, clipped between 500 m and 5 km) is presented without a sensitivity analysis; please comment on how the choice of grid size affects the downstream validation metrics.
- [Code availability] The repository currently provides only example loading and processing code; to support reproducibility of the dataset generation, the WEDAN training and inference code (or a link to the version from ref. 41) and the trained model weights should be made available.
Circularity Check
No significant circularity: validation uses external benchmarks; WEDAN self-citation is methodological, not load-bearing.
full rationale
The paper's central claim is that the generated commuting OD flows for 1,625 cities are reliable enough for sustainability research. This claim is supported by validation against external data: mobile location data for Beijing, Shanghai, Rio de Janeiro, and Senegal; UK/US census commuting flows; Baidu population heatmaps; and Carbon Monitor Cities emissions. None of these reference quantities are defined in terms of the model's outputs, and no validation metric is used as a fitting target. The adoption of WEDAN from the authors' prior work (ref. 41) is a methodological choice, not a derived result; the paper does not claim to prove WEDAN's optimality here. The downstream carbon-emission estimate uses hand-set modal shares, but these are not fitted to the comparison data. The scale-free property check is a sanity check on the generative model, not a prediction derived from first principles; even if it is weakly informative, it is not load-bearing for the global reliability claim. The main weaknesses—omitted training details, potential transfer gap for unvalidated cities, and modest CPC/NRMSE values—are correctness and quality concerns, not circularity. No equation in the paper reduces a prediction to its inputs by construction. The paper is therefore not circular in a way that would invalidate its derivation chain; the self-citations are normal methodological references rather than load-bearing circular support.
Assumptions & free parameters
free parameters (3)
- Grid size coefficient and bounds =
5% of city boundary length; min 500m, max 5km
- Modal shares for carbon emission validation =
60% private cars, 35% public transit, 5% cycling/walking
- WEDAN training hyperparameters and model weights =
not disclosed
assumptions (5)
- domain assumption WEDAN trained on commuting OD benchmarks generalizes to all cities without retraining
- domain assumption Node features (36 population/demographic, 1024 RemoteCLIP imagery, 34 POI) suffice to characterize urban region functions for flow generation
- domain assumption City boundaries from WOF and GUI provide a representative global city set
- domain assumption Commuting networks are universally scale-free
- domain assumption WorldPop, OSM POIs, and Esri satellite imagery are globally complete and comparable across countries
Cite this review
Pith. "Pith review of A Global Commuting Origin-Destination Flow Dataset for Urban Sustainable Development." pith.science (2026). https://pith.science/paper/EMLXYBWZ
@misc{pith2026250517111,
  author       = {Pith},
  title        = {Pith review of: A Global Commuting Origin-Destination Flow Dataset for Urban Sustainable Development},
  year         = {2026},
  howpublished = {\url{https://pith.science/paper/EMLXYBWZ}},
  note         = {Machine review of arXiv:2505.17111}
}
read the original abstract
Commuting Origin-Destination (OD) flows capture movements of people from residences to workplaces, representing the predominant form of intra-city mobility and serving as a critical reference for understanding urban dynamics and supporting sustainable policies. However, acquiring such data requires costly, time-consuming censuses. In this study, we introduce a commuting OD flow dataset for cities around the world, spanning 6 continents, 179 countries, and 1,625 cities, providing unprecedented coverage of dynamics under diverse urban environments. Specifically, we collected fine-grained demographic data, satellite imagery, and points of interest~(POIs) for each city as foundational inputs to characterize the functional roles of urban regions. Leveraging these, a deep generative model is employed to capture the complex relationships between urban geospatial features and human mobility, enabling the generation of commuting OD flows between urban regions. Comprehensively, validation shows that the spatial distributions of the generated flows closely align with real-world observations. We believe this dataset offers a valuable resource for advancing sustainable urban development research in urban science, data science, transportation engineering, and related fields.
Figures


Figures from the paper (14 more)






Reference graph
Works this paper leans on
-
[1]
The new science of cities (MIT press, 2013)
Batty, M. The new science of cities (MIT press, 2013)
work page 2013
-
[2]
Big data, smart cities and city planning
Batty, M. Big data, smart cities and city planning. Dialogues human geography 3, 274–279 (2013)
work page 2013
-
[3]
M., Lobo, J., Helbing, D., Kühnert, C
Bettencourt, L. M., Lobo, J., Helbing, D., Kühnert, C. & West, G. B. Growth, innovation, scaling, and the pace of life in cities. Proc. national academy sciences 104, 7301–7306 (2007)
work page 2007
-
[4]
Metacity: Data-driven sustainable development of complex cities
Zhang, Y .et al. Metacity: Data-driven sustainable development of complex cities. The Innov. (2025)
work page 2025
-
[5]
Hillier, B. & Hanson, J. The social logic of space (Cambridge university press, 1989)
work page 1989
-
[6]
Making a city: Urbanity, vitality and urban design
Montgomery, J. Making a city: Urbanity, vitality and urban design. J. urban design 3, 93–116 (1998)
work page 1998
-
[7]
Rong, C., Ding, J. & Li, Y . An interdisciplinary survey on origin-destination flows modeling: Theory and techniques. arXiv preprint arXiv:2306.10048 (2023)
arXiv 2023
-
[8]
Liu, Z. et al. Learning geo-contextual embeddings for commuting flow prediction. In Proceedings of the AAAI conference on artificial intelligence, vol. 34, 808–816 (2020)
work page 2020
Show all 79 references
-
[9]
S., Choudhury, C
Iqbal, M. S., Choudhury, C. F., Wang, P. & González, M. C. Development of origin–destination matrices using mobile phone call data. Transp. Res. Part C: Emerg. Technol.40, 63–74 (2014)
2014
-
[10]
& Pappalardo, L
Simini, F., Barlacchi, G., Luca, M. & Pappalardo, L. A deep gravity model for mobility flows generation. Nat. communica- tions 12, 6576 (2021)
2021
-
[11]
Novaco, R. W. & Gonzalez, O. I. Commuting and well-being. Technol. well-being 3, 174–4 (2009)
2009
-
[12]
& Ratti, C
Dong, L., Santi, P., Liu, Y ., Zheng, S. & Ratti, C. The universality in urban commuting across and within cities.arXiv preprint arXiv:2204.12865 (2022)
2022 arXiv
-
[13]
Hamilton, B. W. & Röell, A. Wasteful commuting. J. political economy 90, 1035–1053 (1982)
1982
-
[14]
The sustainable mobility paradigm
Banister, D. The sustainable mobility paradigm. Transp. policy 15, 73–80 (2008)
2008
-
[15]
& Kenworthy, J.Sustainability and cities: overcoming automobile dependence (Island Press, 1998)
Newman, P. & Kenworthy, J.Sustainability and cities: overcoming automobile dependence (Island Press, 1998)
1998
-
[16]
Haraguchi, M. et al. Human mobility data and analysis for urban resilience: A systematic review. Environ. Plan. B: Urban Anal. City Sci. 49, 1507–1535 (2022). 7/21
2022
-
[17]
Ribeiro, P. J. G. & Gonçalves, L. A. P. J. Urban resilience: A conceptual framework. Sustain. Cities Soc. 50, 101625 (2019)
2019
-
[18]
Mistry, D. et al. Inferring high-resolution human mixing patterns for disease modeling. Nat. communications 12, 323 (2021)
2021
-
[19]
& Shigetaka, K
Imai, R., Ikeda, D., Shingai, H., Nagata, T. & Shigetaka, K. Origin-destination trips generated from operational data of a mobile network for urban transportation planning. J. Urban Plan. Dev. 147, 04020049 (2021)
2021
-
[20]
& Jenelius, E
Cats, O. & Jenelius, E. Dynamic vulnerability analysis of public transport networks: mitigation effects of real-time information. Networks Spatial Econ. 14, 435–463 (2014)
2014
-
[21]
Evaluating public transportation health benefits (Victoria Transport Policy Institute Victoria, BC, Canada, 2012)
Litman, T. Evaluating public transportation health benefits (Victoria Transport Policy Institute Victoria, BC, Canada, 2012)
2012
-
[22]
Balcan, D. et al. Multiscale mobility networks and the spatial spreading of infectious diseases. Proc. national academy sciences 106, 21484–21489 (2009)
2009
-
[23]
Kraemer, M. U. et al. The effect of human mobility and control measures on the covid-19 epidemic in china. Science 368, 493–497 (2020)
2020
-
[24]
C., Moura, S
Xu, Y ., Çolak, S., Kara, E. C., Moura, S. J. & González, M. C. Planning for electric vehicle needs by coupling charging profiles with urban mobility. Nat. Energy 3, 484–493 (2018)
2018
-
[25]
V ., Min, L., Azevedo, I
Powell, S., Cezar, G. V ., Min, L., Azevedo, I. M. L. & Rajagopal, R. Charging infrastructure access and operation to reduce the grid impacts of deep electric vehicle adoption. Nat. Energy 7, 932–945 (2022)
2022
-
[26]
Achieving just transitions to low-carbon urban mobility
Schwanen, T. Achieving just transitions to low-carbon urban mobility. Nat. Energy 6, 685–687 (2021)
2021
-
[27]
Zeng, J., Liu, Y ., Ding, J., Yuan, J. & Li, Y . Estimating on-road transportation carbon emissions from open data of road network and origin-destination flow data. In Proceedings of the AAAI Conference on Artificial Intelligence, vol. 38, 22493–22501 (2024)
2024
-
[28]
Karimi, H., Shetab Boushehri, S. N. & Nasiri, R. Origin-destination matrix estimation using socio-economic information and traffic counts on uncongested networks. Int. J. Transp. Eng. 8, 165–183 (2020)
2020
-
[29]
& Mohanty, S
Pourebrahim, N., Sultana, S., Thill, J.-C. & Mohanty, S. Enhancing trip distribution prediction with twitter data: comparison of neural network and gravity models. InProceedings of the 2nd acm sigspatial international workshop on ai for geographic knowledge discovery, 5–8 (2018)
2018
-
[30]
& Thill, J.-C
Pourebrahim, N., Sultana, S., Niakanlahiji, A. & Thill, J.-C. Trip distribution modeling with twitter data. Comput. Environ. Urban Syst. 77, 101354 (2019)
2019
-
[31]
Yao, X. et al. Spatial origin-destination flow imputation using graph convolutional networks. IEEE Transactions on Intell. Transp. Syst. 22, 7474–7484 (2020)
2020
-
[32]
Lenormand, M. et al. Influence of sociodemographic characteristics on human mobility. Sci. reports 5, 10075 (2015)
2015
-
[33]
& Ramasco, J
Lenormand, M., Bassolas, A. & Ramasco, J. J. Systematic comparison of trip distribution laws and models. J. Transp. Geogr. 51, 158–169 (2016)
2016
-
[34]
Rong, C., Ding, J., Liu, Z. & Li, Y . Complexity-aware large scale origin-destination network generation via diffusion model. arXiv preprint arXiv:2306.04873 (2023)
2023 arXiv
-
[35]
& Ding, J
Rong, C., Feng, J. & Ding, J. Goddag: generating origin-destination flow for new cities via domain adversarial training. IEEE Transactions on Knowl. Data Eng. 35, 10048–10057 (2023)
2023
-
[36]
W., Zimmermann, A., Schönfelder, S., Rindsfüser, G
Axhausen, K. W., Zimmermann, A., Schönfelder, S., Rindsfüser, G. & Haupt, T. Observing the rhythms of daily life: A six-week travel diary. Transportation 29, 95–124 (2002)
2002
-
[37]
& Axhausen, K
Schuessler, N. & Axhausen, K. W. Processing raw data from global positioning systems without additional information. Transp. Res. Rec. 2105, 28–36 (2009)
2009
-
[38]
& Ratti, C
Calabrese, F., Di Lorenzo, G., Liu, L. & Ratti, C. Estimating origin-destination flows using opportunistically collected mobile phone location data from one million users in boston metropolitan area. Tech. Rep. (2011)
2011
-
[39]
& González, M
Alexander, L., Jiang, S., Murga, M. & González, M. C. Origin–destination trips by purpose and time of day inferred from mobile phone data. Transp. research part c: emerging technologies58, 240–250 (2015)
2015
-
[40]
Toole, J. L. et al. The path most traveled: Travel demand estimation using big data resources. Transp. Res. Part C: Emerg. Technol. 58, 162–177 (2015). 8/21
2015
-
[41]
Rong, C., Ding, J., Liu, Y . & Li, Y . A large-scale benchmark dataset for commuting origin-destination matrix generation. arXiv preprint arXiv:2407.15823 (2024)
2024 arXiv
-
[42]
Han, Z. et al. Gui: A comprehensive dataset of global urban infrastructure based on geospatial visual foundation models. In Proceedings of the 32nd ACM International Conference on Advances in Geographic Information Systems, 701–704 (2024)
2024
-
[43]
Origin-destination matrix prediction via graph convolution: a new perspective of passenger demand modeling
Wang, Y .et al. Origin-destination matrix prediction via graph convolution: a new perspective of passenger demand modeling. In Proceedings of the 25th ACM SIGKDD international conference on knowledge discovery & data mining, 1227–1235 (2019)
2019
-
[44]
Zhang, J., Zheng, Y . & Qi, D. Deep spatio-temporal residual networks for citywide crowd flows prediction. InProceedings of the AAAI conference on artificial intelligence, vol. 31 (2017)
2017
-
[45]
& Yang, H
Zheng, Y ., Capra, L., Wolfson, O. & Yang, H. Urban computing: concepts, methodologies, and applications. ACM Transactions on Intell. Syst. Technol. (TIST)5, 1–55 (2014)
2014
-
[46]
Tatem, A. J. Worldpop, open data for spatial demography. Sci. data 4, 1–4 (2017)
2017
-
[47]
Barbosa, H. et al. Human mobility: Models and applications. Phys. Reports 734, 1–74 (2018)
2018
-
[48]
Zipf, G. K. The p 1 p 2/d hypothesis: on the intercity movement of persons. Am. sociological review 11, 677–686 (1946)
1946
-
[49]
World imagery [basemap]
Esri. World imagery [basemap]. ArcGIS Online (2020). Available at: https://www.arcgis.com/home/item.html?id= 10df2279f9684e4a9f6a7f08febac2a9. Accessed: 2025-01-12
2020
-
[50]
Liu, F. et al. Remoteclip: A vision language foundation model for remote sensing. IEEE Transactions on Geosci. Remote. Sens. (2024)
2024
-
[51]
& Xie, X
Yuan, J., Zheng, Y . & Xie, X. Discovering regions of different functions in a city using human mobility and pois. In Proceedings of the 18th ACM SIGKDD international conference on Knowledge discovery and data mining , 186–194 (2012)
2012
-
[52]
Planet dump retrieved from https://planet.osm.org
OpenStreetMap contributors. Planet dump retrieved from https://planet.osm.org . https://www.openstreetmap.org (2025)
2025
-
[53]
& Abbeel, P
Ho, J., Jain, A. & Abbeel, P. Denoising diffusion probabilistic models. Adv. neural information processing systems 33, 6840–6851 (2020)
2020
-
[54]
Vignac, C. et al. Digress: Discrete denoising diffusion for graph generation. arXiv preprint arXiv:2209.14734 (2022)
2022 arXiv
-
[55]
Rong, C., Ding, J. & Li, Y . A global commuting origin-destination flow dataset for urban sustainable development, https://doi.org/10.6084/m9.figshare.28350107 (2025). Dataset
2025 doi
-
[56]
& Rajna, B
Gundlegård, D., Rydergren, C., Breyer, N. & Rajna, B. Travel demand estimation and network assignment based on cellular network data. Comput. Commun. 95, 29–42 (2016)
2016
-
[57]
& Ran, B
Pan, C., Lu, J., Di, S. & Ran, B. Cellular-based data-extracting method for trip distribution. Transp. research record1945, 33–39 (2006)
2006
-
[58]
& Cai, M
Yang, Y ., Xiong, C., Zhuo, J. & Cai, M. Detecting home and work locations from mobile phone cellular signaling data. Mob. Inf. Syst. 2021, 5546329 (2021)
2021
-
[59]
Xu, F., Zhang, P. & Li, Y . Context-aware real-time population estimation for metropolis. InProceedings of the 2016 ACM International Joint Conference on Pervasive and Ubiquitous Computing, 1064–1075 (2016)
2016
-
[60]
Huo, D. et al. Carbon monitor cities near-real-time daily estimates of co2 emissions from 1500 cities worldwide. Sci. Data 9, 533 (2022)
2022
-
[61]
Meerow, S., Newell, J. P. & Stults, M. Defining urban resilience: A review. Landsc. urban planning 147, 38–49 (2016)
2016
-
[62]
Network resilience for transport security: Some methodological considerations
Reggiani, A. Network resilience for transport security: Some methodological considerations. Transp. policy 28, 63–68 (2013)
2013
-
[63]
Urban infrastructure is not a tree: integrating and decentralizing urban infrastructure systems
Derrible, S. Urban infrastructure is not a tree: integrating and decentralizing urban infrastructure systems. Environ. Plan. B: Urban Anal. City Sci. 44, 553–569 (2017)
2017
-
[64]
& Yao, L
Sun, L., Huang, Y ., Chen, Y . & Yao, L. Vulnerability assessment of urban rail transit based on multi-static weighted method in beijing, china. Transp. research part A: Policy Pract.108, 12–24 (2018)
2018
-
[65]
& Marshall, S
Batty, M. & Marshall, S. The origins of complexity theory in cities and planning. Complex. theories cities have come age: An overview with implications to urban planning design 21–45 (2012). 9/21
2012
-
[66]
Lin, D.-Y ., Waller, S. T. & Lin, M.-Y . A review of urban planning approaches to reduce air pollution exposures.Curr. Environ. Heal. Reports 1–10 (2024)
2024
-
[67]
& Heinonen, J
Raudsepp, J., Árnadóttir, Á., Czepkiewicz, M. & Heinonen, J. Long-distance travel and the urban environment: Results from a qualitative study in reykjavik. Urban planning 6, 257–270 (2021)
2021
-
[68]
& Westin, K
Sandow, E. & Westin, K. The persevering commuter–duration of long-distance commuting. Transp. Res. Part A: Policy Pract. 44, 433–445 (2010)
2010
-
[69]
Mitra, S. K. & Saphores, J.-D. M. Why do they live so far from work? determinants of long-distance commuting in california. J. transport geography 80, 102489 (2019)
2019
-
[70]
Sakai, T. et al. Simmobility freight: An agent-based urban freight simulator for evaluating logistics solutions. Transp. Res. Part E: Logist. Transp. Rev.141, 102017 (2020)
2020
-
[71]
Adnan, M. et al. Simmobility: A multi-scale integrated agent-based simulation platform. In 95th Annual Meeting of the Transportation Research Board Forthcoming in Transportation Research Record, vol. 2 (The National Academies of Sciences, Engineering, and Medicine Washington, ...
2016
-
[72]
& Willumsen, L
de Dios Ortúzar, J. & Willumsen, L. G. Modelling transport (John wiley & sons, 2024)
2024
-
[73]
& O’Mahony, M
Cantwell, M., Caulfield, B. & O’Mahony, M. Examining the factors that impact public transport commuting satisfaction. J. public transportation 12, 1–21 (2009)
2009
-
[74]
& Skippon, S
Chng, S., White, M., Abraham, C. & Skippon, S. Commuting and wellbeing in london: The roles of commute mode and local public transport connectivity. Prev. medicine 88, 182–188 (2016)
2016
-
[75]
Hao, Q., Chen, L., Xu, F. & Li, Y . Understanding the urban pandemic spreading of covid-19 with real world mobility data. In Proceedings of the 26th ACM SIGKDD international conference on knowledge discovery & data mining, 3485–3492 (2020)
2020
-
[76]
Chen, L. et al. Strategic covid-19 vaccine distribution can simultaneously elevate social utility and equity. Nat. Hum. Behav. 6, 1503–1514 (2022)
2022
-
[77]
Commuting, energy consumption, and the challenge of sustainable urban development
Modarres, A. Commuting, energy consumption, and the challenge of sustainable urban development. Curr. Opin. Environ. Sustain. 25, 1–7 (2017)
2017
-
[78]
& Hanaoka, T
Zhang, R. & Hanaoka, T. Cross-cutting scenarios and strategies for designing decarbonization pathways in the transport sector toward carbon neutrality. Nat. communications 13, 3629 (2022)
2022
-
[79]
& Johansson, D
Morfeldt, J. & Johansson, D. J. Impacts of shared mobility on vehicle lifetimes and on the carbon footprint of electric vehicles. Nat. communications 13, 6400 (2022). Acknowledgements In this work, we collect the data from multiple sources, including Who’s On First, WorldPop, ...
2022
Reviewed August 7, 2026 · model on record in the stance chip above.
Discussion (0). Continue with ORCID to comment.