Modeling of CoRoT and Spitzer lightcurves in NGC 2264 caused by an optically thick warp
Pith reviewed 2026-05-25 16:44 UTC · model grok-4.3
The pith
CoRoT and Spitzer lightcurves of four stars in NGC 2264 are reproduced by an optically thick warp causing stellar occultation plus asymmetric disk emission.
A machine-rendered reading of the paper's core claim, the machinery that carries it, and where it could break.
Core claim
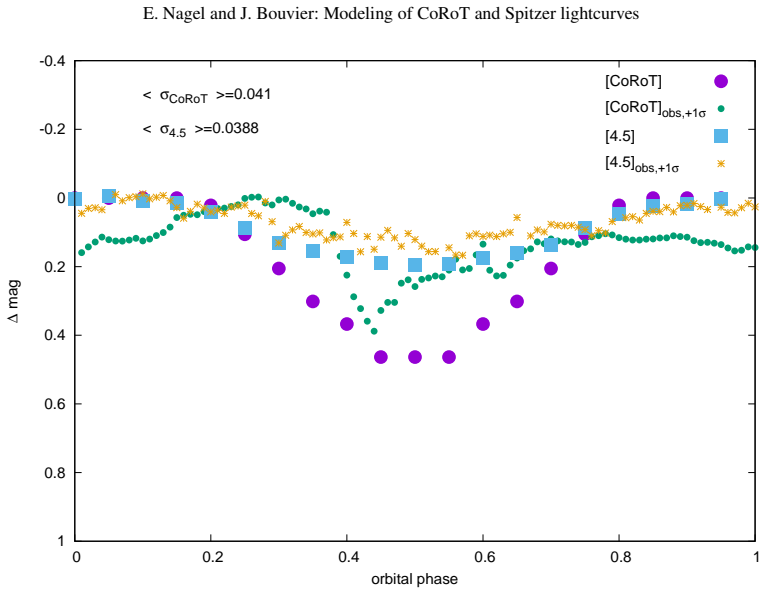
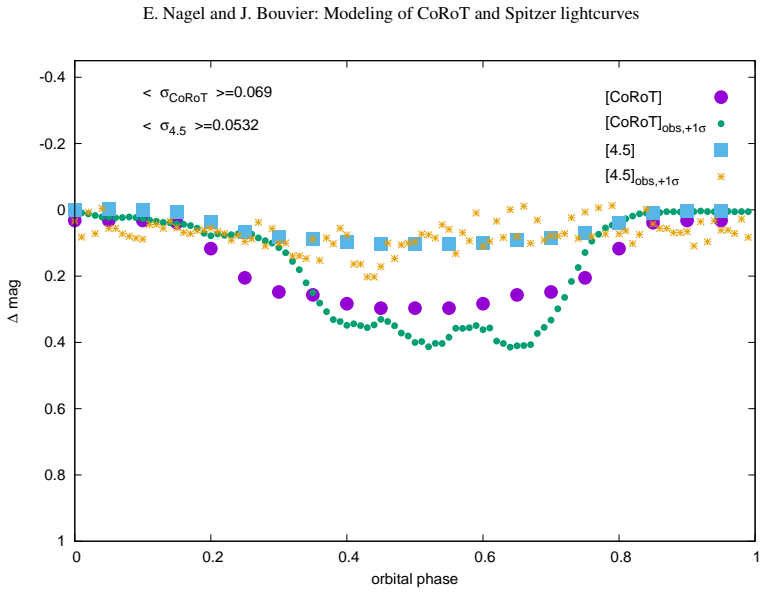
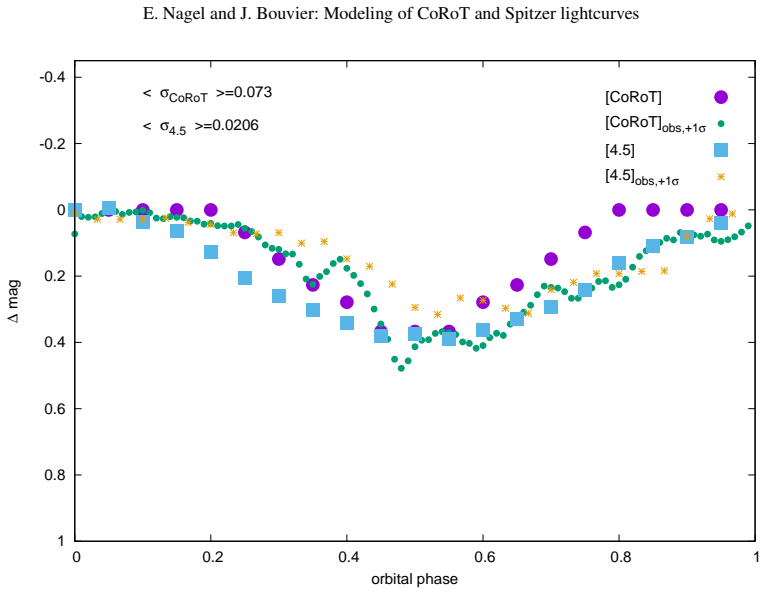
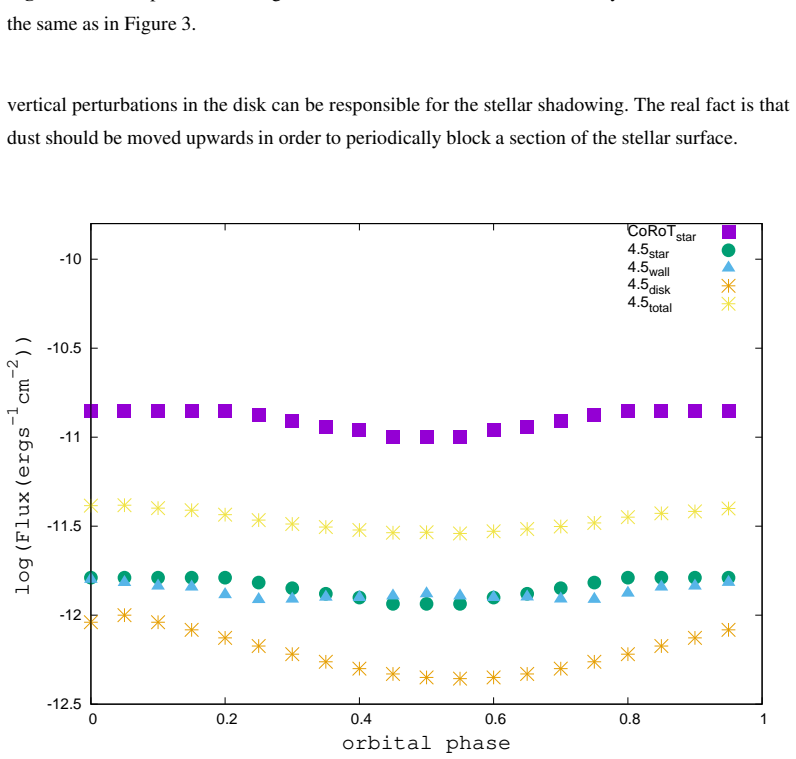
The magnitude amplitude of the CoRoT and Spitzer observations for Mon-660, Mon-811, Mon-1140 and Mon-1308 can be described with the emission coming from the system components. The difference between them is the value of the disk flux compared with the wall flux and the azimuthal variations of the former. This result points out the importance of the hydrodynamical interaction between the stellar magnetic field and the disk.
What carries the argument
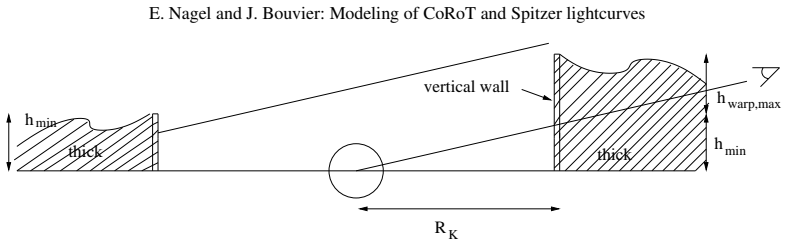
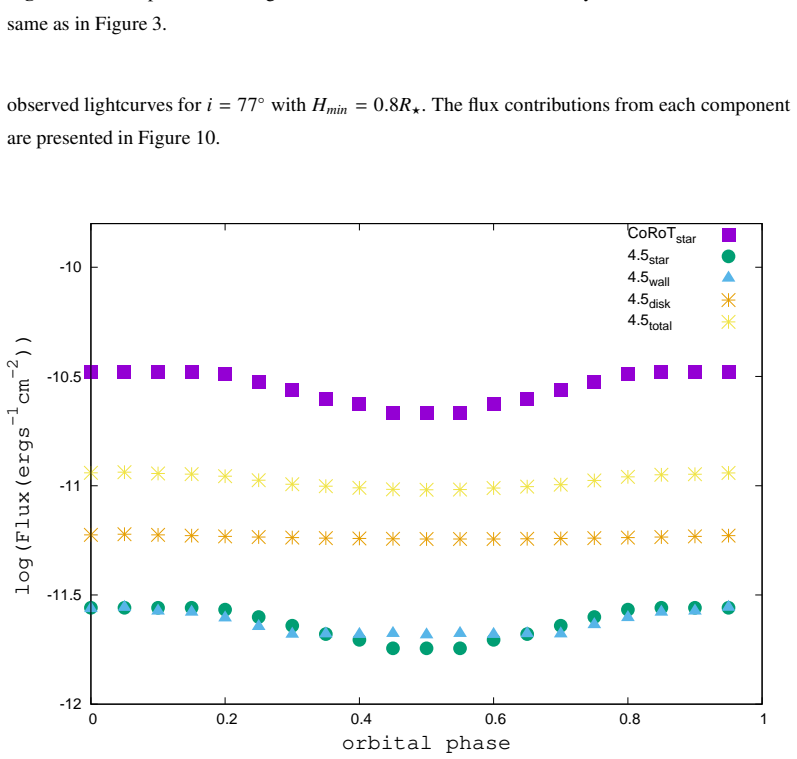
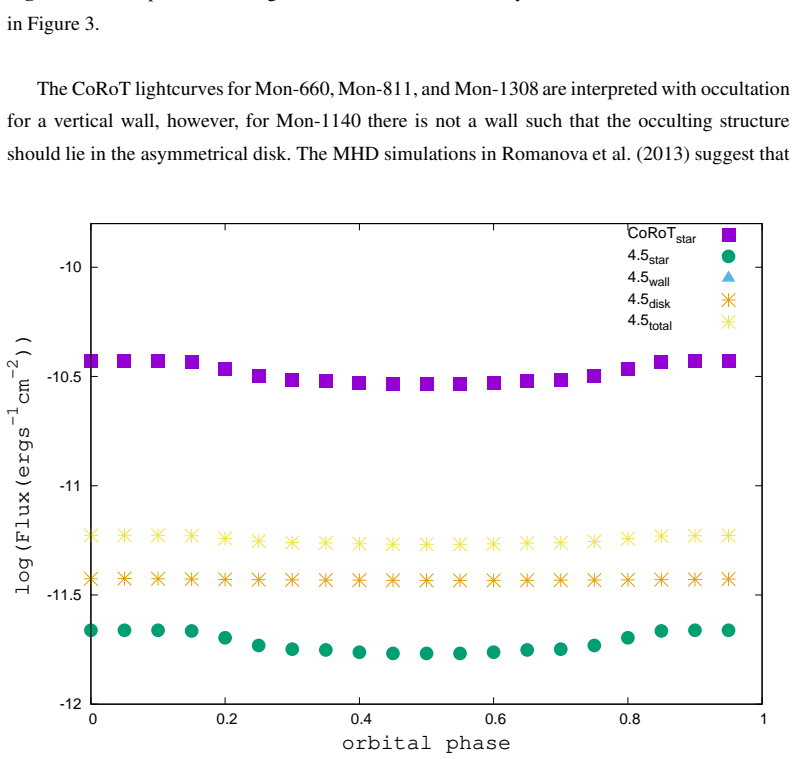
Optically thick warp consisting of a wall that produces stellar occultation in optical light and an asymmetric disk that produces infrared emission, allowing one structure to fit both wavelength regimes simultaneously.
If this is right
- Hydrodynamical interaction between the stellar magnetic field and the disk is required to sustain the warp geometry that fits the data.
- The same warp configuration can be used for other young stars whose optical and infrared lightcurves closely resemble each other.
- No extra variability sources are needed to match the observed amplitudes once the wall and disk fluxes are adjusted.
Where Pith is reading between the lines
- Similar warp structures may dominate photometric behavior in other pre-main-sequence stars with comparable multi-band lightcurves.
- Repeated observations could test whether the azimuthal disk variations remain stable over multiple rotation periods.
- The model predicts that the infrared lightcurve shape should track the optical one with a fixed lag set by the wall and disk geometry.
Load-bearing premise
A single warp structure with an optically thick wall and asymmetric disk is sufficient to reproduce both lightcurves without additional components such as stellar spots, accretion hotspots, or multiple warps.
What would settle it
New simultaneous optical and infrared observations that show phase or amplitude relations between the two bands that cannot be matched by varying only the disk-to-wall flux ratio and the azimuthal disk variations.
Figures
read the original abstract
Aims: We present an analysis of simultaneously observed CoRoT and Spitzer lightcurves for $4$ systems in the stellar forming region NGC 2264: Mon-660, Mon-811, Mon-1140 and Mon-1308. These objects share in common a high resemblance between the optical and infrared lightcurves, such that the mechanism responsible to produce them is the same. The aim of this paper is to explain both lightcurves simultaneously with only one mechanism. Methods: We have modeled the infrared emission as coming from a warp composed of an optically thick wall and an optically thick asymmetric disk beyond this location. We have modeled the optical emission mainly by partial stellar occultation by the warp. Results: The magnitude amplitude of the CoRoT and Spitzer observations for all the objects can be described with the emission coming from the system components. The difference between them is the value of the disk flux compared with the wall flux and the azimuthal variations of the former. This result points out the importance of the hydrodynamical interaction between the stellar magnetic field and the disk. Conclusions: CoRoT and Spitzer lightcurves for the stellar systems Mon-660, Mon-811, Mon-1140 and Mon-1308 can be simultaneously explained using the emission coming from an asymmetric disk and emission with stellar occultation by an optically thick wall.
Editorial analysis
A structured set of objections, weighed in public.
Referee Report
Summary. The paper presents modeling of simultaneous CoRoT optical and Spitzer infrared lightcurves for four pre-main sequence stars in NGC 2264 (Mon-660, Mon-811, Mon-1140, Mon-1308). It claims that both lightcurves can be explained by a single mechanism: an optically thick warp consisting of a wall that occults the star in optical wavelengths and an asymmetric disk that emits in the infrared, with differences in disk-to-wall flux ratio and azimuthal variations accounting for object-to-object differences.
Significance. If the central claim holds with a shared geometric warp structure across wavelengths, the work would provide evidence that magnetic field-disk interactions can produce warps responsible for observed multi-band photometric variability in young stellar objects. The approach of using one structure for both bands is potentially significant for understanding disk dynamics, though the current presentation relies on qualitative descriptions rather than quantitative validation.
major comments (3)
- [Abstract] Abstract: The assertion that 'the magnitude amplitude of the CoRoT and Spitzer observations for all the objects can be described with the emission coming from the system components' lacks supporting quantitative metrics such as reduced chi-squared values, RMS residuals, or parameter uncertainties from the fits.
- [Methods/Results] Methods and Results sections: The modeling of optical and IR lightcurves is described separately ('We have modeled the infrared emission as coming from a warp...' and 'We have modeled the optical emission mainly by partial stellar occultation by the warp'), without explicit statement or demonstration that geometric parameters of the warp (height, azimuthal extent, location) are held fixed and shared between the two bands in a joint fit.
- [Results] Results: The differences between objects are attributed to 'the value of the disk flux compared with the wall flux and the azimuthal variations of the former', but these are post-hoc fitted quantities; the manuscript does not show that the model makes a priori predictions independent of tuning to each lightcurve.
minor comments (1)
- [Abstract] Abstract: The conclusion restates the aims without adding new quantitative insight; a brief summary of fit quality or parameter ranges would improve clarity.
Simulated Author's Rebuttal
We thank the referee for the constructive report. We respond point-by-point to the major comments below.
read point-by-point responses
-
Referee: [Abstract] Abstract: The assertion that 'the magnitude amplitude of the CoRoT and Spitzer observations for all the objects can be described with the emission coming from the system components' lacks supporting quantitative metrics such as reduced chi-squared values, RMS residuals, or parameter uncertainties from the fits.
Authors: The abstract summarizes the main result at a high level. The body of the manuscript presents the modeling, but we agree that explicit quantitative fit statistics were not reported. We will add reduced chi-squared values, RMS residuals, and parameter uncertainties to the Results section in the revised version. revision: yes
-
Referee: [Methods/Results] Methods and Results sections: The modeling of optical and IR lightcurves is described separately ('We have modeled the infrared emission as coming from a warp...' and 'We have modeled the optical emission mainly by partial stellar occultation by the warp'), without explicit statement or demonstration that geometric parameters of the warp (height, azimuthal extent, location) are held fixed and shared between the two bands in a joint fit.
Authors: The warp is a single physical structure whose geometric parameters are therefore shared by construction between the optical and infrared models. The separate wording was chosen for readability. We will revise the Methods section to state explicitly that the parameters are held fixed across bands and will include a table listing the shared values. revision: yes
-
Referee: [Results] Results: The differences between objects are attributed to 'the value of the disk flux compared with the wall flux and the azimuthal variations of the former', but these are post-hoc fitted quantities; the manuscript does not show that the model makes a priori predictions independent of tuning to each lightcurve.
Authors: The flux ratios and azimuthal variations are indeed adjusted to match each lightcurve. The central claim is that one physical mechanism (the optically thick warp) simultaneously reproduces the correlated optical and infrared variability; object-to-object differences arise from the relative disk-to-wall flux and azimuthal structure. We will expand the discussion to clarify the fitting procedure and the limits of a priori prediction. revision: partial
Circularity Check
No circularity: standard model fitting to multi-band lightcurves
full rationale
The paper fits a parametric warp model (optically thick wall + asymmetric disk) to CoRoT and Spitzer data for four objects, reporting that amplitudes are reproduced and differences appear in fitted quantities such as disk-to-wall flux ratio and azimuthal extent. This is an explanatory fit, not a first-principles derivation whose output is forced to equal its inputs by construction. No equations reduce to self-definition, no fitted parameter is relabeled as an independent prediction, and no load-bearing self-citation or uniqueness theorem is invoked. The central claim remains an empirical demonstration that one geometric family can account for the observed resemblance between bands once parameters are adjusted; that adjustment is the expected content of such modeling work and does not constitute circularity.
Axiom & Free-Parameter Ledger
free parameters (3)
- wall height / optical depth
- disk-to-wall flux ratio
- azimuthal disk asymmetry amplitude
axioms (2)
- domain assumption The warp is optically thick at both optical and IR wavelengths.
- ad hoc to paper A single warp structure accounts for all observed variability.
Lean theorems connected to this paper
-
IndisputableMonolith/Foundation/RealityFromDistinction.leanreality_from_one_distinction unclear?
unclearRelation between the paper passage and the cited Recognition theorem.
We have modeled the infrared emission as coming from a warp composed of an optically thick wall and an optically thick asymmetric disk beyond this location. We have modeled the optical emission mainly by partial stellar occultation by the warp.
-
IndisputableMonolith/Cost/FunctionalEquation.leanwashburn_uniqueness_aczel unclear?
unclearRelation between the paper passage and the cited Recognition theorem.
The magnitude amplitude of the CoRoT and Spitzer observations for all the objects can be described with the emission coming from the system components. The difference between them is the value of the disk flux compared with the wall flux and the azimuthal variations of the former.
What do these tags mean?
- matches
- The paper's claim is directly supported by a theorem in the formal canon.
- supports
- The theorem supports part of the paper's argument, but the paper may add assumptions or extra steps.
- extends
- The paper goes beyond the formal theorem; the theorem is a base layer rather than the whole result.
- uses
- The paper appears to rely on the theorem as machinery.
- contradicts
- The paper's claim conflicts with a theorem or certificate in the canon.
- unclear
- Pith found a possible connection, but the passage is too broad, indirect, or ambiguous to say the theorem truly supports the claim.
Reference graph
Works this paper leans on
-
[1]
Akeson, R.L. et al. 2005, ApJ, 622, 440
work page 2005
-
[2]
Alencar, S.H.P . et al. 2010, A&A, 519, id.A88
work page 2010
-
[3]
Bouvier, J. et al. 1999, A& A, 349, 619
work page 1999
-
[4]
Cody, A.M. et al. 2014, AJ, 147, id.82 D’Alessio, P . et al. 1998, ApJ, 500, 411 D’Alessio, P . et al. 2005, ApJ, 621, 461 D’Alessio, P . et al. 2006, ApJ, 638, 314
work page 2014
-
[5]
Debes, J.H. et al. 2017, ApJ, 835, 205
work page 2017
-
[6]
Flaherty, K. et al. 2012, ApJ, 748, 71
work page 2012
-
[7]
Fonseca, N.N.J. et al. 2014, A& A, 567, A39
work page 2014
-
[8]
Kesseli, A.Y . et al. 2016, ApJ, 828, 42
work page 2016
- [9]
-
[10]
Long, M. et al. 2005, ApJ, 634, 1214
work page 2005
- [11]
-
[12]
McClure, M.K. et al. 2013, ApJ, 769, 73
work page 2013
-
[13]
McGinnis, P .T. et al. 2015, A& A, 577, A11 Morales-Calder´ on, M. et al. 2011, ApJ, 733, id.50
work page 2015
- [14]
-
[15]
Pollack, J.B. et al. 1994, ApJ, 421, 615
work page 1994
-
[16]
Rice, T.S. et al. 2015, AJ, 150, 132
work page 2015
-
[17]
Romanova, M.M. et al. 2013, MNRAS, 430, 699
work page 2013
-
[18]
Romanova, M.M. et al. 2018, NewA, 62, 94
work page 2018
-
[19]
Schneider, P .C. et al. 2018, A& A,
work page 2018
-
[20]
Scholz, A., Muzic, K. & Geers, V . 2015, MNRAS, 451, 26 Stauffer, J. et al. 2015, AJ, 149, 130 Stauffer, J. et al. 2016, AJ, 151, 60
work page 2015
-
[21]
Tannirkulam, A. et al. 2008, ApJL, 677, L51
work page 2008
-
[22]
Terquem, C. & Papaloizou, J.C.B. 2000, A& A, 360, 1031 V enuti, L. et al. 2014, A& A, 570, id.A82
work page 2000
-
[23]
Whitney, B.A. et al. 2013, ApJS, 207, 30 Appendix A: Appendix: Degeneracy between i and hwarp,max There is a geometrical degeneracy between the parameters i and hwarp, max because a larger i means that a lower hwarp, max is required to get the amount of the occultation necessary to explain the [CoRoT ] lightcurve. In Table A1 we put the pairs of values pr...
work page 2013
discussion (0)
Sign in with ORCID, Apple, or X to comment. Anyone can read and Pith papers without signing in.