REVIEW 2 major objections 6 minor 61 references
Graph Hierarchy: A novel approach to understanding hierarchical structures in complex networks
T0 review · 2 major / 6 minor · reviewed 2026-08-14 · deepseek-v4-flash
Pith's one-line read This paper generalizes trophic levels to every positively weighted directed graph and uses the resulting hierarchy to predict epidemic spread.
desk verdict A genuinely useful generalization of trophic levels with solid proofs in the core, but the epidemic application rests on exclusion thresholds that can manufacture the reported trend. read the letter →
The pith
A machine-rendered reading of the paper's core claim, the machinery that carries it, and where it could break.
The reading
What carries the argument
The load-bearing construction is the pair of Moore-Penrose solutions $g = M^+ d$ and $\gamma = \Lambda^+ \delta$, with $h = (g - \gamma)/2$, where $M$ and $\Lambda$ are the transposes of the weighted in-degree and out-degree Laplacians and $d$, $\delta$ are the weighted in- and out-degree vectors. Computing these levels via convex optimization avoids forming the pseudoinverse explicitly. The argument then works through hierarchical edge differences, whose weighted mean and variance define the democracy coefficient and the hierarchical incoherence, and through a projection identity that expresses influence centrality as the ratio of the projection of the degree vector onto the Laplacian kernel to the vertex degree. For strongly connected graphs the key result is $c\pi = D^2\epsilon$: backward influence centrality encodes the random-walk stationary distribution.
What would settle it
Run the same Monte Carlo SIS experiment on 500-vertex, 2500-edge NSPPM graphs across temperatures, and compare incidence with and without excluding graphs whose democracy coefficient is at most $20/2500$: if the monotone relationship between forward hierarchical incoherence and incidence survives when low-democracy graphs are included and the threshold is varied, the structural predictor is general; if the relationship appears only because of that exclusion, it is not.
Extended reading notes
Core claim
The paper's central claim is that hierarchical levels, defined by $g = M^+ d$, $\gamma = \Lambda^+ \delta$, and $h = (g - \gamma)/2$, generalize trophic levels to every positively weighted simple directed graph, including strongly connected graphs with no basal vertices. Forward hierarchical levels grade vertices by distance from source subgraphs; backward levels grade them by distance from sink subgraphs; their difference combines the control and dependence perspectives into one ranking. On this foundation the paper defines influence centrality (a vertex is an influencer exactly when its influence centrality is positive) and the democracy coefficient (zero for simply forward influenced graphs, one for balanced graphs), and proves the identity $c\pi = D^2\epsilon$ relating backward influence centrality to the stationary distribution of a random walk on strongly connected graphs. The paper also shows that forward hierarchical incoherence matches the predictive behaviour of trophic incoherence on graphs where both are defined, and extends the prediction to source-less NSPPM graphs in an SIS model.
Load-bearing premise
The load-bearing premise is the empirical threshold that source-less NSPPM graphs with democracy coefficient at most $20/2500$ can be excluded from the epidemic analysis; if that threshold is an artifact of the graph generator rather than a general property of source-less networks, the claimed link between hierarchical incoherence and epidemic incidence is not established.
Editorial extensions
If this is right
- Trophic analysis is no longer restricted to graphs with basal vertices: hierarchical levels, influence centrality, and hierarchical incoherence are defined on any positively weighted simple directed graph, and on undirected graphs through the forward or backward version.
- Influencer identification becomes a closed-form computation: a vertex drives the forward dynamics exactly when its forward influence centrality is positive, and in strongly connected graphs every vertex has positive forward and backward influence centrality.
- The democracy coefficient gives a topological feedback measure that decomposes over minimal source and sink subgraphs, equals 1 on balanced graphs, and, if the paper's conjecture holds, always lies between 0 and 1.
- Epidemic spread on source-less directed graphs can be read off from structure: lower forward hierarchical incoherence corresponds to higher SIS incidence, matching the known trophic-coherence effect in a broader setting.
- Because $c\pi = D^2\epsilon$ holds in strongly connected graphs, backward influence centrality is a structural proxy for where a random walk spends its time.
Reading between the lines
- Editorial inference: the hierarchical level $h$ itself could be used as a combined control-and-dependence centrality for arbitrary directed networks, including the core-periphery detection the paper mentions only as initial exploration.
- Editorial inference: if the democracy-coefficient conjecture (always at most 1, equality exactly for balanced graphs) is proven, the coefficient becomes a normalized, size-independent feedback measure for comparing graphs.
- Editorial inference: the epidemic relationship could be tested on empirical source-less networks such as gene-regulatory or financial transaction graphs, to see whether the threshold $20/2500$ is a general feature or an artifact of the NSPPM generator.
- Editorial inference: the identity $c\pi = D^2\epsilon$ suggests using backward influence centrality to target sampling or intervention in strongly connected networks before explicitly computing stationary distributions.
Signed reviews
Editorial analysis
A structured set of objections, weighed in public.
Referee Report
Summary. The paper introduces a generalisation of trophic levels to arbitrary positively weighted simple directed graphs, defining forward and backward hierarchical levels as the minimum-norm least-squares solutions g = M^+ d and gamma = L^+ delta, and the vector of hierarchical levels as h = (g - gamma)/2. It then defines edge-level hierarchical differences, the democracy coefficient, the hierarchical incoherence parameter, and influence centrality, and proves several structural lemmas in the appendices, including a characterization of influencer vertices and a proportionality between influence centrality and the stationary distribution of a random walk on strongly connected graphs. The final section applies the framework to SIS contagion dynamics on a non-source variant of the preferential preying model (NSPPM) and claims that forward hierarchical incoherence predicts incidence.
Significance. The theoretical core is a clean and genuinely useful extension: it removes the basal-vertex restriction of trophic analysis, gives explicit pseudoinverse formulas, and supplies real proofs for the main structural lemmas (the democracy-coefficient formula, the influence-centrality characterization, and the random-walk relation). The proposed metrics are computationally attractive because the underlying algorithm avoids explicit pseudoinverse construction. If the epidemic claim were robust, the paper would offer a practical structural predictor of spreading dynamics. However, as presented, that applied claim is not yet established, because the supporting simulations rely on data-dependent exclusions that are not justified on independent grounds.
major comments (2)
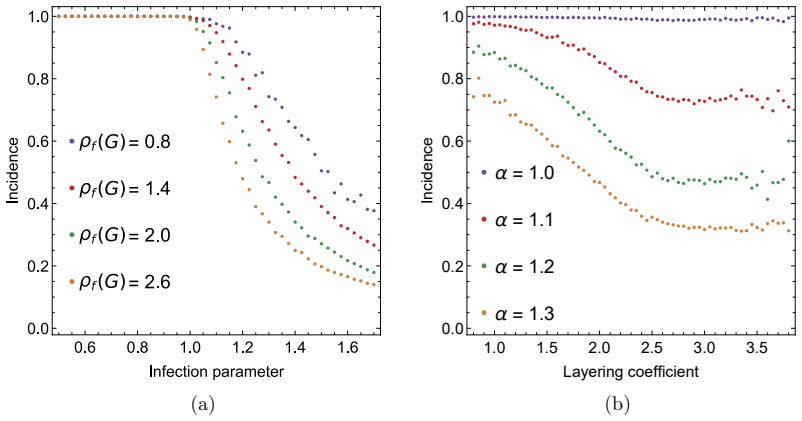
- [Section 4.2 / Appendices C.2 and D] The central applied claim that hierarchical incoherence predicts SIS incidence is obtained only after two data-dependent exclusions. First, NSPPM graphs with democracy coefficient at most 20/2500 are dropped, with the threshold 'chosen empirically based on the results' (Appendix C.2); second, simulations reaching the 1000-step limit are discarded, with means computed 'out of 1000 non timed out simulations' (Appendix D). The first exclusion removes a class that the paper itself describes as behaving differently (immediate full incidence or timeout), so the negative trend in Figure 3 may reflect a change of population rather than a structural effect; the second exclusion can bias the average incidence downward at the high-incoherence end if high-rho_f runs are more likely to time out with intermediate incidence. A no-exclusion reanalysis, or an outcome-independent treatment of non-terminating runs (for example, imputing their incidence or reporting worst-case bounds), is required before the claim that hierarchical structure predicts incidence can be accepted.
- [Section 3.2, Conjecture 3.6, and Appendix C.2] The classification of NSPPM graphs into 'small' and 'large' democracy-coefficient categories is given theoretical meaning through the unproved Conjecture 3.6: the text in Appendix C.2 says that if the conjecture is true, then the first category has 20 or fewer edges in its source subgraphs. Since the epidemic result depends on excluding this category, the manuscript should either prove the conjecture, or the specific implication used, or replace the exclusion criterion by a directly computed structural quantity such as the size or number of source subgraphs. As it stands, the threshold is purely empirical, and the reader cannot distinguish a natural class of graphs from a subset selected to make the trend visible.
minor comments (6)
- [Definition 2.3] Definition 2.3 contains the typos 'hierarchically deccomposable' and 'decompostition'; 'decomposable' and 'decomposition' are intended.
- [Appendix C.1] In Step 5 of the PPM algorithm, the expression 'L−N+B' uses an undefined symbol L; it should presumably be 'E−N+B', where E is the number of edges.
- [Section 4.2] The sentence 'In Figure 3 we show the average incidence for graphs with democracy coefficient 20/2500' is missing a comparison; from the preceding discussion it should read 'greater than 20/2500'.
- [Proof of Lemma 3.5] In the proof of Lemma 3.5, 'we get ηf(g) = 1' should be 'ηf(G) = 1'.
- [Proof of Lemma 3.9] In the proof of Lemma 3.9, 'Let D be G's weighted in-degree diagonal matrix' should be 'weighted out-degree diagonal matrix' to match the statement of the lemma, and the phrase 'the matrices D and D are invertible' contains a duplicated symbol.
- [Figure 9 caption and Appendix D] The Figure 9 caption says 'The average is taken over 1000 runs', while Appendix D says the average is taken 'out of 1000 non timed out simulations'; these statements should be reconciled.
Circularity Check
No significant circularity: the hierarchical-level formalism is a self-contained algebraic extension; the epidemic section's exclusions are data-selection limitations, not circular reductions.
full rationale
The derivation chain is self-contained rather than circular. The core objects (Definition 3.1) are explicit least-squares/pseudoinverse definitions: g = M^+d, gamma = L^+delta, h = (g - gamma)/2, and the structural lemmas (Lemma 3.4, 3.5, 3.8, 3.9) are proved in Appendix B using elementary linear algebra, the projection b = (I - M M^+)d, and the standard Markov-chain fact that the kernel of I - P^T is spanned by pi; none of these proofs assumes the incidence results or the democracy-coefficient split. The only passages that could look like fitted inputs are empirical selection choices in the epidemic study: Appendix C.2 states that the 20/2500 split 'was chosen empirically based on the results,' and Appendix D excludes timed-out runs and averages 'out of 1000 non timed out simulations.' These are legitimate robustness/selection concerns about the applied claim, but they are not circular reductions: the threshold is not a parameter used to define or compute the predicted incidence, and the theoretical metrics and lemmas do not depend on it. Per the hard rule requiring an exhibited equation-level reduction, I do not classify these as circularity. External citations used in proofs are independent published results, not self-citations by these authors, so there is no self-citation load-bearing issue. Score 0.
Assumptions & free parameters
free parameters (2)
- democracy coefficient exclusion threshold =
20/2500
- number of initially infected vertices =
25
assumptions (5)
- domain assumption The minimum-norm least-squares solution in Definition 3.1 is the correct generalization of trophic levels.
- domain assumption Forward influence dynamics (Section 2) is a faithful model of influence propagation.
- ad hoc to paper NSPPM graphs are representative of directed graphs without basal vertices.
- ad hoc to paper Conjecture 3.6 (democracy coefficient at most 1, equality iff balanced).
- standard math Strongly connected Laplacian kernel is spanned by a positive vector (Lemma B.7).
Cite this review
Pith. "Pith review of Graph Hierarchy: A novel approach to understanding hierarchical structures in complex networks." pith.science (2026). https://pith.science/paper/ERLBGMZD
@misc{pith2026190804358,
  author       = {Pith},
  title        = {Pith review of: Graph Hierarchy: A novel approach to understanding hierarchical structures in complex networks},
  year         = {2026},
  howpublished = {\url{https://pith.science/paper/ERLBGMZD}},
  note         = {Machine review of arXiv:1908.04358}
}
read the original abstract
Trophic coherence, a measure of a graph's hierarchical organisation, has been shown to be linked to a graph's structural and dynamical aspects such as cyclicity, stability and normality. Trophic levels of vertices can reveal their functional properties and partition and rank the vertices accordingly. Yet trophic levels and hence trophic coherence can only be defined on graphs with basal vertices, vertices with zero in-degree. Consequently, trophic analysis of graphs had been restricted until now. In this paper we introduce a novel framework, a generalisation of trophic levels, which we call hierarchical levels, that can be defined on any simple graph. Within this general framework, we develop additional metrics named influence centrality, a measure of a vertices ability to influence dynamics, and democracy coefficient, a measure of overall feedback in the system, both of which have implications for the controllability of complex systems. We discuss how our generalisation relates to previous attempts and what new insights are illuminated on the topological and dynamical aspects of graphs. Finally, we show how the hierarchical structure of a network relates to the incidence rate in a SIS epidemic model.
Figures

Figures from the paper (8 more)


Reference graph
Works this paper leans on
-
[1]
The structure and function of complex networks
Mark EJ Newman. “The structure and function of complex networks”. In: SIAM review 45.2 (2003), pp. 167–256
work page 2003
-
[2]
Collective dynamics of ‘small-world’ networks
Duncan J Watts and Steven H Strogatz. “Collective dynamics of ‘small-world’ networks”. In: nature 393.6684 (1998), p. 440. 2https://github.com/shuaib7860/GraphHierarchy 3https://github.com/gmoutsin/GraphHierarchy.jl 14
work page 1998
-
[3]
Dynamical processes on complex networks
Alain Barrat, Marc Barthelemy, and Alessandro Vespignani. Dynamical processes on complex networks . Cambridge university press, 2008
work page 2008
-
[4]
Danielle S Bassett and Olaf Sporns. “Network neuroscience”. In: Nature neuro- science 20.3 (2017), p. 353
work page 2017
-
[5]
Measuring the upstreamness of production and trade flows
Pol Antr` as et al. “Measuring the upstreamness of production and trade flows”. In: American Economic Review 102.3 (2012), pp. 412–16
work page 2012
-
[6]
Graph theoretical dimensions of informal organizations
David Krackhardt. “Graph theoretical dimensions of informal organizations”. In: Computational organization theory. Psychology Press, 2014, pp. 107–130
work page 2014
-
[7]
Fractal cities: a geometry of form and function
Michael Batty and Paul A Longley. Fractal cities: a geometry of form and function. Academic press, 1994
work page 1994
-
[8]
Large- scale topological and dynamical properties of the Internet
Alexei V´ azquez, Romualdo Pastor-Satorras, and Alessandro Vespignani. “Large- scale topological and dynamical properties of the Internet”. In: Physical Review E 65.6 (2002), p. 066130
work page 2002
Show all 61 references
-
[9]
Structure and dynamics of molecular networks: a novel paradigm of drug discovery: a comprehensive review
Peter Csermely et al. “Structure and dynamics of molecular networks: a novel paradigm of drug discovery: a comprehensive review”. In: Pharmacology & thera- peutics 138.3 (2013), pp. 333–408
2013
-
[10]
An approach for determining and measuring network hierarchy applied to comparing the phosphorylome and the regulome
Chao Cheng et al. “An approach for determining and measuring network hierarchy applied to comparing the phosphorylome and the regulome”. In: Genome biology 16.1 (2015), p. 63
2015
-
[11]
Hierarchical organization of modularity in metabolic net- works
Erzs´ ebet Ravasz et al. “Hierarchical organization of modularity in metabolic net- works”. In: science 297.5586 (2002), pp. 1551–1555
2002
-
[12]
Architecture of the human regulatory network derived from ENCODE data
Mark B Gerstein et al. “Architecture of the human regulatory network derived from ENCODE data”. In: Nature 489.7414 (2012), pp. 91–100
2012
-
[13]
Hierarchical organization in com- plex networks
Erzs´ ebet Ravasz and Albert-L´ aszl´ o Barab´ asi. “Hierarchical organization in com- plex networks”. In: Physical review E 67.2 (2003), p. 026112
2003
-
[14]
Googling the brain: Discovering hi- erarchical and asymmetric network structures, with applications in neuroscience
Jonathan J Crofts and Desmond J Higham. “Googling the brain: Discovering hi- erarchical and asymmetric network structures, with applications in neuroscience”. In: Internet Mathematics 7.4 (2011), pp. 233–254
2011
-
[15]
On the origins of hierarchy in complex networks
Bernat Corominas-Murtra et al. “On the origins of hierarchy in complex networks”. In: Proceedings of the National Academy of Sciences 110.33 (2013), pp. 13316– 13321
2013
-
[16]
Hierarchy measure for complex networks
Enys Mones, Lilla Vicsek, and Tam´ as Vicsek. “Hierarchy measure for complex networks”. In: PloS one 7.3 (2012)
2012
-
[17]
Hierarchy measures in complex networks
Ala Trusina et al. “Hierarchy measures in complex networks”. In: Physical review letters 92.17 (2004), p. 178702
2004
-
[18]
Using arborescences to estimate hierarchicalness in directed com- plex networks
Michele Coscia. “Using arborescences to estimate hierarchicalness in directed com- plex networks”. In: PloS one 13.1 (2018), e0190825. 15
2018
-
[19]
Network structure and robustness of marine food webs
Jennifer A Dunne, Richard J Williams, and Neo D Martinez. “Network structure and robustness of marine food webs”. In: Marine Ecology Progress Series 273 (2004), pp. 291–302
2004
-
[20]
Ecological networks–beyond food webs
Thomas C Ings et al. “Ecological networks–beyond food webs”. In: Journal of Animal Ecology 78.1 (2009), pp. 253–269
2009
-
[21]
Several measures of trophic structure applicable to complex food webs
Stephen Levine. “Several measures of trophic structure applicable to complex food webs”. In: Journal of Theoretical Biology 83.2 (1980), pp. 195–207
1980
-
[22]
Trophic coherence determines food-web stability
Samuel Johnson et al. “Trophic coherence determines food-web stability”. In: Pro- ceedings of the National Academy of Sciences 111.50 (2014), pp. 17923–17928
2014
-
[23]
Looplessness in networks is linked to trophic coherence
Samuel Johnson and Nick S Jones. “Looplessness in networks is linked to trophic coherence”. In: Proceedings of the National Academy of Sciences 114.22 (2017), pp. 5618–5623
2017
-
[24]
From neurons to epidemics: How trophic co- herence affects spreading processes
Janis Klaise and Samuel Johnson. “From neurons to epidemics: How trophic co- herence affects spreading processes”. In: Chaos: An Interdisciplinary Journal of Nonlinear Science 26.6 (2016), p. 065310
2016
-
[25]
Resilience or robustness: identifying topological vulnerabil- ities in rail networks
Alessio Pagani et al. “Resilience or robustness: identifying topological vulnerabil- ities in rail networks”. In: Royal Society open science 6.2 (2019), p. 181301
2019
-
[26]
Controllability of complex networks
Yang-Yu Liu, Jean-Jacques Slotine, and Albert-L´ aszl´ o Barab´ asi. “Controllability of complex networks”. In: nature 473.7346 (2011), pp. 167–173
2011
-
[27]
The central role of peripheral nodes in directed network dynamics
Edgar AP Wright et al. “The central role of peripheral nodes in directed network dynamics”. In: Scientific reports 9.1 (2019), pp. 1–11
2019
-
[28]
On best approximate solutions of linear matrix equations
Roger Penrose. “On best approximate solutions of linear matrix equations”. In: Mathematical Proceedings of the Cambridge Philosophical Society. Vol. 52. 1. Cam- bridge University Press. 1956, pp. 17–19
1956
-
[29]
Interior-point polynomial algorithms in convex programming
Yurii Nesterov and Arkadii Nemirovskii. Interior-point polynomial algorithms in convex programming. SIAM, 1994
1994
-
[30]
Core-periphery structure in networks
M Puck Rombach et al. “Core-periphery structure in networks”. In: SIAM Journal on Applied mathematics 74.1 (2014), pp. 167–190
2014
-
[31]
Control profiles of complex networks
Justin Ruths and Derek Ruths. “Control profiles of complex networks”. In: Science 343.6177 (2014), pp. 1373–1376
2014
-
[32]
How directed is a directed network?
RS MacKay, S Johnson, and B Sansom. “How directed is a directed network?” In: arXiv preprint arXiv:2001.05173 (2020)
2020 arXiv
-
[33]
Community structure based on circular flow in a large- scale transaction network
Yuichi Kichikawa et al. “Community structure based on circular flow in a large- scale transaction network”. In: Applied Network Science 4.1 (2019), p. 92
2019
-
[34]
Detecting evolving patterns of self-organizing networks by flow hierarchy measurement
Jianxi Luo and Christopher L Magee. “Detecting evolving patterns of self-organizing networks by flow hierarchy measurement”. In: Complexity 16.6 (2011), pp. 53–61
2011
-
[35]
Digraph laplacian and the degree of asymmetry
Yanhua Li and Zhi-Li Zhang. “Digraph laplacian and the degree of asymmetry”. In: Internet Mathematics 8.4 (2012), pp. 381–401. 16
2012
-
[36]
Random walk hierarchy measure: What is more hierarchical, a chain, a tree or a star?
D´ aniel Cz´ egel and Gergely Palla. “Random walk hierarchy measure: What is more hierarchical, a chain, a tree or a star?” In: Scientific reports 5 (2015), p. 17994
2015
-
[37]
Pseudoinverse of the Lapla- cian and best spreader node in a network
Piet Van Mieghem, Karel Devriendt, and H Cetinay. “Pseudoinverse of the Lapla- cian and best spreader node in a network”. In: Physical Review E 96.3 (2017), p. 032311
2017
-
[38]
Geometry of complex networks and topological centrality
Gyan Ranjan and Zhi-Li Zhang. “Geometry of complex networks and topological centrality”. In: Physica A: Statistical Mechanics and its Applications 392.17 (2013), pp. 3833–3845
2013
-
[39]
Structure and dynami- cal behavior of non-normal networks
Malbor Asllani, Renaud Lambiotte, and Timoteo Carletti. “Structure and dynami- cal behavior of non-normal networks”. In: Science advances 4.12 (2018), eaau9403
2018
-
[40]
Digraphs are different: Why directionality matters in complex systems
Samuel Johnson. “Digraphs are different: Why directionality matters in complex systems”. In: Journal of Physics: Complexity 1.1 (2020), p. 015003
2020
-
[41]
Epidemic processes in complex networks
Romualdo Pastor-Satorras et al. “Epidemic processes in complex networks”. In: Reviews of modern physics 87.3 (2015), p. 925
2015
-
[42]
May’s instability in large economies
Jos´ e Moran and Jean-Philippe Bouchaud. “May’s instability in large economies”. In: Physical Review E 100.3 (2019), p. 032307
2019
-
[43]
Quantifying Resilience via Multiscale Feedback Loops in Water Distribution Networks
Alessio Pagani et al. “Quantifying Resilience via Multiscale Feedback Loops in Water Distribution Networks”. In:Journal of Water Resources Planning and Man- agement 146.6 (2020), p. 04020039
2020
-
[44]
The trophic-dynamic aspect of ecology
Raymond L Lindeman. “The trophic-dynamic aspect of ecology”. In: Ecology 23.4 (1942), pp. 399–417
1942
-
[45]
Kernels of directed graph Laplacians
John S Caughman and JJP Veerman. “Kernels of directed graph Laplacians”. In: the electronic journal of combinatorics 13.1 (2006), p. 39
2006
-
[46]
Chip-firing games on directed graphs
Anders Bj¨ orner and L´ aszl´ o Lov´ asz. “Chip-firing games on directed graphs”. In: Journal of algebraic combinatorics 1.4 (1992), pp. 305–328
1992
-
[47]
Matrix Computations, Johns Hopkins U
Gene H Golub and Charles F Van Loan. “Matrix Computations, Johns Hopkins U”. In: Math. Sci., Johns Hopkins University Press, Baltimore, MD (1996). 17 Appendices A. Trophic Levels and Trophic Differences The concept of trophic levels was introduced in [44] as a way to determine ...
1996
-
[48]
ker(Li) is spanned by a positive vector κi
-
[49]
ker(L) is spanned by the non-negative vectors ki = (0,..., 0,κi, 0,..., 0), where i∈{i,...,l } and the position of κi in ki corresponds to the position of Li in L
-
[50]
kid = 0 if Γi is just a single vertex and kid> 0 otherwise. Proof. 23
-
[51]
Since Γi is a minimal source subgraph, by Lemma B.4 it is strongly connected and by Lemma B.7, ker(Li) is spanned by a positive vector κi
-
[52]
By renaming the vertices, the Laplacian L can be brought to the form L = L1 0
Since there are l minimal source subgraphs, the dimension of ker( L) is l, see [45]. By renaming the vertices, the Laplacian L can be brought to the form L = L1 0 ... 0 C1 0 L2 ... 0 C2 ... ... ... ... ... 0 0 ... L l Cl 0 0 ... 0 Cl+1 . It is straightforward...
-
[53]
temperature
Without loss of generality we we will consider Γ 1. If Γ 1 is a single vertex thenL1 is just the 1×1 zero matrix. This means thatk1 = (1, 0,..., 0) andd = (0,d 2,...,d n), thus k1d = 0. If Γ 1 is a strongly connected graph with m vertices, then κ1 is a positive m-vector and th...
-
[58]
temperature
From all possible edges i → j such that j is not an source vertex, we choose L−N +B with probability proportional to P(aij = 1)∝ exp ( −(sj−si− 1)2 2T 2 ) . All PPM graphs are simply influenced graphs, so the democracy coefficient is 0. In Figure 6 we see that the trophic incoher...
-
[59]
We introduce B source vertices and no edges
-
[60]
We choose uniformly at random one of the existing vertices i and we add a new vertexj and the edge i→j
-
[61]
We repeat step 2 until we have N vertices in total
-
[62]
We assign each vertex i its trophic level si according to the graph we have up to this point
-
[63]
From all possible edges i → j such that j is not an source vertex, we choose L−N +B with probability proportional to P(aij = 1)∝ exp ( −(sj−si− 1)2 2T 2 )
-
[64]
28 (a) (b) Figure 7.: The scatter plots of hierarchical incoherence over democracy coefficient for NSPPM graphs
We pick an source vertex i with in-degree 0, we pick another vertex j with proba- bility proportional to exp(−sj) and we add the edge j→i. 28 (a) (b) Figure 7.: The scatter plots of hierarchical incoherence over democracy coefficient for NSPPM graphs. Two different regions are vi...
-
[65]
We find that NSPPM graphs can be separated into two types
We repeat step 6 until all source vertices have in-degree 1. We find that NSPPM graphs can be separated into two types. The ones with very small democracy coefficient (smaller than 20 /2500) and the one with a democracy coefficient bigger than 20/2500. We can see in Figures 7 and 8...
Reviewed August 14, 2026 · model on record in the stance chip above.
Discussion (0). Continue with ORCID to comment.