REVIEW 3 major objections 5 minor 1 cited by
A sensitivity analysis of the modeling of Polycyclic Aromatic Hydrocarbon emission in galaxies
T0 review · 3 major / 5 minor · reviewed 2026-08-12 · deepseek-v4-flash
Pith's one-line read The paper claims that PAH fitting choices alter derived galaxy PAH properties by 15-20%, and that the optimal configuration—pure PAHs from the v4.00-alpha library without a redshift—yields the most accurate average values, f_i = 0.54 and…
desk verdict A careful sensitivity analysis of PAHdb modeling choices; the descriptive results and template library are solid, but the headline absolute PAH properties inherit the prior used to pick the 'optimal' configuration. read the letter →
The pith
A machine-rendered reading of the paper's core claim, the machinery that carries it, and where it could break.
The reading
What carries the argument
The machinery is library fitting: quantum-chemically computed PAH absorption spectra are converted into emission by a cascade emission model (or a simplified calculated-temperature model), convolved with Gaussian or Lorentzian profiles at a chosen FWHM, optionally shifted by a 15 cm$^{-1}$ redshift, and fit to the PAH emission spectrum isolated by the PAHFIT decomposition. The load-bearing change is the v4.00-$\alpha$ library content, especially the newly added large, irregularly edged PAHs, which for the first time lets the fit reproduce the blue side of the 6.2 µm band and the 10-15 µm region, shifting the recovered charge and size balance. Sensitivity is quantified by Monte Carlo perturbing each spectrum 1000 times and comparing derived parameters between runs using average ratios, linear regression slopes, and Pearson correlations, together with the fitting uncertainty $\sigma_{\rm PAHdb}$.
What would settle it
Record laboratory gas-phase emission spectra of PAHs with known size and charge state across 6-15 µm and run them through the same PAHFIT-to-library-fitting pipeline; if the recovered $f_i$ and $N_C$ differ systematically from the known values, or if the lab spectra display the 15 cm$^{-1}$ anharmonic shifts that the optimal configuration omits, the claimed optimal configuration and the values $f_i = 0.54$ and $N_C = 68$ are falsified.
Extended reading notes
Core claim
This paper establishes that the average PAH population properties reported for galaxies are not uniquely determined by the data; they shift by 15-20% under plausible modeling choices, with the largest changes caused by the choice of applying a 15 cm$^{-1}$ redshift and by the content of the spectral library. With the v4.00-$\alpha$ library, which adds large irregularly edged PAHs and nitrogen-substituted PAHs, the full 6-15 µm PAH spectrum can be modeled, including the complete 6.2 µm band that earlier library versions under-fitted; this alone halves the average fitting uncertainty. The authors select pure PAHs without a redshift as the optimal configuration, based on consistency with established band-charge assignments and with galactic nitrogen abundances, and report average values of $f_i = 0.54$ and $N_C = 68$. They also show that although each configuration changes the derived numbers, the changes follow a linear scaling, so previously reported PAH trends remain qualitatively valid.
Load-bearing premise
The load-bearing premise is that the computed spectra in the v4.00-alpha library, converted to emission with the cascade model using Gaussian profiles and no redshift, faithfully represent true astronomical PAH emission across 6-15 µm; the paper checks this with fit residuals and band-charge consistency rather than against independent laboratory emission spectra or known ground truth.
Editorial extensions
If this is right
- Previously published PAH parameter trends, such as ionization and size differences between environments, remain qualitatively valid despite the shift in absolute values.
- The delivered template library, parameterized by $f_i$ and $N_C$, can be plugged into galaxy SED models as a calibrated PAH emission component.
- PAHdb fitting of JWST MIRI-MRS and Spitzer-IRS spectra gives consistent derived parameters, so results transfer across spectral resolutions.
- The average galaxy PAH population is now characterized as substantially ionized ($f_i = 0.54$) and larger ($N_C = 68$) than the earlier values of $f_i = 0.36$ and $N_C = 55$.
- The ~7% difference in neutral PAH fraction caused by using PAHFIT versus CAFE decomposition indicates that code choice contributes a systematic uncertainty to PAH property measurements.
Reading between the lines
- Because the absolute values depend on library completeness, future additions to the spectral library may shift $f_i$ and $N_C$ again; the linear-scaling result suggests that relative galaxy-to-galaxy comparisons are the more stable scientific output.
- The no-redshift conclusion is argued for the 6-15 µm region; applying it to the 3.3 µm band, where anharmonic effects are stronger, is an untested extrapolation beyond this paper.
- A natural testable extension is to run the optimal configuration on a larger JWST sample decomposed with both PAHFIT and CAFE, quantifying how the code-induced ~7% neutral-fraction variation depends on galaxy type and radiation field.
Editorial analysis
A structured set of objections, weighed in public.
Referee Report
Summary. This manuscript conducts a sensitivity analysis of PAHdb-based modeling of mid-infrared PAH emission in galaxies. Using a representative subset of 147 Spitzer-IRS galaxies from Paper I, it takes a base-run configuration (PAHdb v3.20, cascade emission model, 8 eV excitation, Gaussian profiles with FWHM 15 cm^-1, and a 15 cm^-1 redshift) and varies one element at a time: FWHM (10 cm^-1), line profile (Lorentzian), emission model (calculated temperature), redshift (omission), library version (v4.00-alpha), spectral resolution (JWST MIRI-MRS versus Spitzer-IRS, including smoothed/resampled JWST data), and decomposition code (PAHFIT versus CAFE). It reports that omitting the redshift improves fits by about 13%, that the v4.00-alpha library eliminates the long-standing under-fitting of the 6.2 um band and reduces average fitting uncertainty by roughly a factor of two, that the optimal configuration is pure PAHs with no redshift, and that this configuration gives average galaxy PAH properties of fi = 0.54 and NC = 68. It also finds that parameter variations across configurations follow linear scaling, so previously published PAH trends remain qualitatively valid, and it delivers a new library of galaxy PAH emission templates parameterized by excitation energy, NC, and fi.
Significance. The paper's main strength is its systematic mapping of configuration-induced variance. The 147-galaxy representative sample, 1000 Monte Carlo perturbations per spectrum, regression/scatter metrics for every configuration, and the public template library are concrete and reproducible deliverables. The demonstration that v4.00-alpha removes the 6.2 um fitting deficit and that redshift omission improves fits by ~13% is robust and directly useful. The linear-scaling result is important because it preserves the qualitative validity of earlier PAH trends based on v3.20 modeling. The weaker part is the absolute calibration: the optimal Case 4 configuration is selected using astrophysical priors, not by a statistically significant improvement in fit, and the headline values fi = 0.54 and NC = 68 inherit that choice. The paper is therefore best read as a sensitivity map plus a model-dependent update, rather than as a definitive new measurement of the average PAH population properties in galaxies.
major comments (3)
- [§4.3.1, Fig. 11, Table 4] The selection of Case 4 (pure PAHs, no redshift) as the 'optimal' configuration is not established by the fit statistics. The text states in Section 4.3.1 that 'the vast majority of galaxies are very well fitted under all four configurations with sigma_PAHdb < 0.1,' and Figure 11 shows substantial shifts in the mean of every derived parameter across Cases 1-4, with conclusion (vi) itself labeling this a fitting degeneracy. Case 4 is adopted because its per-band charge breakdown 'better represents that established in earlier work' and because the high PANH fractions in Cases 1-2 conflict with galactic nitrogen abundances; these are astrophysical priors, not data-driven discriminants. Consequently, the uncertainties quoted in Table 4 (e.g., fi = 0.54 +/- 0.10, NC = 68 +/- 4.6) are Monte Carlo fitting uncertainties within one configuration and do not include the spread across the near-equally good configurations shown in Figure 11. I request either a statistical model-comparison criterion that identifies Case 4 from the data, or a systematic error term derived from the configuration spread, together with a softening of the 'most accurate and robust determination' claim in Section 4.4 and the abstract.
- [§3.2.4, §4.4] The absolute values fi = 0.54 and NC = 68 depend on the unvalidated assumption that the PAHdb v4.00-alpha DFT spectra, processed with the cascade emission model, Gaussian profiles, and no redshift, faithfully represent the astronomical PAH emission spectrum over 6-15 um, including the 6.2 um band and the 10-15 um region populated by the newly added large irregular PAHs. The paper validates this mainly through reduced fit residuals and consistency with prior band-charge assignments, but it does not provide independent laboratory emission spectra, an observational ground-truth sample, or a test showing that the four configurations are distinguishable on the data (indeed Section 4.3.1 states the opposite). If the library is incomplete or systematically biased at these wavelengths, both the optimal configuration and the derived averages would shift. Please either add such an external validation or explicitly state in the abstract and Section 4.4 that fi = 0.54 and NC = 68 are conditional on the v4.00-alpha library and the adopted priors.
- [§4.4, Table 3] The comparison between the v3.20 base run and v4.00-alpha† in Table 4 changes three modeling choices simultaneously (library version, redshift, and PANH content), so the improvement in sigma_PAHdb from 0.28 to 0.16 and the parameter shifts cannot be attributed to the library content alone. Table 3 shows that v4.00-alpha with the base-run configuration already reduces sigma_PAHdb to about 0.56 of the v3.20 value, and the additional role of the redshift/PANH choices within v4.00-alpha is comparatively small. Please separate the library effect from the configuration effect when interpreting the origin of the improvement, for example by presenting all four v4.00-alpha configurations against the v3.20 base run in the same table.
minor comments (5)
- [Section 6, item (v)] There is a typo in conclusion (v): 'the the 6.2 µm PAH band' should read 'the 6.2 µm PAH band.'
- [Tables 5 and 6] The PAHdb uncertainties quoted for the JWST fits (e.g., +/- 0.0001) are Monte Carlo fitting uncertainties and are orders of magnitude smaller than the ~5-10% systematic differences between JWST, JSR, and IRS data and between PAHFIT and CAFE; please label them as fitting-only uncertainties to avoid overinterpreting their precision.
- [§4.3.1, Fig. 12] Figure 12 presents the per-band charge and composition breakdowns for a single galaxy (IRAS 05129+5128) as the basis for the sample-wide statements about Cases 1-4; please add sample-averaged breakdowns or an explicit statement of how representative this example is.
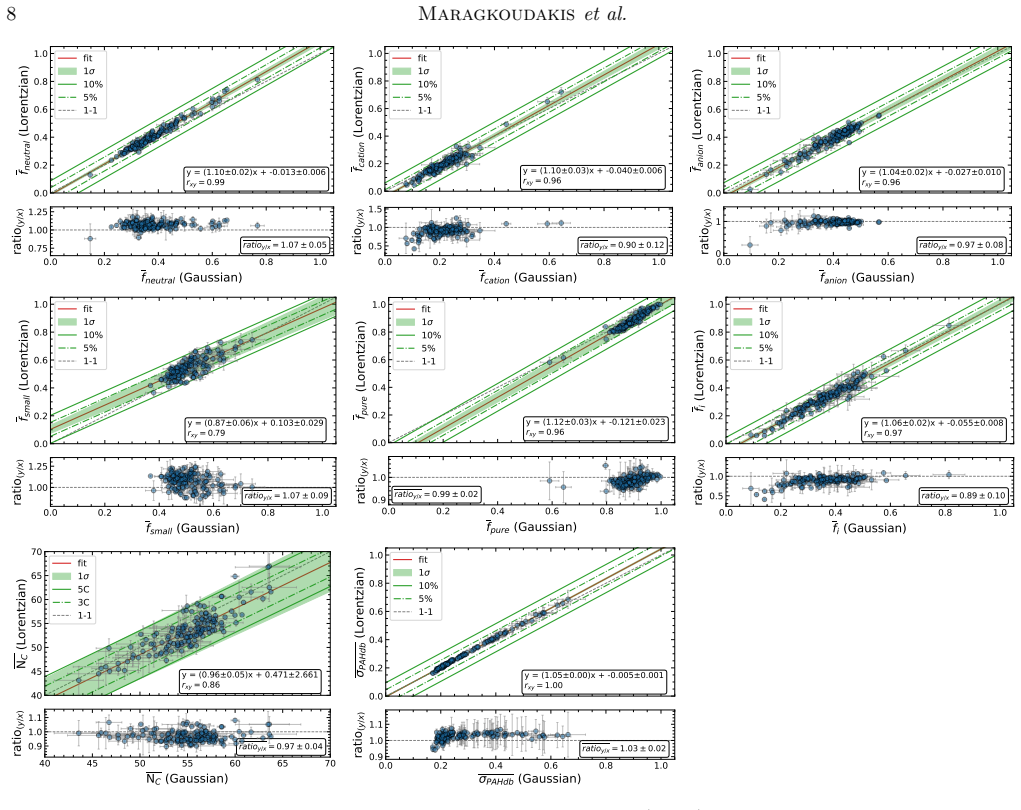
- [§4.2, Fig. 6] In the Lorentzian comparison, the fpure regression has slope 1.12 and intercept -0.121, so the offset is non-negligible at low fpure values; the text states that the composition is consistent between the two runs and would benefit from a comment on this systematic offset.
- [§3.2.4, Table 2] Case 3 is described in Table 2 as 'pure PAHs + v3.20 PANHs,' while the text defines it as 'keeping only the v3.20 PANHs by excluding the ~2000 newly added ones'; please make the table entry self-explanatory.
Circularity Check
No significant circularity: the sensitivity analysis compares independent fits against a fixed base run, and the Case 4 selection is prior-driven model choice rather than a self-referential derivation.
full rationale
This paper is a controlled sensitivity study rather than a derivation that presupposes its conclusions. Each modeling choice (FWHM, line profile, emission model, redshift, library version, spectral resolution, decomposition code) is evaluated empirically against a fixed v3.20 base run using Monte Carlo perturbed fits, and the reported scale factors in Table 3 are measured ratios between independent fits. The redshift comparison is an empirical goodness-of-fit result: omitting the 15 cm^-1 redshift reduces the average fitting uncertainty by about 13%, as shown in Figure 8 and Section 4.2. The selection of Case 4 as 'optimal' in Section 4.3.1 is based on two things: the measured fit improvement from omitting redshift, and consistency with external spectroscopic priors on PAH band-charge assignments (11.2 um neutral, 6-9 um cationic) and with galactic nitrogen abundances. These priors are qualitative constraints used to break fitting degeneracies; they are not the target quantities fi=0.54 and NC=68. Those target quantities are outputs of the selected fits, not inputs encoded by construction. The PAHdb v4.00-alpha spectra are DFT-computed in prior work by coauthors, but they are not fitted to the galaxy sample, and the reported improvement in matching the 6.2 um band is a direct residual comparison against the observed spectra. No equation is shown to equal its own input, and no fitted parameter is relabeled as an independent prediction. The legitimate concern raised by the paper itself—that all four configurations fit most galaxies well and expose fitting degeneracies—is a model-selection and systematic-error caveat, not circularity. Therefore the circularity score is 0.
Assumptions & free parameters
free parameters (6)
- PAH band FWHM =
15 cm^-1 (base), 10 cm^-1 (variant)
- Anharmonic redshift =
15 cm^-1 (base), 0 cm^-1 (variant)
- Excitation photon energy =
8 eV
- Emission model =
cascade (base), calculated temperature (variant)
- Line profile shape =
Gaussian (base), Lorentzian (variant)
- PAH library composition =
v3.20 vs v4.00-alpha, with/without PANHs
assumptions (5)
- domain assumption Aromatic infrared bands in galaxies are produced by fluorescent emission from PAHs and related species.
- domain assumption DFT-computed PAH absorption spectra in PAHdb, converted to emission with the cascade model, faithfully represent astronomical PAH emission.
- domain assumption PAH band shapes are described by Gaussian or Lorentzian profiles with FWHM 10-15 cm^-1.
- domain assumption The 11.2 um band is predominantly neutral PAH and the 6-9 um bands predominantly cationic PAH.
- domain assumption Nitrogen abundances in galaxies are low, so PANHs should contribute little to galaxy PAH emission.
Cite this review
Pith. "Pith review of A sensitivity analysis of the modeling of Polycyclic Aromatic Hydrocarbon emission in galaxies." pith.science (2026). https://pith.science/paper/ETCO4SQI
@misc{pith2026241201875,
  author       = {Pith},
  title        = {Pith review of: A sensitivity analysis of the modeling of Polycyclic Aromatic Hydrocarbon emission in galaxies},
  year         = {2026},
  howpublished = {\url{https://pith.science/paper/ETCO4SQI}},
  note         = {Machine review of arXiv:2412.01875}
}
abstract
We have conducted a sensitivity analysis on the mid-infrared spectral decomposition of galaxies and the modeling of the PAH emission spectrum with the NASA Ames PAH Infrared Spectroscopic Database (PAHdb) to assess the variance on the average galaxy PAH population properties under a grid of different modeling parameters. We find that the SL and SL+LL Spitzer-IRS decomposition with PAHFIT provides consistent modeling and recovery of the 5-15 $\mu$m PAH emission spectrum. For PAHdb modeling, application of a redshift to the calculated spectra to account for anharmonic effects introduces a $15\%$-$20\%$ variance on the derived parameters, while its absence improves the fits by $\sim13\%$. The 4.00-$\alpha$ release of PAHdb achieves the complete modeling of the 6-15 $\mu$m PAH spectrum, including the full 6.2 $\mu$m band, improving the average fitting uncertainty by a factor of 2. The optimal PAHdb modeling configuration requires selection of pure PAHs without applying a redshift to the bands. Although quantitatively the PAHdb-derived parameters change under different modeling configurations or database versions, their variation follows a linear scaling, with previously reported trends remaining qualitatively valid. PAHdb modeling of JWST observations, and JWST observations smoothed and resampled to the Spitzer-IRS resolution and dispersion have consistent PAHdb derived parameters. Decomposition with different codes, such as PAHFIT and CAFE, produce PAH emission spectra with noticeable variation in the 11-15~$\mu$m region, driving a $\sim7\%$ difference in the neutral PAH fraction under PAHdb modeling. A new library of galaxy PAH emission templates is delivered to be utilized in galaxy SED modeling.
Figures


Figures from the paper (14 more)




Forward citations
Cited by 1 Pith paper
-
Infrared spectroscopy of gas-phase hydrogenated and methylated pyrenes: from laboratory spectra to the simulated 3.4 $\mu$m emission band
Gas-phase infrared spectra of hydrogenated and methylated pyrenes, combined with a Monte Carlo cooling model, point to 1,2,3,6,7,8-hexahydropyrene as the carrier of the 3.403 μm component of the interstellar 3.4 μm em...
Reference graph
Works this paper leans on
-
[1]
2023, A&A, 677, L13, doi: 10.1051/0004-6361/202347524
Ag´ undez, M., Marcelino, N., Tercero, B., & Cernicharo, J. 2023, A&A, 677, L13, doi: 10.1051/0004-6361/202347524
- [2]
-
[3]
Allamandola, L. J., Hudgins, D. M., & Sandford, S. A. 1999, ApJ, 511, L115, doi: 10.1086/311843
doi:10.1086/311843 1999
-
[4]
Allamandola, L. J., Tielens, A. G. G. M., & Barker, J. R. 1985, ApJL, 290, L25, doi: 10.1086/184435
doi:10.1086/184435 1985
-
[5]
Bakes, E. L. O., & Tielens, A. G. G. M. 1994, ApJ, 427, 822, doi: 10.1086/174188
doi:10.1086/174188 1994
-
[6]
Bakes, E. L. O., Tielens, A. G. G. M., & Bauschlicher, Charles W., J. 2001, ApJ, 556, 501, doi: 10.1086/321501
doi:10.1086/321501 2001
-
[7]
W., Boersma, C., Ricca, A., et al
Bauschlicher, Jr., C. W., Boersma, C., Ricca, A., et al. 2010, ApJS, 189, 341, doi: 10.1088/0067-0049/189/2/341
-
[8]
Allamandola, L. J. 2018, ApJS, 234, 32, doi: 10.3847/1538-4365/aaa019
Show all 69 references
-
[9]
Boersma, C., Bregman, J., & Allamandola, L. J. 2014a, ApJ, 795, 110, doi: 10.1088/0004-637X/795/2/110 —. 2015, ApJ, 806, 121, doi: 10.1088/0004-637X/806/1/121 —. 2018, ApJ, 858, 67, doi: 10.3847/1538-4357/aabcbe
2015 doi
-
[10]
D., & Allamandola, L
Boersma, C., Bregman, J. D., & Allamandola, L. J. 2013, ApJ, 769, 117, doi: 10.1088/0004-637X/769/2/117
2013 doi
-
[11]
D., Allamandola, L
Boersma, C., Bregman, J. D., Allamandola, L. J., Temi, P., & Maragkoudakis, A. 2024, ApJ, 975, 177, doi: 10.3847/1538-4357/ad7d08 24 Maragkoudakis et al
2024 doi
-
[12]
W., Ricca, A., et al
Boersma, C., Bauschlicher, Jr., C. W., Ricca, A., et al. 2014b, ApJS, 211, 8, doi: 10.1088/0067-0049/211/1/8
-
[13]
D., Levy, R
Bolatto, A. D., Levy, R. C., Tarantino, E., et al. 2024, ApJ, 967, 63, doi: 10.3847/1538-4357/ad33c8
2024 doi
-
[14]
Brinchmann, J., Charlot, S., White, S. D. M., et al. 2004, MNRAS, 351, 1151, doi: 10.1111/j.1365-2966.2004.07881.x
2004
-
[15]
Cami, J., Bernard-Salas, J., Peeters, E., & Malek, S. E. 2010, Science, 329, 1180, doi: 10.1126/science.1192035
2010 doi
-
[16]
2023, ApJL, 944, L12, doi: 10.3847/2041-8213/acac94
Chastenet, J., Sutter, J., Sandstrom, K., et al. 2023, ApJL, 944, L12, doi: 10.3847/2041-8213/acac94
2023 doi
-
[17]
2003, MNRAS, 339, 63, doi: 10.1046/j.1365-8711.2003.06154.x
Chiappini, C., Romano, D., & Matteucci, F. 2003, MNRAS, 339, 63, doi: 10.1046/j.1365-8711.2003.06154.x
2003
-
[18]
2024, A&A, 685, A75, doi: 10.1051/0004-6361/202346662
Chown, R., Sidhu, A., Peeters, E., et al. 2024, A&A, 685, A75, doi: 10.1051/0004-6361/202346662
2024 doi
- [19]
-
[20]
A., Candian, A., Bern´ e, O., & Tielens, A
Croiset, B. A., Candian, A., Bern´ e, O., & Tielens, A. G. G. M. 2016, A&A, 590, A26, doi: 10.1051/0004-6361/201527714
2016 doi
-
[21]
2007, ApJ, 670, 156, doi: 10.1086/521818
Daddi, E., Dickinson, M., Morrison, G., et al. 2007, ApJ, 670, 156, doi: 10.1086/521818
2007 doi
-
[22]
R., Garc ´ ıa-Bernete, I., Rigopoulou, D., et al
Donnan, F. R., Garc ´ ıa-Bernete, I., Rigopoulou, D., et al. 2024, MNRAS, 529, 1386, doi: 10.1093/mnras/stae612
2024 doi
-
[23]
T., Li, A., Hensley, B
Draine, B. T., Li, A., Hensley, B. S., et al. 2021, ApJ, 917, 3, doi: 10.3847/1538-4357/abff51
2021 doi
-
[24]
V., Kreckel, K., Sandstrom, K
Egorov, O. V., Kreckel, K., Sandstrom, K. M., et al. 2023, ApJL, 944, L16, doi: 10.3847/2041-8213/acac92
2023 doi
-
[25]
2007, A&A, 468, 33, doi: 10.1051/0004-6361:20077525
Elbaz, D., Daddi, E., Le Borgne, D., et al. 2007, A&A, 468, 33, doi: 10.1051/0004-6361:20077525
2007 doi
-
[27]
J., Ferrari, P., Buma, W
Esposito, V. J., Ferrari, P., Buma, W. J., et al. 2024b, Molecular Physics, 122, e2261570, doi: 10.1080/00268976.2023.2261570 —. 2024c, The Journal of Chemical Physics, 160, 114312, doi: 10.1063/5.0191404
2023
-
[28]
C., Tielens, A
Galliano, F., Madden, S. C., Tielens, A. G. G. M., Peeters, E., & Jones, A. P. 2008, ApJ, 679, 310, doi: 10.1086/587051 Garc ´ ıa-Bernete, I., Rigopoulou, D., Alonso-Herrero, A., et al. 2022, A&A, 666, L5, doi: 10.1051/0004-6361/202244806
2008 doi
-
[29]
2001, A&A, 370, 1030, doi: 10.1051/0004-6361:20010242
Hony, S., Van Kerckhoven, C., Peeters, E., et al. 2001, A&A, 370, 1030, doi: 10.1051/0004-6361:20010242
2001 doi
-
[30]
M., & Allamandola, L
Hudgins, D. M., & Allamandola, L. J. 1999, ApJ, 513, L69, doi: 10.1086/311901
1999 doi
-
[31]
Allamandola, L. J. 2005, ApJ, 632, 316, doi: 10.1086/432495
2005 doi
-
[32]
J., & Tielens, A
Kemper, F., Vriend, W. J., & Tielens, A. G. G. M. 2004, ApJ, 609, 826, doi: 10.1086/421339
2004 doi
-
[33]
Tielens, A. G. G. M. 2021, ApJ, 918, 8, doi: 10.3847/1538-4357/ac02c6
2021 doi
-
[34]
Lai, T. S. Y., Armus, L., U, V., et al. 2022, ApJL, 941, L36, doi: 10.3847/2041-8213/ac9ebf Le Page, V., Snow, T. P., & Bierbaum, V. M. 2003, ApJ, 584, 316, doi: 10.1086/345595
2022 doi
-
[35]
Leger, A., & Puget, J. L. 1984, A&A, 137, L5
1984
-
[36]
J., Chen, T., Candian, A., Lee, T
Mackie, C. J., Chen, T., Candian, A., Lee, T. J., & Tielens, A. G. G. M. 2018, The Journal of Chemical Physics, 149, 134302, doi: 10.1063/1.5038725
2018 doi
-
[37]
J., Candian, A., Huang, X., et al
Mackie, C. J., Candian, A., Huang, X., et al. 2015, The Journal of Chemical Physics, 143, 224314, doi: 10.1063/1.4936779
2015 doi
-
[38]
J., Candian, A., Huang, X., et al
Mackie, C. J., Candian, A., Huang, X., et al. 2016, Journal of Chemical Physics, 145, 084313, doi: 10.1063/1.4961438
2016 doi
-
[39]
2015, The Astrophysical Journal, 814, 23, doi: 10.1088/0004-637X/814/1/23
Maltseva, E., Petrignani, A., Candian, A., et al. 2015, The Astrophysical Journal, 814, 23, doi: 10.1088/0004-637X/814/1/23
2015 doi
-
[40]
J., Candian, A., et al
Maltseva, E., Mackie, C. J., Candian, A., et al. 2018, Astronomy & Astrophysics, 610, A65, doi: 10.1051/0004-6361/201732102
2018 doi
-
[41]
D., & Allamandola, L
Maragkoudakis, A., Boersma, C., Temi, P., Bregman, J. D., & Allamandola, L. J. 2022, ApJ, 931, 38, doi: 10.3847/1538-4357/ac666f
2022 doi
-
[42]
2018, MNRAS, 481, 5370, doi: 10.1093/mnras/sty2658
Maragkoudakis, A., Ivkovich, N., Peeters, E., et al. 2018, MNRAS, 481, 5370, doi: 10.1093/mnras/sty2658
2018 doi
-
[43]
2020, MNRAS, 494, 642, doi: 10.1093/mnras/staa681 —
Maragkoudakis, A., Peeters, E., & Ricca, A. 2020, MNRAS, 494, 642, doi: 10.1093/mnras/staa681 —. 2023a, MNRAS, 520, 5354, doi: 10.1093/mnras/stad465
2020 doi
-
[44]
2023b, MNRAS, 524, 3429, doi: 10.1093/mnras/stad2062
Maragkoudakis, A., Peeters, E., Ricca, A., & Boersma, C. 2023b, MNRAS, 524, 3429, doi: 10.1093/mnras/stad2062
-
[45]
Maragkoudakis, A., Zezas, A., Ashby, M. L. N., & Willner, S. P. 2017, MNRAS, 466, 1192, doi: 10.1093/mnras/stw3180
2017 doi
-
[46]
A., Herter, T
Marshall, J. A., Herter, T. L., Armus, L., et al. 2007, ApJ, 670, 129, doi: 10.1086/521588
2007 doi
-
[47]
L., Hudgins, D
Mattioda, A. L., Hudgins, D. M., Boersma, C., et al. 2020, ApJS, 251, 22, doi: 10.3847/1538-4365/abc2c8
2020 doi
-
[48]
A., Burkhardt, A
McGuire, B. A., Burkhardt, A. M., Kalenskii, S., et al. 2018, Science, 359, 202, doi: 10.1126/science.aao4890
2018 doi
-
[49]
A., Loomis, R
McGuire, B. A., Loomis, R. A., Burkhardt, A. M., et al. 2021, Science, 371, 1265, doi: 10.1126/science.abb7535
2021 doi
-
[50]
B., Krabbe, A
Oliveira, C. B., Krabbe, A. C., Dors, O. L., et al. 2024, MNRAS, 531, 199, doi: 10.1093/mnras/stae1172 pah modeling sensitivity analysis 25
2024 doi
-
[51]
Ossenkopf, V., Henning, T., & Mathis, J. S. 1992, A&A, 261, 567
1992
-
[52]
2002, A&A, 388, 639, doi: 10.1051/0004-6361:20020416
Pech, C., Joblin, C., & Boissel, P. 2002, A&A, 388, 639, doi: 10.1051/0004-6361:20020416
2002 doi
-
[53]
W., Allamandola, L
Peeters, E., Bauschlicher, Jr., C. W., Allamandola, L. J., et al. 2017, ApJ, 836, 198, doi: 10.3847/1538-4357/836/2/198
2017 doi
-
[54]
2002, A&A, 390, 1089, doi: 10.1051/0004-6361:20020773
Peeters, E., Hony, S., Van Kerckhoven, C., et al. 2002, A&A, 390, 1089, doi: 10.1051/0004-6361:20020773
2002 doi
-
[55]
Allamandola, L. J. 2004, ApJL, 617, L65, doi: 10.1086/427186 P´ erez-Montero, E., Contini, T., Lamareille, F., et al. 2013, A&A, 549, A25, doi: 10.1051/0004-6361/201220070
2004 doi
-
[56]
2019, MNRAS, 490, 5285, doi: 10.1093/mnras/stz2635
Popesso, P., Morselli, L., Concas, A., et al. 2019, MNRAS, 490, 5285, doi: 10.1093/mnras/stz2635
2019 doi
-
[57]
Tielens, A. G. G. M., & Allamandola, L. J. 2012, ApJ, 754, 75, doi: 10.1088/0004-637X/754/1/75
2012 doi
-
[58]
2018, ApJ, 854, 115, doi: 10.3847/1538-4357/aaa757
Peeters, E. 2018, ApJ, 854, 115, doi: 10.3847/1538-4357/aaa757
2018 doi
-
[59]
2021, ApJ, 923, 202, doi: 10.3847/1538-4357/ac28fc
Ricca, A., Boersma, C., & Peeters, E. 2021, ApJ, 923, 202, doi: 10.3847/1538-4357/ac28fc
2021 doi
-
[60]
2024, ApJ, 968, 128, doi: 10.3847/1538-4357/ad4151
Maragkoudakis, A. 2024, ApJ, 968, 128, doi: 10.3847/1538-4357/ad4151
2024 doi
-
[61]
E., Peeters, E., & Boersma, C
Ricca, A., Roser, J. E., Peeters, E., & Boersma, C. 2019, ApJ, 882, 56, doi: 10.3847/1538-4357/ab3124
2019 doi
- [62]
-
[63]
M., Bolatto, A
Sandstrom, K. M., Bolatto, A. D., Bot, C., et al. 2012, ApJ, 744, 20, doi: 10.1088/0004-637X/744/1/20
2012 doi
-
[64]
A., Tielens, A
Schutte, W. A., Tielens, A. G. G. M., & Allamandola, L. J. 1993, ApJ, 415, 397, doi: 10.1086/173173
1993 doi
-
[65]
J., & Boersma, C
Shannon, M. J., & Boersma, C. 2019, ApJ, 871, 124, doi: 10.3847/1538-4357/aaf562
2019 doi
-
[66]
Smith, J. D. T., Draine, B. T., Dale, D. A., et al. 2007, ApJ, 656, 770, doi: 10.1086/510549
2007 doi
-
[67]
Silverman, J. D. 2014, ApJS, 214, 15, doi: 10.1088/0067-0049/214/2/15
2014 doi
-
[68]
Tielens, A. G. G. M. 2008, ARA&A, 46, 289, doi: 10.1146/annurev.astro.46.060407.145211
2008
- [69]
-
[70]
X., Maragkoudakis, A., & Peeters, E
Zang, R. X., Maragkoudakis, A., & Peeters, E. 2022, MNRAS, 511, 5142, doi: 10.1093/mnras/stac214
2022 doi
Reviewed August 12, 2026 · model on record in the stance chip above.
Discussion (0). Continue with ORCID to comment.