Syndesmoscope: The Power of Invariant Plots Linked to Traditional Network Views
Pith reviewed 2026-06-26 16:21 UTC · model grok-4.3
The pith
Linking force-directed network views with invariant plots via leapfrogging and hopscotching reveals patterns inaccessible through any single view.
A machine-rendered reading of the paper's core claim, the machinery that carries it, and where it could break.
Core claim
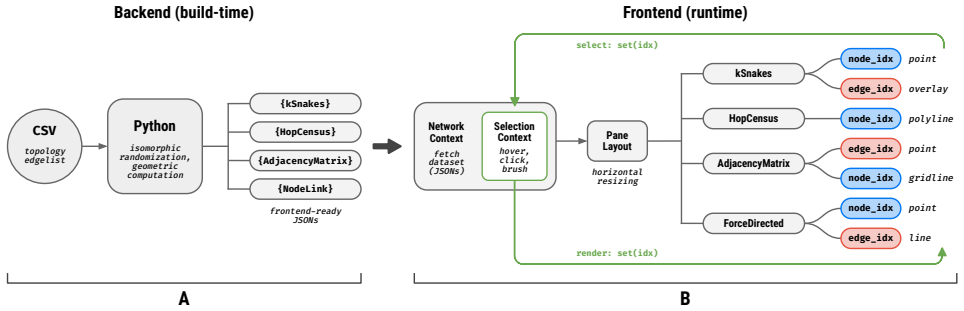
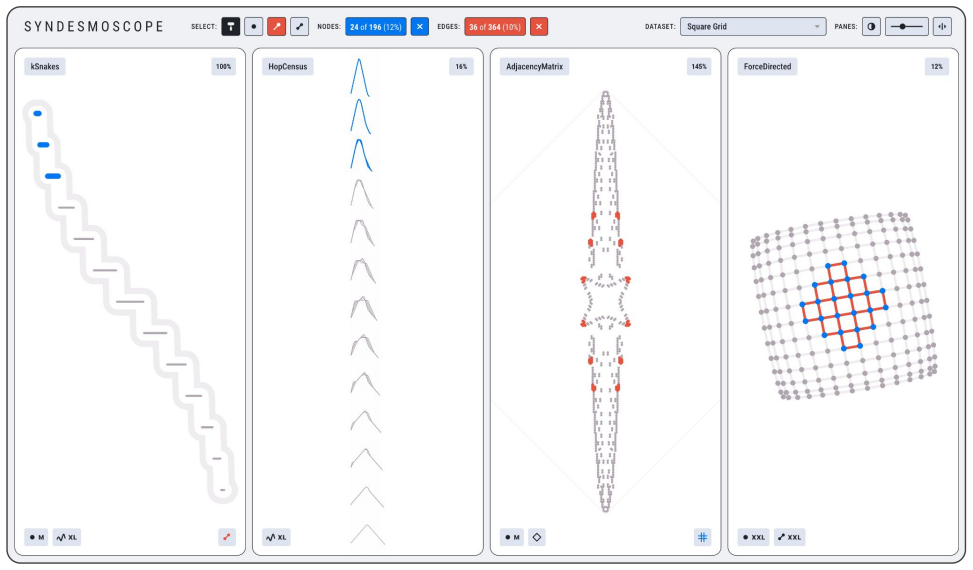
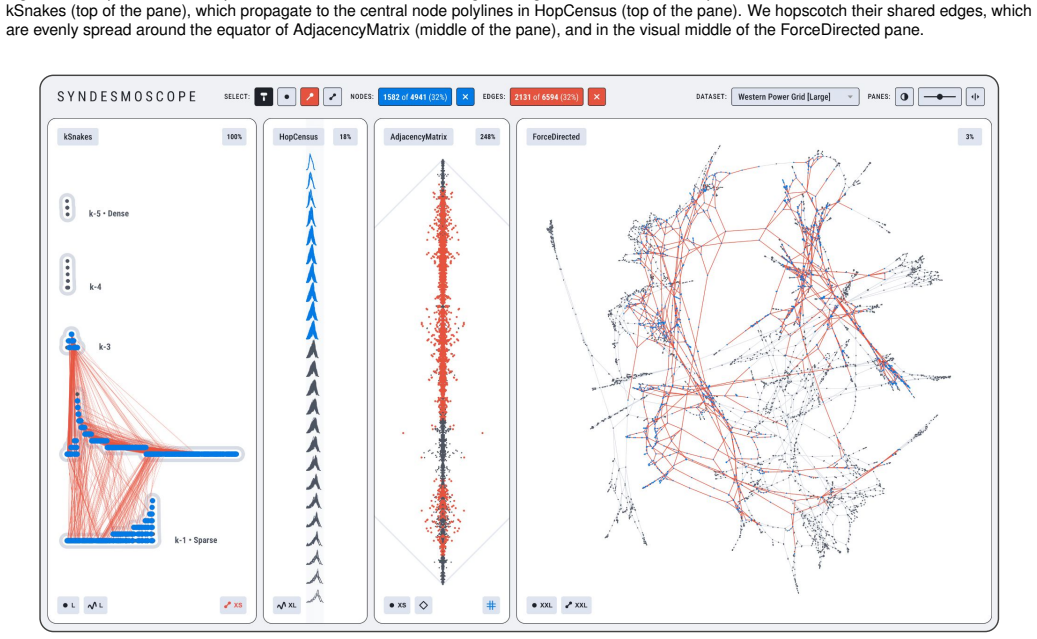
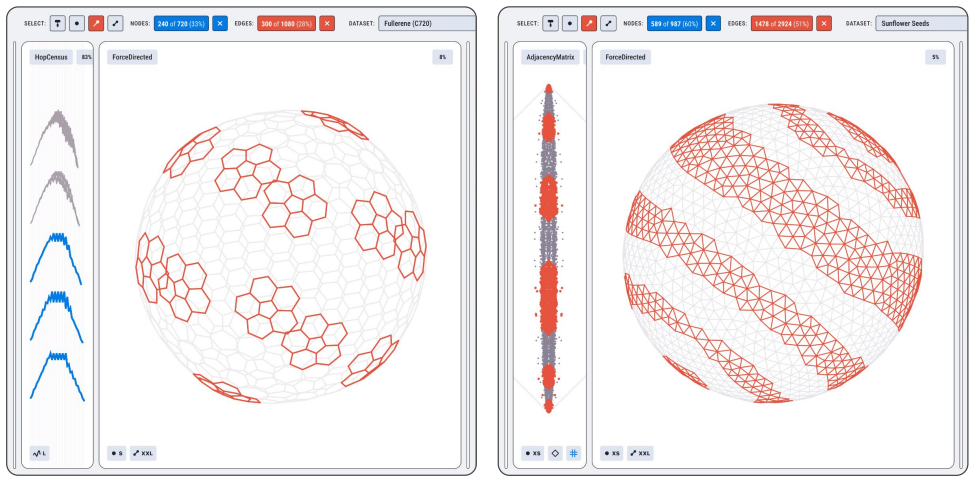
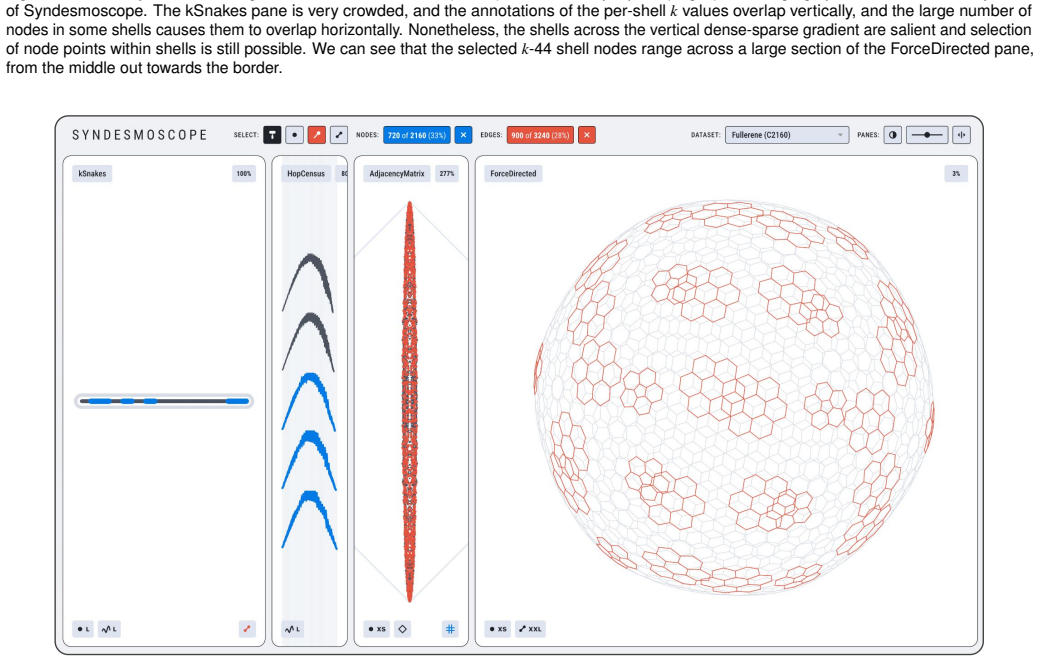
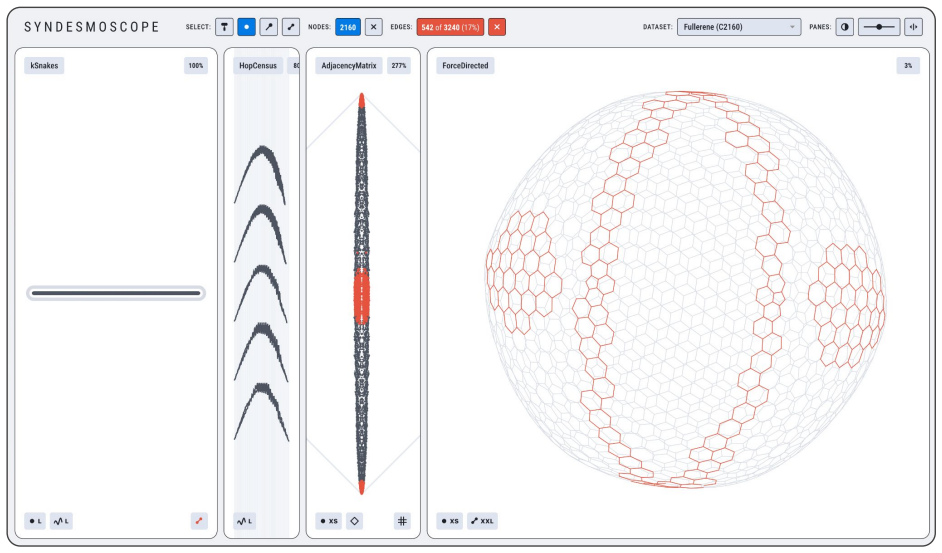
Syndesmoscope demonstrates that juxtaposing a force-directed layout with invariant plots derived from dense-sparse gradients, geodesic eccentricity, spectral bisection, and kSnakes density decomposition, combined with leapfrogging and hopscotching interactions, allows users to discover network patterns that cannot be seen in any individual view alone, as shown through usage scenarios on a corpus of 72 diverse networks.
What carries the argument
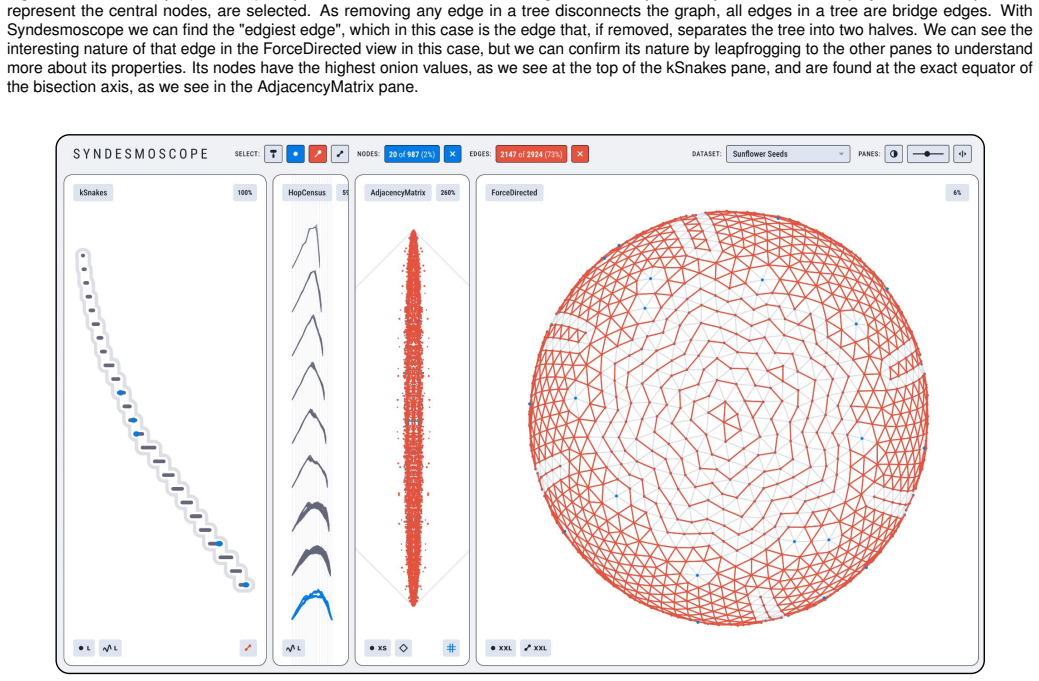
Leapfrogging and hopscotching, the linked highlighting and hop-based traversal interactions that connect the force-directed pane to the invariant plot panes.
If this is right
- The same network topology produces multiple distinct yet consistent visual patterns that can be compared directly.
- Selections made in one pane can be propagated to others to trace connectivity-based structures.
- Invariant plots supply stable reference frames that offset the variability of force-directed layouts.
- Patterns become visible only when the system switches emphasis between density, distance, spectral cuts, and decomposition views.
Where Pith is reading between the lines
- The same linking mechanism could be applied to other pairs of variable and invariant representations in visualization.
- The method reduces dependence on selecting a single optimal layout algorithm for analysis.
- Quantitative measures of insight gain could be defined by counting newly visible substructures after each interaction.
Load-bearing premise
The four chosen invariant plots together with the two interactions are sufficient to surface otherwise inaccessible patterns in networks.
What would settle it
A network, whether in the 72-network corpus or similar, in which applying leapfrogging and hopscotching produces no additional visible structures beyond those already apparent in the force-directed view alone.
Figures
read the original abstract
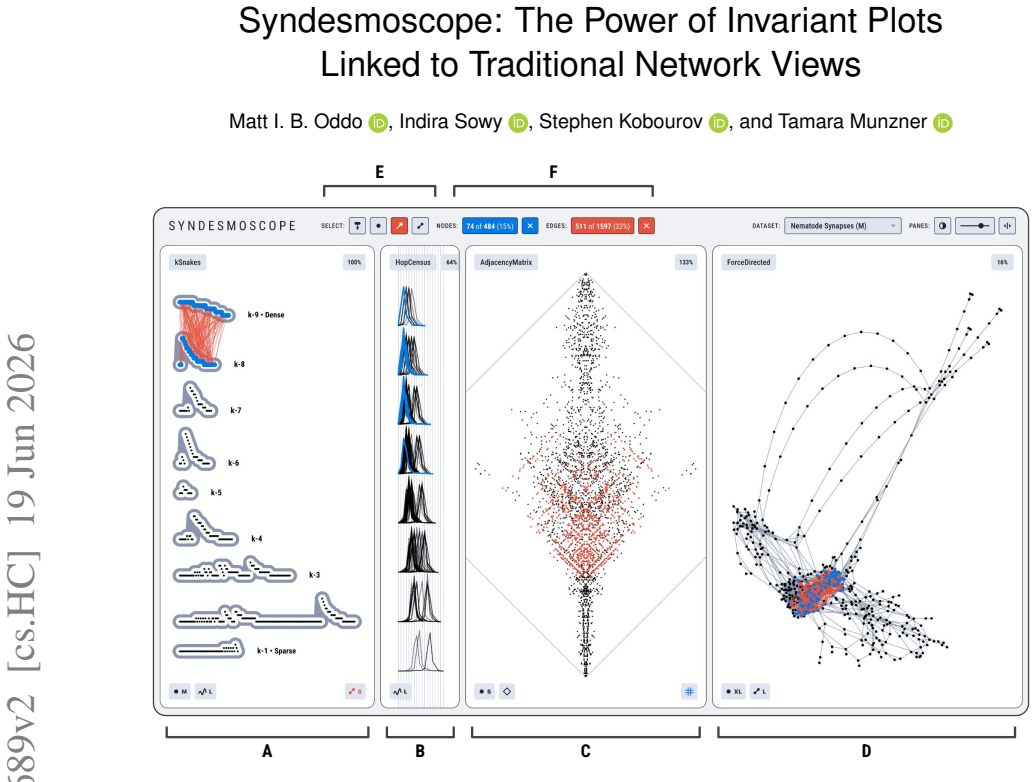
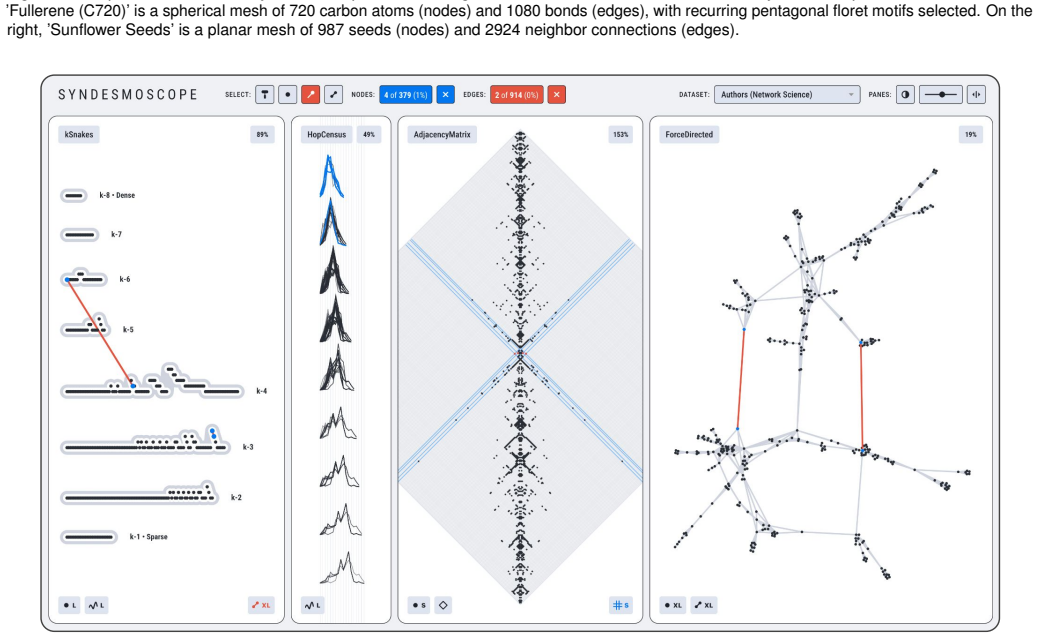
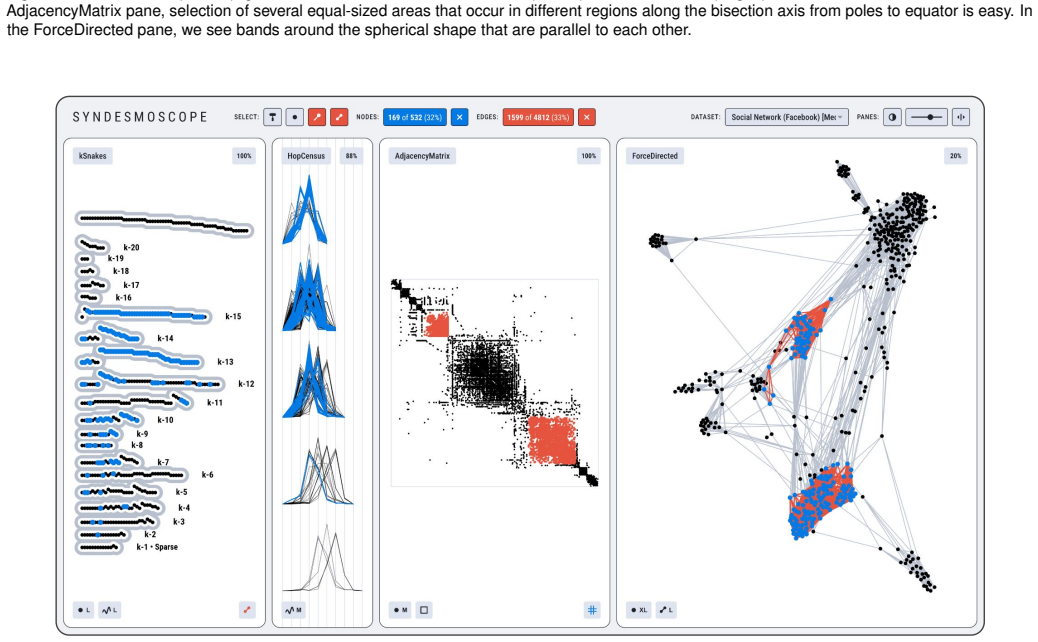
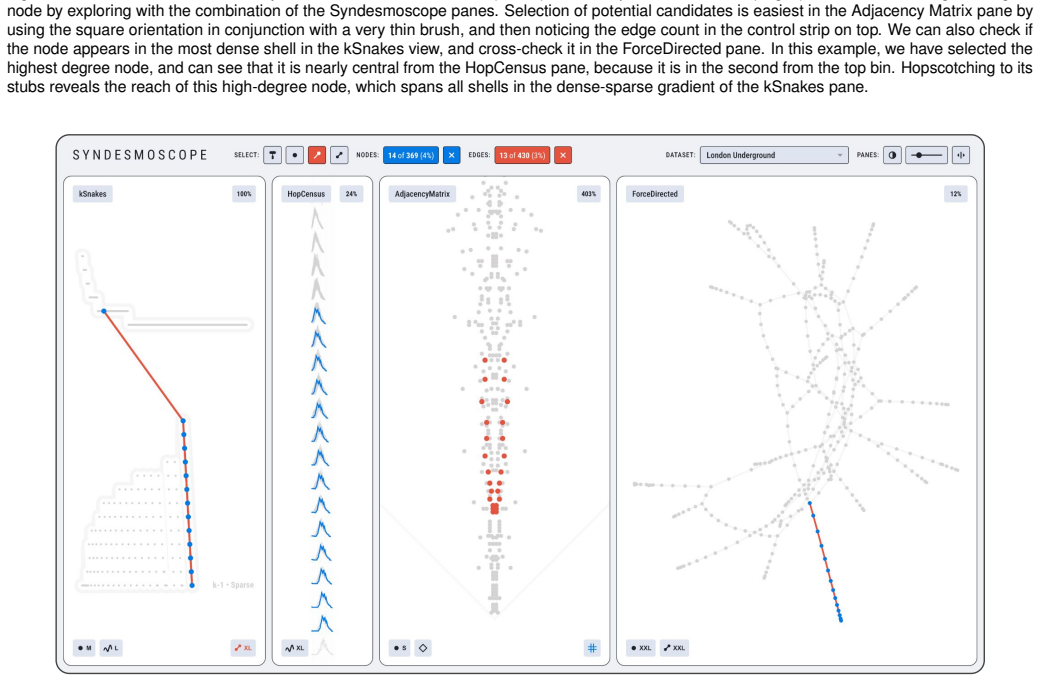
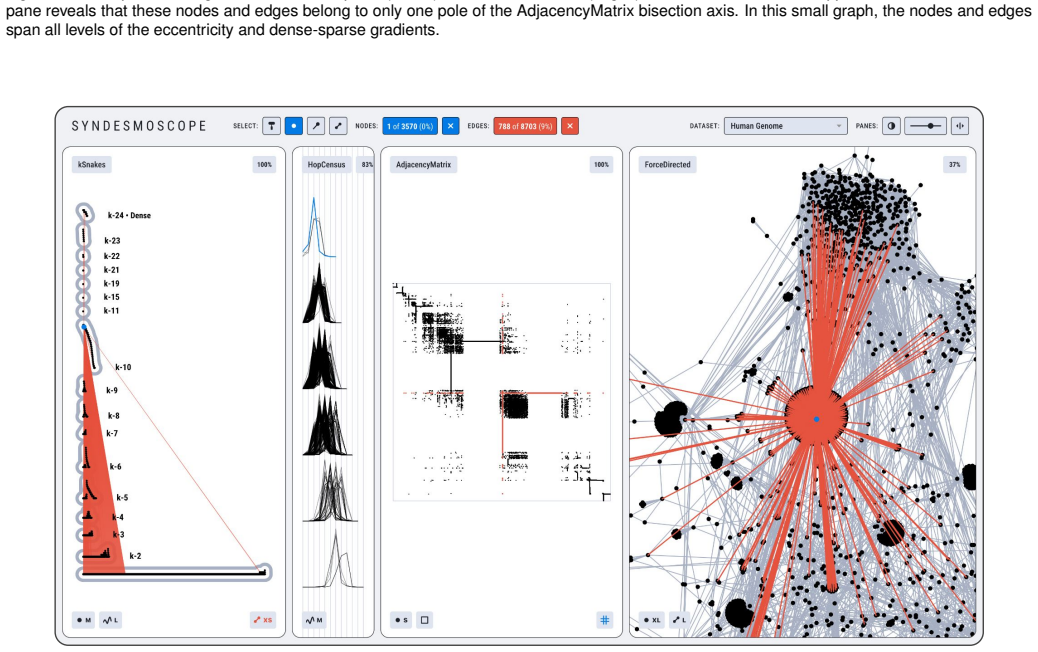
Traditional network representations, such as node-link views and adjacency matrices, can show dramatically different visual patterns, depending on the underlying layout or seriation algorithm. In contrast, invariant plots consistently surface the same visual pattern for the same input topology; yet researchers have underexplored them and have not integrated them into visualization systems. We present Syndesmoscope, an interactive system for network exploration that juxtaposes multiple views of the same network. Panes show a familiar a force-directed view alongside three panes with interpretable geometric layouts based on graph-theoretic properties: dense-sparse gradient, geodesic eccentricity, and spectral bisection. As a secondary contribution, we introduce kSnakes, a new invariant plot based on density decomposition. Syndesmoscope supports two key interactions: leapfrogging, or linked highlighting between different and interpretable visual patterns; and hopscotching, or hop-based traversal that extends data selections through the underlying topology. Through usage scenarios across a corpus of 72 diverse networks, we demonstrate how these interactions reveal network patterns inaccessible through any single view alone. Live demo available at https://syndesmoscope.vercel.app/.
Editorial analysis
A structured set of objections, weighed in public.
Referee Report
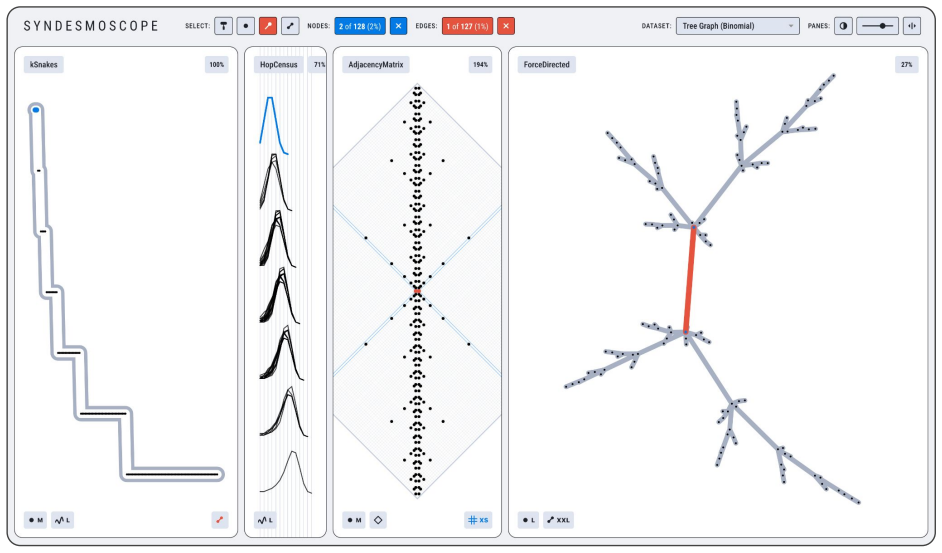
Summary. The manuscript presents Syndesmoscope, an interactive system juxtaposing force-directed node-link views with three invariant plots (dense-sparse gradient, geodesic eccentricity, spectral bisection) plus a new kSnakes plot based on density decomposition. It defines leapfrogging (linked highlighting across views) and hopscotching (topology-extended selection traversal) interactions and claims that usage scenarios on a corpus of 72 networks demonstrate patterns inaccessible via any single view.
Significance. If the linked invariant plots and interactions can be shown to surface genuinely new structural insights, the work would usefully extend network visualization practice by integrating interpretable geometric layouts with conventional views. The live demo at https://syndesmoscope.vercel.app/ is a concrete strength that aids reproducibility and allows direct inspection of the described interactions.
major comments (2)
- [Usage Scenarios] Usage Scenarios section: the central claim that leapfrogging and hopscotching 'reveal network patterns inaccessible through any single view alone' rests entirely on author-curated narrative scenarios across 72 networks. No quantitative metric of insight gain, no controlled comparison against single-view baselines, and no user study are reported, leaving the inaccessibility assertion untested.
- [System Design] System Design / kSnakes subsection: the manuscript introduces kSnakes as a new invariant plot but provides no formal definition, invariance proof, or comparison showing how its density-decomposition layout differs from or improves upon the three other invariant plots already included.
minor comments (2)
- [Abstract] The abstract and introduction should explicitly state the selection criteria or diversity metrics used for the 72-network corpus so readers can assess representativeness.
- [Figures] Figure captions for the invariant plots would benefit from explicit axis labels or legends indicating the plotted graph-theoretic quantities.
Simulated Author's Rebuttal
We thank the referee for the constructive feedback on Syndesmoscope. The comments highlight opportunities to clarify our evaluation approach and the presentation of kSnakes. We respond to each major comment below.
read point-by-point responses
-
Referee: [Usage Scenarios] Usage Scenarios section: the central claim that leapfrogging and hopscotching 'reveal network patterns inaccessible through any single view alone' rests entirely on author-curated narrative scenarios across 72 networks. No quantitative metric of insight gain, no controlled comparison against single-view baselines, and no user study are reported, leaving the inaccessibility assertion untested.
Authors: We agree that the central claim rests on author-curated scenarios without quantitative metrics, controlled comparisons, or a user study, leaving the assertion of inaccessibility untested in a formal sense. In the network visualization literature, usage scenarios are a standard method for demonstrating the utility of new linked views and interactions on diverse data. To address the concern, we will revise the abstract and Usage Scenarios section to replace 'demonstrate' with 'illustrate' and add an explicit limitations paragraph noting the illustrative nature of the scenarios and the value of future controlled studies. This is a partial revision, as a full user study lies outside the current scope. revision: partial
-
Referee: [System Design] System Design / kSnakes subsection: the manuscript introduces kSnakes as a new invariant plot but provides no formal definition, invariance proof, or comparison showing how its density-decomposition layout differs from or improves upon the three other invariant plots already included.
Authors: The kSnakes subsection currently describes the plot via density decomposition but lacks an explicit algorithmic definition and direct comparisons. We will expand the subsection to include a formal step-by-step definition of the kSnakes construction, a brief argument for invariance derived from the decomposition process, and side-by-side comparisons that position kSnakes as providing a distinct hierarchical density view relative to the dense-sparse gradient, geodesic eccentricity, and spectral bisection plots. These additions will appear in the revised manuscript. revision: yes
Circularity Check
No circularity: system design paper with no derivation chain
full rationale
The paper introduces a visualization system (Syndesmoscope) and two interactions (leapfrogging, hopscotching) demonstrated via narrative usage scenarios on 72 networks. No equations, parameters, or mathematical derivations exist that could reduce to inputs by construction. The central claim of revealing inaccessible patterns rests on author-selected scenarios rather than any self-referential definition, fitted prediction, or self-citation load-bearing step. This matches the default expectation of no significant circularity for non-derivational contributions.
Axiom & Free-Parameter Ledger
Reference graph
Works this paper leans on
-
[1]
Abdelaal, N
M. Abdelaal, N. D. Schiele, K. Angerbauer, K. Kurzhals, M. Sedlmair, and D. Weiskopf. Comparative evaluation of bipartite, node-link, and matrix- based network representations.IEEE Trans. Visualization & Computer Graphics (TVCG), 29(1):896–906, 2022. 1
2022
-
[2]
Alvarez-Hamelin, L
J. Alvarez-Hamelin, L. Dall’Asta, A. Barrat, and A. Vespignani. Large scale networks fingerprinting and visualization using the k-core decom- position.Advances in neural information processing systems, 18, 2005. 4
2005
-
[3]
Auber, D
D. Auber, D. Archambault, R. Bourqui, M. Delest, J. Dubois, A. Lambert et al. TULIP 5.Encyclopedia of social network analysis and mining, pp. 1–28, 2017. 4
2017
-
[4]
J. P. Bagrow and E. M. Bollt. An information-theoretic, all-scales approach to comparing networks.Applied Network Science, 4(1):1–15, 2019. 2, 5, 9
2019
-
[5]
J. P. Bagrow, E. M. Bollt, J. D. Skufca, and D. Ben-Avraham. Portraits of complex networks.Europhysics Letters, 81(6):68004, 2008. 2, 4, 5
2008
-
[6]
Bastian, S
M. Bastian, S. Heymann, and M. Jacomy. Gephi: An open source software for exploring and manipulating networks. InProceedings of the interna- tional AAAI conference on web and social media, vol. 3, pp. 361–362,
-
[7]
Batagelj, A
V . Batagelj, A. Mrvar, et al. Pajek-program for large network analysis. Connections, 21(2):47–57, 1998. 4
1998
-
[8]
V . Batagelj and M. Zaversnik. An o(m) algorithm for cores decomposition of networks.arXiv preprint cs/0310049, 2003. 2, 3
Pith/arXiv arXiv 2003
-
[9]
Behrisch, B
M. Behrisch, B. Bach, N. Henry Riche, T. Schreck, and J.-D. Fekete. Matrix reordering methods for table and network visualization.Computer Graphics Forum (CGF), 35:693–716, 2016. 1, 3
2016
-
[10]
S. P. Borgatti and M. G. Everett. Models of core/periphery structures. Social networks, 21(4):375–395, 2000. 4
2000
-
[11]
Bostock, V
M. Bostock, V . Ogievetsky, and J. Heer. D3: Data-driven documents.IEEE transactions on visualization and computer graphics, 17(12):2301–2309,
-
[12]
Chimani, C
M. Chimani, C. Gutwenger, M. Jünger, G. W. Klau, K. Klein, P. Mutzel et al. The open graph drawing framework (OGDF).Handbook of graph drawing and visualization, 2011:543–569, 2013. 3
2011
-
[13]
Concas, C
A. Concas, C. Fenu, G. Rodriguez, and R. Vandebril. The seriation problem in the presence of a double Fiedler value.Numerical Algorithms, 92(1):407–435, 2023. 3
2023
-
[14]
Cosmograph: Interactive network visualization
Cosmograph. Cosmograph: Interactive network visualization. https: //cosmograph.app, 2022. 4
2022
-
[15]
Csardi and T
G. Csardi and T. Nepusz. The igraph software.Complex syst, 1695:1–9,
-
[16]
H. Cui, Z. Lu, P. Li, and C. Yang. On positional and structural node features for graph neural networks on non-attributed graphs.ACM CIKM, pp. 3898–3902, 2022. 2
2022
-
[17]
Ghoniem, J
M. Ghoniem, J. Fekete, and P. Castagliola. A comparison of the readability of graphs using node-link and matrix-based representations.IEEE Conf. Information Visualization (InfoVis), pp. 17–24, 2004. 2
2004
-
[18]
Girvan and M
M. Girvan and M. E. Newman. Community structure in social and bi- ological networks.Proceedings of the national academy of sciences, 99(12):7821–7826, 2002. 4
2002
-
[19]
Hagberg, P
A. Hagberg, P. J. Swart, and D. A. Schult. Exploring network structure, dynamics, and function using networkX. Technical report, Los Alamos National Laboratory (LANL), 2007. 3, 5
2007
-
[20]
C. R. Harris, K. J. Millman, S. J. Van Der Walt, R. Gommers, P. Vir- tanen, D. Cournapeau et al. Array programming with NumPy.nature, 585(7825):357–362, 2020. 5
2020
-
[21]
Hébert-Dufresne, J
L. Hébert-Dufresne, J. A. Grochow, and A. Allard. Multi-scale structure and topological anomaly detection via a new network statistic: The onion decomposition.Nature Scientific Reports, 6(1):31708, 2016. 2, 3
2016
-
[22]
Henry and J.-D
N. Henry and J.-D. Fekete. MatrixExplorer: a dual-representation sys- tem to explore social networks.IEEE Trans. Visualization & Computer Graphics (TVCG), 12(5):677–684, 2006. 4
2006
-
[23]
X. Hu, A. Lu, and X. Wu. Spectrum-based network visualization for topology analysis.IEEE computer graphics and applications, 33(1):58– 68, 2012. 3
2012
-
[24]
J. D. Hunter. Matplotlib: A 2D graphics environment.Computing in science & engineering, 9(3):90–95, 2007. 3
2007
-
[25]
Jamil, Y
H. Jamil, Y . Liu, T. Caglar, C. Cole, N. Blanchard, C. Peterson et al. Ham- ming similarity and graph Laplacians for class partitioning and adversarial image detection. pp. 590–599, 2023. 3
2023
-
[26]
Kairam, D
S. Kairam, D. MacLean, M. Savva, and J. Heer. GraphPrism: Compact vi- sualization of network structure.Proceedings of the International Working Conference on Advanced Visual Interfaces, pp. 498–505, 2012. 4, 9
2012
-
[27]
S. H. Lee, M. Cucuringu, and M. A. Porter. Density-based and transport-based core-periphery structures in networks.Physical Review E, 89(3):032810, 2014. 4
2014
-
[28]
McNutt, M
A. McNutt, M. C. Stone, and J. Heer. Mixing linters with GUIs: A color palette design probe.IEEE Trans. Visualization & Computer Graphics (TVCG), 31(1):327–337, 2024. 6
2024
-
[29]
M. Newman. The structure and function of complex networks.SIAM Review, 45(2):167–256, 2003. 2
2003
-
[30]
M. I. Oddo, S. Kobourov, and T. Munzner. The census-stub graph invariant descriptor.IEEE Trans. Visualization & Computer Graphics (TVCG), 31(3):1945–1961, 2025. 1, 2, 4, 6
1945
-
[31]
M. I. Oddo, R. Smith, S. Kobourov, and T. Munzner. Visualization tasks for unlabeled graphs.IEEE Trans. Visualization & Computer Graphics (TVCG), 2026. 2, 4
2026
-
[32]
G. A. Pavlopoulos, D. Paez-Espino, N. C. Kyrpides, and I. Iliopoulos. Em- pirical comparison of visualization tools for larger-scale network analysis. Advances in bioinformatics, 2017(1):1278932, 2017. 4
2017
-
[33]
T. P. Peixoto. The Netzschleuder network catalogue and repository.Zen- odo, 2020. 6
2020
-
[34]
Renoust, G
B. Renoust, G. Melançon, and T. Munzner. Detangler: Visual analytics for multiplex networks. InComputer graphics forum, vol. 34, pp. 321–330. Wiley Online Library, 2015. 2, 4
2015
-
[35]
J. C. Roberts. State of the art: Coordinated & multiple views in exploratory visualization. InFifth international conference on coordinated and mul- tiple views in exploratory visualization (CMV 2007), pp. 61–71. IEEE,
2007
-
[36]
Shannon, A
P. Shannon, A. Markiel, O. Ozier, N. S. Baliga, J. T. Wang, D. Ramage et al. Cytoscape: A software environment for integrated models of biomolecular interaction networks.Genome research, 13(11):2498–2504, 2003. 3
2003
-
[37]
X. Shu, A. Pister, J. Tang, F. Chevalier, and B. Bach. Does this have a par- ticular meaning? Interactive pattern explanation for network visualizations. IEEE Trans. Visualization & Computer Graphics (TVCG), 31(1):677–687,
-
[38]
Wickham et al
H. Wickham et al. Elegant graphics for data analysis, 2016. 3
2016
-
[39]
Yoghourdjian, T
V . Yoghourdjian, T. Dwyer, K. Klein, K. Marriott, and M. Wybrow. Graph Thumbnails: Identifying and comparing multiple graphs at a glance.IEEE Trans. Visualization & Computer Graphics (TVCG), 24(12):3081–3095,
-
[40]
edgiest edge
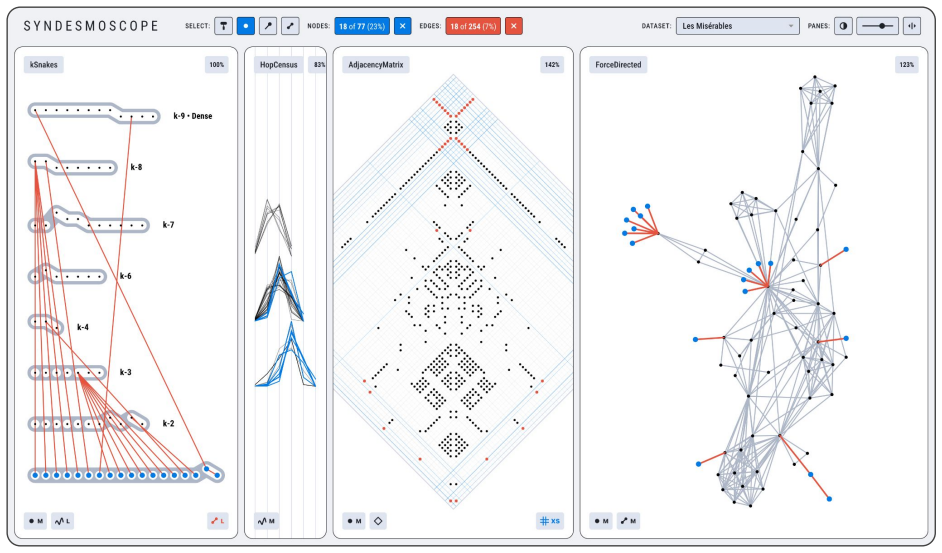
yWorks GmbH. yWorks: Network & diagram visualization. https: //www.yworks.com, 2024. 3 A APPENDIX In this Appendix we present 12 more scenarios, in addition to the 6 usage scenarios in the main paper. Fig. 10: The ’Les Misérables’ literary dataset: 77 characters (nodes) and 254 spoken interactions (edges). In the kSnakes pane, we brush-select all the node...
2024
discussion (0)
Sign in with ORCID, Apple, or X to comment. Anyone can read and Pith papers without signing in.