REVIEW 3 major objections 4 minor 101 references
Even redder than we knew: color and $A_{\mathrm{V}}$ evolution up to $z=2.5$ from JWST/NIRCam photometry
T0 review · 3 major / 4 minor · reviewed 2026-08-06 · deepseek-v4-flash
Pith's one-line read JWST/NIRCam photometry shows that massive star-forming galaxies at z≈2 are far dustier than earlier surveys indicated, with V-J colors past 2.5 and visual extinction up to 3.5 magnitudes.
desk verdict A solid, transparent demonstration that massive star-forming galaxies at z~2 are much redder and more dust-attenuated than previously thought, with the main caveat being the small spectroscopic validation sample for the reddest objects. read the letter →
The pith
A machine-rendered reading of the paper's core claim, the machinery that carries it, and where it could break.
The reading
What carries the argument
The central machinery is the rest-frame $V-J$ color, the difference between rest-frame $V$-band and $J$-band magnitudes, measured from JWST/NIRCam photometry combined with HST imaging. In the $U-V$ versus $V-J$ diagram, dusty star-forming galaxies are red in $V-J$ while quiescent galaxies are blue in $V-J$, so this color separates attenuation by dust from the reddening caused by old stellar populations. The measurement works because NIRCam provides rest-frame near-infrared coverage up to $z\approx2.5$, and because the precise photometry removes the systematic redshift overestimates that previously pushed the reddest galaxies to the wrong distances and washed out the tail.
What would settle it
A spectroscopic redshift survey of galaxies with $V-J>2.5$ at $z\approx1.5$–$2.5$ would settle the claim: if the new photometric redshifts show the same roughly 0.4 overestimate seen in earlier catalogs, the red tail and the inferred rise in $A_{\mathrm{V}}$ would largely disappear.
Extended reading notes
Core claim
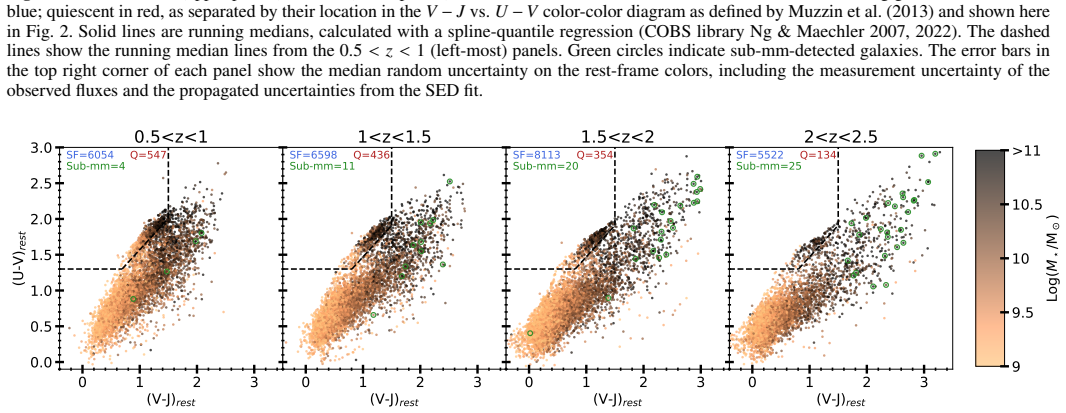
The central discovery is that the rest-frame $V-J$ versus stellar mass relation for star-forming galaxies becomes very steep at $z>1.5$, with high-mass galaxies ($M_\star > 3\times10^{10}\,M_\odot$) reaching $V-J\approx2$–$3$, while the same galaxies at $z<1$ have $V-J\approx1$–$1.5$. The reddest colors cannot be produced by old stellar populations, so they must come from dust; spectral-energy-distribution fitting gives $A_{\mathrm{V}}\approx1.5$–$3.5$ for $M_\star\approx10^{11}\,M_\odot$ at $z\approx2$, with about 90% of such galaxies having $A_{\mathrm{V}}>2$ at $z>1.5$. The paper attributes the previously unseen evolution to improved photometric redshifts for the reddest galaxies: for 25 galaxies with spectroscopic redshifts and $V-J>2.5$, the new median photometric redshift matches the spectroscopic median, whereas the older catalog overestimated it by about 0.4. The $U-V$ colors of these galaxies stay relatively blue, so the attenuation must be gray in the ultraviolet-optical, consistent with attenuation of most stars younger than about one gigayear rather than only the youngest star-forming regions.
Load-bearing premise
The result depends on the assumption that the photometric redshifts for the reddest, most dust-obscured galaxies are now correct, and the paper's own check of this assumption uses only 25 spectroscopic redshifts.
Editorial extensions
If this is right
- At $0.5<z<2.5$ the rest-frame $U-V$ color distribution evolves only mildly, so the familiar UV-optical red sequence and blue cloud hide a strong optical-to-near-infrared evolution that only $V-J$ reveals.
- Nearly all star-forming galaxies with $M_\star>10^{11}\,M_\odot$ at $z>1.5$ have $A_{\mathrm{V}}>2$, so these systems should be treated as heavily dust-obscured rather than moderately reddened.
- Older photometric-redshift catalogs systematically misplaced the reddest galaxies toward higher redshift, so samples built from them need to be re-derived or re-calibrated for these objects.
- The red $V-J$ tail of the mass-selected sample overlaps with the ALMA sub-mm selected population, indicating that the NIRCam colors and the sub-mm detections trace the same obscured star-forming galaxies.
- Because $U-V$ remains relatively blue at high attenuation, using $U-V$ alone to infer dust content or to classify galaxies as quiescent will misclassify massive dusty galaxies.
Reading between the lines
- If the redshift improvement turns out to come from better templates rather than better photometry, the same correction could be applied to existing HST-only catalogs, shifting their color distributions without new observations.
- If dust attenuation rises this steeply with redshift, the peak may lie beyond $z=2.5$, making the $z>1.5$ tail described here the low-redshift edge of the optically dark, dust-obscured population found at $z\gtrsim3$.
- A direct test of the gray-attenuation interpretation would compare NIRCam-based $A_{\mathrm{V}}$ with independently measured far-infrared or millimeter dust luminosities for the same individual galaxies.
- The steep mass dependence of $A_{\mathrm{V}}$ suggests that gas fraction and dust geometry, rather than metallicity, set the dust column; galaxy formation models that reproduce this $A_{\mathrm{V}}$–mass–redshift relation would be needed to explain the heavy obscuration of massive galaxies at $z\approx2$.
Editorial analysis
A structured set of objections, weighed in public.
Referee Report
Summary. This paper uses JWST/NIRCam photometry from the DAWN JWST Archive to construct a stellar-mass-complete sample of about 28,000 galaxies with M* > 10^9 M_sun in the redshift range 0.5 < z < 2.5, and studies the evolution of rest-frame U-V and V-J colors and the dust attenuation parameter A_V. The central claim is that the V-J color distribution of star-forming galaxies evolves strongly with redshift: massive galaxies (M* > 3e10 M_sun) at z > 1.5 exhibit a pronounced tail reaching V-J > 2.5, which is absent at z < 1, and this tail is interpreted as arising from dust attenuation with A_V in the range 1.5-3.5 for M* ~ 1e11 M_sun at z ~ 2. The authors attribute the previous lack of detection of this population to overestimated photometric redshifts for the reddest objects in earlier catalogs, and support their interpretation with a comparison to 25 spectroscopic redshifts and with cross-matching to sub-mm selected galaxies. A check with an independent SED-fitting code (bagpipes) is presented for the A_V values of the reddest subsample.
Significance. If the central claim holds, this is an important result: it would mean that massive star-forming galaxies at cosmic noon are significantly more dust-attenuated than previously inferred from rest-frame optical colors, with A_V values extending to 3-4, and that earlier ground- and space-based surveys systematically underestimated this population because of photo-z biases. The paper is concise, uses high-quality public JWST data, and makes a falsifiable prediction that a comprehensive spectroscopic survey of high-A_V galaxies at z > 1 should confirm the high attenuation. The independent bagpipes check for the reddest galaxies and the sub-mm cross-match are notable strengths. However, the central claim rests on the reliability of photometric redshifts for a small and extreme subset of the sample, and the current validation sample is too small to fully secure that footing.
major comments (3)
- [Section 3.1, photo-z validation paragraph] The claim that the red V-J tail at z > 1.5 is real and was previously missed because of photo-z biases rests on the comparison with only 25 spectroscopic redshifts for galaxies with V-J > 2.5. This is a very small sample on which to base a strong evolutionary claim, and the paper itself notes that it remains undetermined whether the improvement comes from better photometry or better templates. The authors should quantify the impact of plausible photo-z errors on the inferred color distributions, for example by applying the old 3D-HST photo-z error distribution to the current sample and showing how the V-J tail and the z=1.5 boundary would shift. They should also report how many galaxies in the final sample have V-J > 2.5 in each redshift bin, and how many of those have spectroscopic redshifts, so that the reader can judge the statistical weight of the 25-object validation.
- [Section 3.1 and Figure 1] The statement that the red tail 'does not exist at z < 1' is based on running medians (shown as solid lines) and the visual appearance of the scatter plots, without any confidence intervals or counts of the tail population. Given that the running median is not sensitive to the existence of a tail and the reddest objects are sparse, the authors should provide a quantitative characterization of the tail—for example, the fraction of massive star-forming galaxies with V-J > 2.5 (or > 2.0) as a function of redshift, with bootstrap uncertainties. Without such a statistic, the absence of the tail at low redshift is not demonstrated to be significant.
- [Section 3.2, A_V evolution] The A_V values and the V-J colors are both outputs of the same EAZY SED fits, so the correlation between V-J and A_V used to interpret the red tail is partly built into the model. The bagpipes check is welcome, but it is applied only to the V-J > 2.5 subsample, leaving the redshift evolution of A_V for the full star-forming population untested in an independent way. The authors should either run bagpipes on a representative subsample spanning the full mass-redshift range, or explicitly state that the A_V evolution is a model-dependent inference whose robustness has only been verified for the extreme tail.
minor comments (4)
- [Abstract and Section 3.1] The sentence 'the photometric redshift estimates for the reddest... has markedly improved' contains a subject-verb agreement error; 'estimates' is plural and should take 'have'. The same issue appears in the abstract.
- [Section 2] The phrase 'These data product derive' should be 'These data products derive'.
- [Figure 2] The color bar on the right side of the figure is labeled 'Log(M/M_sun)' but it is not immediately clear that this color coding applies to the plotted points; please clarify in the caption.
- [Section 1, footnote 1] The footnote on the origin of the term 'quenching' is interesting but tangential; consider moving it to the main text or removing it, as it interrupts the flow of the introduction.
Circularity Check
No significant circularity: the reported colors and AV values are SED-fit outputs, but the central color-evolution claim is independently supported by spec-z, sub-mm, and a separate SED code.
full rationale
The paper is an observational analysis of DJA value-added products, not a first-principles derivation. Rest-frame V-J and AV are both outputs of the same SED-fitting pipeline, so a model-imposed correlation is conceivable; however, the paper does not define one in terms of the other or fit a parameter and then rename it as a prediction. The V-J redshift evolution is validated against 25 spectroscopic redshifts, the reddest objects overlap with ALMA sub-mm detections, and AV for the extreme tail is re-derived with bagpipes, yielding consistent values. The admitted open question of whether improved photo-zs are due to better photometry or better templates is an explicit limitation, not a circular reduction. Self-citations (Martis et al. 2016/2019, Gebek et al. 2025, van der Wel et al. 2014) provide context and prior support rather than load-bearing uniqueness arguments. No equation equates a predicted quantity to a fitted input, so no specific circular step can be exhibited.
Assumptions & free parameters
assumptions (4)
- domain assumption Flat Lambda CDM cosmology with H0 = 70 km/s/Mpc and Omega_m = 0.3.
- domain assumption Chabrier (2003) initial mass function.
- domain assumption The DJA SED templates (agn_blue_sfhz_13) and the dust attenuation model in the EAZY fitting code produce unbiased rest-frame colors, M_star, and A_V for red galaxies.
- domain assumption Quiescent galaxies have V-J < 1.2 in rest-frame, so V-J > 2 necessarily implies dust attenuation.
Cite this review
Pith. "Pith review of Even redder than we knew: color and $A_{\mathrm{V}}$ evolution up to $z=2.5$ from JWST/NIRCam photometry." pith.science (2026). https://pith.science/paper/EYD4XX6N
@misc{pith2026250623669,
  author       = {Pith},
  title        = {Pith review of: Even redder than we knew: color and $A_\mathrmV$ evolution up to $z=2.5$ from JWST/NIRCam photometry},
  year         = {2026},
  howpublished = {\url{https://pith.science/paper/EYD4XX6N}},
  note         = {Machine review of arXiv:2506.23669}
}
abstract
JWST/NIRCam provides rest-frame near-IR photometry of galaxies up to $z=2.5$ with exquisite depth and accuracy. This affords an unprecedented view of the evolution of the UV-optical-near-IR color distribution and its interpretation in terms of the evolving dust attenuation, $A_{\mathrm{V}}$. We use the value-added data products (photometric redshift, stellar mass, rest-frame $U-V$ and $V-J$ colors, and $A_{\rm V}$) provided by the public DAWN JWST Archive. This data product derives from fitting the spectral energy distributions obtained from multiple NIRCam imaging surveys, augmented with pre-existing HST imaging data. Our sample consists of a stellar mass complete sample of $\approx 28,000$ $M_\star> 10^{9}~M_\odot$ galaxies in the redshift range $0.5<z<2.5$. The $V-J$ color distribution of star-forming galaxies evolves strongly, in particular for high-mass galaxies ($M_\star>3\times 10^{10}~M_\odot$), which have a pronounced tail of very red galaxies reaching $V-J> 2.5$ at $z>1.5$ that does not exist at $z<1$. Such red $V-J$ can only be explained by dust attenuation, with typical values for $M_\star \approx 10^{11}~M_\odot$ galaxies in the range $A_{\mathrm{V}}\approx 1.5-3.5$ at $z\approx 2$. This redshift evolution went largely unnoticed before because the photometric redshift estimates for the reddest ($V-J>2.5$), most attenuated galaxies has markedly improved thanks to the new, precise photometry. Despite the increased attenuation, $U-V$ colors across the entire mass range are slightly bluer at higher $z$. In conclusion, whereas the rest-frame UV-optical color distribution evolves remarkably little from $z=0.5$ to $z=2.5$, the rest-frame optical-near-IR color distribution evolves strongly, primarily due to a very substantial increase with redshift in dust attenuation for massive galaxies. (Abbr.)
Figures


Reference graph
Works this paper leans on
-
[1]
2024, , 685, A1
Adscheid , S., Magnelli , B., Liu , D., et al. 2024, , 685, A1
2024
-
[2]
B., Casey , C
Akins , H. B., Casey , C. M., Allen , N., et al. 2023, , 956, 61
2023
-
[3]
1987, , 94, 831
Armus , L., Heckman , T., & Miley , G. 1987, , 94, 831
1987
-
[4]
J., Le F \`e vre , O., et al
Arnouts , S., Walcher , C. J., Le F \`e vre , O., et al. 2007, , 476, 137
2007
-
[5]
G., Kocevski , D
Barro , G., P \'e rez-Gonz \'a lez , P. G., Kocevski , D. D., et al. 2024, , 963, 128
2024
-
[6]
A., Weibel , A., et al
Barrufet , L., Oesch , P. A., Weibel , A., et al. 2023, , 522, 449
2023
-
[7]
Baum , W. A. 1959, , 71, 106
1959
-
[8]
F., McIntosh , D
Bell , E. F., McIntosh , D. H., Barden , M., et al. 2004 a , , 600, L11
2004
Show all 101 references
-
[9]
F., Wolf , C., Meisenheimer , K., et al
Bell , E. F., Wolf , C., Meisenheimer , K., et al. 2004 b , , 608, 752
2004
-
[10]
R., Hogg , D
Blanton , M. R., Hogg , D. W., Bahcall , N. A., et al. 2003, , 594, 186
2003
-
[11]
G., Lucey , J
Bower , R. G., Lucey , J. R., & Ellis , R. S. 1992, , 254, 601
1992
-
[12]
B., van Dokkum , P
Brammer , G. B., van Dokkum , P. G., & Coppi , P. 2008, , 686, 1503
2008
-
[13]
B., Whitaker , K
Brammer , G. B., Whitaker , K. E., van Dokkum , P. G., et al. 2011, , 739, 24
2011
-
[14]
B., Whitaker , K
Brammer , G. B., Whitaker , K. E., van Dokkum , P. G., et al. 2009, , 706, L173
2009
-
[15]
Brown , M. J. I., Dey , A., Jannuzi , B. T., et al. 2007, , 654, 858
2007
-
[16]
C., et al
Calzetti , D., Armus , L., Bohlin , R. C., et al. 2000, , 533, 682
2000
-
[17]
C., McLure , R
Carnall , A. C., McLure , R. J., Dunlop , J. S., & Dav \'e , R. 2018, , 480, 4379
2018
-
[18]
M., Chen , C.-C., Cowie , L
Casey , C. M., Chen , C.-C., Cowie , L. L., et al. 2013, , 436, 1919
2013
-
[19]
M., Kartaltepe , J
Casey , C. M., Kartaltepe , J. S., Drakos , N. E., et al. 2023, , 954, 31
2023
-
[20]
2003, , 115, 763
Chabrier , G. 2003, , 115, 763
2003
-
[21]
C., Windhorst , R., Odewahn , S., Yan , H., & Conselice , C
Chapman , S. C., Windhorst , R., Odewahn , S., Yan , H., & Conselice , C. 2003, , 599, 92
2003
-
[22]
& Fall , S
Charlot , S. & Fall , S. M. 2000, , 539, 718
2000
-
[23]
2018, , 861, 13
Chauke , P., van der Wel , A., Pacifici , C., et al. 2018, , 861, 13
2018
-
[24]
& Gunn , J
Conroy , C. & Gunn , J. E. 2010, , 712, 833
2010
-
[25]
E., & White , M
Conroy , C., Gunn , J. E., & White , M. 2009, , 699, 486
2009
-
[26]
R., Brammer , G., Heintz , K
Cooper , O. R., Brammer , G., Heintz , K. E., et al. 2025, , 982, 125
2025
-
[27]
Cox , D. P. 1983, , 265, L61
1983
-
[28]
J., Khochfar , S., et al
Cullen , F., McLure , R. J., Khochfar , S., et al. 2018, , 476, 3218
2018
-
[29]
2007, , 670, 156
Daddi , E., Dickinson , M., Morrison , G., et al. 2007, , 670, 156
2007
-
[30]
1961, , 5, 233
de Vaucouleurs , G. 1961, , 5, 233
1961
-
[31]
2000, , 531, 624
Dickinson , M., Hanley , C., Elston , R., et al. 2000, , 531, 624
2000
-
[32]
S., Cirasuolo , M., & McLure , R
Dunlop , J. S., Cirasuolo , M., & McLure , R. J. 2007, , 376, 1054
2007
-
[33]
S., McLure , R
Dunlop , J. S., McLure , R. J., Biggs , A. D., et al. 2017, , 466, 861
2017
-
[34]
S., Abraham , R
Dunlop , J. S., Abraham , R. G., Ashby , M. L. N., et al. 2021, PRIMER: Public Release IMaging for Extragalactic Research , JWST Proposal. Cycle 1, ID. \#1837
2021
-
[35]
J., Willott , C., Alberts , S., et al
Eisenstein , D. J., Willott , C., Alberts , S., et al. 2023, arXiv e-prints, arXiv:2306.02465
2023 arXiv
-
[36]
S., Smail , I., Dressler , A., et al
Ellis , R. S., Smail , I., Dressler , A., et al. 1997, , 483, 582
1997
-
[37]
P., Whitler , L., et al
Endsley , R., Stark , D. P., Whitler , L., et al. 2023, , 524, 2312
2023
-
[38]
M., Willmer , C
Faber , S. M., Willmer , C. N. A., Wolf , C., et al. 2007, , 665, 265
2007
-
[39]
J., Faber , S
Fang , J. J., Faber , S. M., Koo , D. C., et al. 2018, , 858, 100
2018
-
[40]
L., Bagley, M
Finkelstein, S. L., Bagley, M. B., Arrabal Haro, P., et al.\ 2025, , 983, 1, L4. doi:10.3847/2041-8213/adbbd3
2025 doi
-
[41]
L., Bagley , M
Finkelstein , S. L., Bagley , M. B., Ferguson , H. C., et al. 2023, , 946, L13
2023
-
[42]
2018, , 620, A152
Franco , M., Elbaz , D., B \'e thermin , M., et al. 2018, , 620, A152
2018
-
[43]
2003, , 587, L79
Franx , M., Labb \'e , I., Rudnick , G., et al. 2003, , 587, L79
2003
-
[44]
F., Zibetti , S., Brinchmann , J., & Kelson , D
Gallazzi , A., Bell , E. F., Zibetti , S., Brinchmann , J., & Kelson , D. D. 2014, , 788, 72
2014
-
[45]
2025, , 695, A90
Gebek , A., Diemer , B., Martorano , M., et al. 2025, , 695, A90
2025
-
[46]
D., L \'o pez-Cruz , O., Yee , H
Gladders , M. D., L \'o pez-Cruz , O., Yee , H. K. C., & Kodama , T. 1998, , 501, 571
1998
-
[47]
A., Kocevski , D
Grogin , N. A., Kocevski , D. D., Faber , S. M., et al. 2011, , 197, 35
2011
-
[48]
1950, Meddelanden fran Lunds Astronomiska Observatorium Serie II, 128, 5
Holmberg , E. 1950, Meddelanden fran Lunds Astronomiska Observatorium Serie II, 128, 5
1950
-
[49]
H., Serjeant , S., Dunlop , J., et al
Hughes , D. H., Serjeant , S., Dunlop , J., et al. 1998, , 394, 241
1998
-
[50]
2009, , 690, 1236
Ilbert , O., Capak , P., Salvato , M., et al. 2009, , 690, 1236
2009
-
[51]
2024, , 961, 118
Kaushal , Y., Nersesian , A., Bezanson , R., et al. 2024, , 961, 118
2024
-
[52]
2024, , 691, A52
Killi , M., Watson , D., Brammer , G., et al. 2024, , 691, A52
2024
-
[53]
M., Faber , S
Koekemoer , A. M., Faber , S. M., Ferguson , H. C., et al. 2011, , 197, 36
2011
-
[54]
G., Franx , M., & Illingworth , G
Kriek , M., van der Wel , A., van Dokkum , P. G., Franx , M., & Illingworth , G. D. 2008, , 682, 896
2008
-
[55]
2005, , 624, L81
Labb \'e , I., Huang , J., Franx , M., et al. 2005, , 624, L81
2005
-
[56]
2019, , 880, L9
Leja , J., Tacchella , S., & Conroy , C. 2019, , 880, L9
2019
-
[57]
S., McLure , R
Liu , F.-Y., Dunlop , J. S., McLure , R. J., et al. 2025, arXiv e-prints, arXiv:2503.07774
2025
-
[58]
Lonsdale , C., Polletta , M. d. C., Surace , J., et al. 2004, , 154, 54
2004
-
[59]
J., Persson , S
Lonsdale , C. J., Persson , S. E., & Matthews , K. 1984, , 287, 95
1984
-
[60]
E., et al
Lorenz , B., Kriek , M., Shapley , A. E., et al. 2024, , 975, 187
2024
-
[61]
2025, arXiv e-prints, arXiv:2504.15346
Maheson , G., Tacchella , S., Belli , S., et al. 2025, arXiv e-prints, arXiv:2504.15346
2025 arXiv
-
[62]
2014, , 794, 65
Marchesini , D., Muzzin , A., Stefanon , M., et al. 2014, , 794, 65
2014
-
[63]
2025, arXiv e-prints, arXiv:2503.01579
Martis , N., Withers , S., Felicioni , G., et al. 2025, arXiv e-prints, arXiv:2503.01579
2025 arXiv
-
[64]
S., Marchesini , D., Brammer , G
Martis , N. S., Marchesini , D., Brammer , G. B., et al. 2016, , 827, L25
2016
-
[65]
S., Marchesini , D
Martis , N. S., Marchesini , D. M., Muzzin , A., et al. 2019, , 882, 65
2019
-
[66]
2025, , 694, A76
Martorano , M., van der Wel , A., Baes , M., et al. 2025, , 694, A76
2025
-
[67]
J., Pentericci , L., Cimatti , A., et al
McLure , R. J., Pentericci , L., Cimatti , A., et al. 2018, , 479, 25
2018
-
[68]
2024, , 691, A240
Merlin , E., Santini , P., Paris , D., et al. 2024, , 691, A240
2024
-
[69]
G., Brammer , G
Momcheva , I. G., Brammer , G. B., van Dokkum , P. G., et al. 2016, , 225, 27
2016
-
[70]
2013, , 777, 18
Muzzin , A., Marchesini , D., Stefanon , M., et al. 2013, , 777, 18
2013
-
[71]
P., Finkelstein , S
Narayanan , D., Stark , D. P., Finkelstein , S. L., et al. 2025, , 982, 7
2025
-
[72]
R., et al
Nersesian , A., van der Wel , A., Gallazzi , A. R., et al. 2025, , 695, A86
2025
-
[73]
& Maechler , M
Ng , P. & Maechler , M. 2007, Statistical Modelling, 7, 315
2007
-
[74]
& Maechler , M
Ng , P. & Maechler , M. 2022, COBS -- Constrained B-splines (Sparse matrix based), r package version 1.3-5
2022
-
[75]
G., Weiner , B
Noeske , K. G., Weiner , B. J., Faber , S. M., et al. 2007, , 660, L43
2007
-
[76]
Oke , J. B. & Gunn , J. E. 1983, , 266, 713
1983
-
[77]
G., Mobasher , B., et al
Pacifici , C., Iyer , K. G., Mobasher , B., et al. 2023, , 944, 141
2023
-
[78]
1954, , 120, 413
Pettit , E. 1954, , 120, 413
1954
-
[79]
A., Meisenheimer , K., & Wolf , C
Phleps , S., Peacock , J. A., Meisenheimer , K., & Wolf , C. 2006, , 457, 145
2006
-
[80]
E., Sanders , R
Shapley , A. E., Sanders , R. L., Topping , M. W., et al. 2025, , 981, 167
2025
-
[81]
C., Setton, D
Siegel, J. C., Setton, D. J., Greene, J. E., et al.\ 2025, , 985, 1, 125. doi:10.3847/1538-4357/adc7b7
2025 doi
-
[82]
E., Whitaker , K
Skelton , R. E., Whitaker , K. E., Momcheva , I. G., et al. 2014, , 214, 24
2014
-
[83]
J., Blain , A
Smail , I., Ivison , R. J., Blain , A. W., & Kneib , J. P. 2002 a , , 331, 495
2002
-
[84]
N., Morrison , G
Smail , I., Owen , F. N., Morrison , G. E., et al. 2002 b , , 581, 844
2002
-
[85]
J., & Blain , A
Smail , I., Ivison , R. J., & Blain , A. W. 1997, , 490, L5
1997
-
[86]
T., Rowan-Robinson , M., Houck , J
Soifer , B. T., Rowan-Robinson , M., Houck , J. R., et al. 1984, , 278, L71
1984
-
[87]
A., Eisenhardt , P
Stanford , S. A., Eisenhardt , P. R., & Dickinson , M. 1998, , 492, 461
1998
-
[88]
M., F \"o rster Schreiber , N
Tacchella , S., Carollo , C. M., F \"o rster Schreiber , N. M., et al. 2018, , 859, 56
2018
-
[89]
J., Genzel , R., Saintonge , A., et al
Tacconi , L. J., Genzel , R., Saintonge , A., et al. 2018, , 853, 179
2018
-
[90]
Valentino , F., Brammer , G., Gould , K. M. L., et al. 2023, , 947, 20
2023
-
[91]
2021, , 256, 44
van der Wel , A., Bezanson , R., D'Eugenio , F., et al. 2021, , 256, 44
2021
-
[92]
G., et al
van der Wel , A., Franx , M., van Dokkum , P. G., et al. 2014, , 788, 28
2014
-
[93]
P., Zirm , A
van der Wel , A., Holden , B. P., Zirm , A. W., et al. 2008, , 688, 48
2008
-
[94]
van Dokkum , P. G. & Franx , M. 1996, , 281, 985
1996
-
[95]
G., Franx , M., Kriek , M., et al
van Dokkum , P. G., Franx , M., Kriek , M., et al. 2008, , 677, L5
2008
-
[96]
E., Franx , M., Leja , J., et al
Whitaker , K. E., Franx , M., Leja , J., et al. 2014, , 795, 104
2014
-
[97]
E., Labb \'e , I., van Dokkum , P
Whitaker , K. E., Labb \'e , I., van Dokkum , P. G., et al. 2011, , 735, 86
2011
-
[98]
E., Pope , A., Cybulski , R., et al
Whitaker , K. E., Pope , A., Cybulski , R., et al. 2017, , 850, 208
2017
-
[99]
J., Quadri , R
Williams , R. J., Quadri , R. F., Franx , M., van Dokkum , P., & Labb \'e , I. 2009, , 691, 1879
2009
-
[100]
2007, , 655, 51
Wuyts , S., Labb \'e , I., Franx , M., et al. 2007, , 655, 51
2007
-
[101]
E., et al
Zhang , J., Wuyts , S., Cutler , S. E., et al. 2023, , 524, 4128
2023
Reviewed August 6, 2026 · model on record in the stance chip above.
Discussion (0). Continue with ORCID to comment.