REVIEW 3 major objections 6 minor 2 references
Variability of Ha emission in young stellar objects in the cluster IC 348
T0 review · 3 major / 6 minor · reviewed 2026-08-14 · deepseek-v4-flash
Pith's one-line read Hα emission varies significantly in 90 of 127 young stars in IC 348.
desk verdict Useful new multi-epoch Hα catalog for IC 348, but the 90/127 variability count sits on noise-level thresholds and pooled heterogeneous data; treat the headline fraction as indicative, not secure. read the letter →
The pith
A machine-rendered reading of the paper's core claim, the machinery that carries it, and where it could break.
The reading
What carries the argument
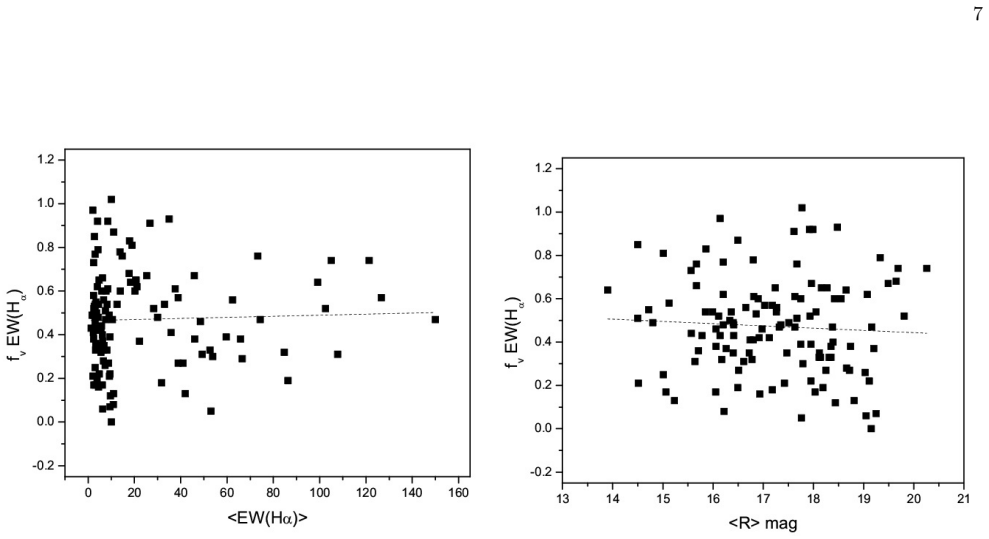
The load-bearing quantity is the variability fraction $f_v$, defined as the standard deviation of the EW(Hα) measurements divided by their mean, $f_v = \sqrt{(1/n)\sum_i ((x_i - \langle x\rangle)/\langle x\rangle)^2}$. The paper classifies a star as variable when $f_v$ exceeds 0.3 for bright stars ($R<17$ mag) or 0.4 for fainter stars, thresholds chosen relative to the stated measurement errors. This single statistic separates the sample into variable and non-variable groups, and the group comparison, together with the spectral-type-dependent boundary between classical and weak-line T Tauri stars, carries the argument that Hα variability tracks mass and activity.
What would settle it
Re-measure EW(Hα) for the same non-variable standard stars on the same nights with the same slit-less grism setup used for the multi-epoch subset, and compare the scatter with the published literature values; or recompute the variable fraction using only the four epochs from the same instrument. If the 90-of-127 variable count falls to the level expected from measurement noise, the variability classification collapses.
Extended reading notes
Core claim
The central discovery is that Hα variability is common and physically informative among the 127 cluster members studied. Significant variability of EW(Hα) was found in 90 stars, while 32 objects were consistently classical T Tauri stars, 69 were consistently weak-line T Tauri stars, and 20 objects changed their apparent evolutionary class between epochs; 6 stars showed Hα alternately in emission and absorption. Comparing X-ray, infrared, and accretion data, the paper finds that variable stars have higher mass accretion rates and X-ray activity than non-variables of the same age, and that they are noticeably more massive. Power-law fits give $\dot{M}_{\rm acc} \propto M_*^{1.51\pm0.28}$ for accreting objects and $\dot{M}_{\rm acc} \propto t^{-1.23\pm0.21}$ for most others, while the accretion rate of massive classical T Tauri variables stays nearly constant with age. The authors conclude that accretion activity decays more slowly in more massive young stars and that some class-changing objects are likely close binaries whose Hα emission is modulated by a companion.
Load-bearing premise
The classification of stars as variable or non-variable assumes that the scatter in EW(Hα) values measured with different telescopes, instruments, and epochs is dominated by the stars' own variability rather than by systematic offsets or calibration differences among the data sources.
Editorial extensions
If this is right
- Single-epoch Hα surveys will misclassify a substantial fraction of young stars: 90 of 127 stars in this sample are variable, and 20 change their apparent evolutionary class.
- Hα variability can serve as a low-cost indicator of stellar mass and activity in pre-main-sequence populations, not merely as a binary accreter/non-accreter label.
- Massive classical T Tauri stars keep accreting for longer, so samples selected purely by Hα emission are biased toward more massive and more active objects.
- Class-changing objects should be examined for close binarity, since unresolved companions may mimic evolutionary transitions between the T Tauri classes.
- The reported power-law relations for mass accretion rate versus stellar mass and versus age provide quantitative targets for comparisons with other star-forming regions.
Reading between the lines
- If the mass dependence of Hα variability holds across clusters, variability statistics could become a way to estimate the mass distribution of accreting populations without taking a spectrum of every star.
- The 20 class-changing objects may be a lower limit: unresolved binaries whose components are both weak-line emitters, or whose Hα is too faint to detect, would not be flagged by this method.
- A natural extension is to monitor Hα in IC 348 with a single stable instrument over a short, dense cadence, separating rotational spot modulation from long-term changes in accretion rate.
- The paper's binary explanation for class-changing objects implies that high-resolution imaging or radial-velocity monitoring of those 20 stars should reveal companions in a large fraction of cases.
Signed reviews
Editorial analysis
A structured set of objections, weighed in public.
Referee Report
Summary. The paper presents multi-epoch slit-less H-alpha spectroscopy of 127 members of the young cluster IC 348, obtained with the BAO 2.6 m telescope between 2009 and 2016 and combined with literature equivalent widths from Herbig (1998) and Luhman et al. (2003). The authors define a variability fraction fv as the standard deviation of EW(Halpha) divided by its mean, classify 90 of 127 stars as variable, identify 20 stars that change between CTT and WTT classes, and compare variable and non-variable samples in terms of optical, infrared, X-ray, mass, age, and mass accretion rate properties. They conclude that H-alpha variability is common in IC 348, that variables are more massive and more active than non-variables, and that accretion activity decays more slowly for more massive CTT objects.
Significance. If the variability classification is robust, the paper provides a valuable demonstration that single-epoch H-alpha classification of young stellar objects is unreliable for a substantial fraction of the population, and it connects H-alpha variability to stellar mass and activity. The multi-wavelength comparison is a strength, as is the use of two independent mass estimation methods (Siess et al. 2000 isochrones and Robitaille et al. 2007 SED fitting), and the authors are candid about model limitations in Section 3.2.4. However, the headline variability statistics currently rest on thresholds comparable to the stated measurement noise and on uncalibrated pooling of heterogeneous data, so the central claim is not yet established at the confidence claimed.
major comments (3)
- [3.1.1, Eq. (2)] The variability threshold is set at the level of the stated measurement errors: the paper reports average EW measurement errors of 30% for R<17 and 40% for fainter objects, and then defines variables as those with fv>0.3 or fv>0.4. With only two or three epochs per object, a non-variable star with 30-40% noise will frequently produce fv in this range purely from measurement error. The authors state that errors were 'taken into account' but provide no per-object significance test, no error propagation into fv, and no Monte Carlo null distribution. I request a quantitative demonstration that the 90/127 count exceeds the number expected from noise, for example by computing a significance level for each fv using the Vollmann & Eversberg uncertainties or by comparing the observed fv distribution with a noise-only simulation.
- [3.1.1, Table 2] The variable/non-variable classification pools BAO slit-less grism measurements from 2009/2010/2016 with EW(Halpha) values from Herbig (1998) and Luhman et al. (2003), which were obtained with different telescopes, spectral resolutions, filters, and extraction methods. No cross-instrument zero-point check is presented. Under Eq. (2), a constant multiplicative offset between two systems inflates fv for any object observed in both, and an additive offset can also produce spurious CTT/WTT class changes, especially for weak-line objects with EW~2-10 A. Because the 90/127 count, the CW sample, and the emission/absorption transients all depend on this pooled fv, the authors should either demonstrate zero-point consistency using objects observed in both systems, restrict the variability analysis to the homogeneous BAO epochs, or include an inter-instrument systematic term in the error budget.
- [3.2.4, Figs. 8-9 and Table 3] The Macc-M* and Macc-age correlations are derived from parameters that all emerge from the same Robitaille et al. (2007) SED fits using the same photometry, so the correlations may be partly induced by the fitting procedure, the model grid, or degeneracies between Macc, M*, and age. The paper compares the slope with Venuti et al. (2014), but it does not validate the relation against independent accretion-rate indicators (e.g., U-band or line-luminosity based estimates). In addition, the mass differences between variables and non-variables in Table 3 have standard deviations comparable to the differences themselves; no two-sample test or bootstrap confidence interval is given, so the statement that variables are 'noticeably more massive' requires a statistical significance assessment.
minor comments (6)
- [3.1.1, Eq. (2)] Equation (2) is typeset incorrectly in the manuscript (the radical notation is corrupted), and the definition should be written explicitly as fv = sqrt((1/n) sum((xi - xbar)^2)) / xbar, with a clear statement of whether the sample or population standard deviation is used.
- [Table 2] Table 2 is extremely difficult to read: the column headers for the different epochs are not clearly separated, and several rows contain more entries than headers. The table should be restructured, ideally as a machine-readable table with one row per object and one column per epoch.
- [Table 3] In Table 3, the row for 'fv of EW(Halpha)' lists only three values although the table has six sample columns; entries for non-variable CC, non-variable WW, and WAbs samples are missing. Please provide values or mark them as not applicable.
- [3.1.1] The sentence defining the variability threshold is ambiguous: 'objects with <R> brighter than 17.0mag, for which fv > 0.3, as well as the objects with <R> fainter than 17.0mag, for which fv > 0.4' should state whether the boundary at R=17.0 belongs to the bright or faint group.
- [3.2.4] The comparison with Dahm (2008) accretion rates is useful, but the sentence 'the log M values given in Dahm (2008) exceed our data ~1.5 times' should state clearly whether this is a factor of ~1.5 in linear units or an offset of ~0.18 dex, and the direction of the discrepancy should be specified relative to each object.
- [Data availability] Tables 2, 4, and 5 contain the core data products of the paper, but no machine-readable versions are provided. For a study whose main result is a catalog of variable objects, electronic tables are essential for reproducibility and community use.
Circularity Check
No significant circularity: the central variability classification and mass/activity comparisons rest on independent inputs, and the SED-based correlations are model-dependent but not definitionally tied to the Hα variability claim.
full rationale
The paper's central load-bearing claim is that 90 of 127 IC 348 stars show significant EW(Hα) variability, that CTT/WTT variables are more massive and more active than non-variables, and that Macc correlates with M* and anti-correlates with age. Walking the derivation chain, the variability classification is a direct summary of multi-epoch EW(Hα) measurements via Eq. (2); it is not derived from mass, age, or accretion-rate inputs. The mass and age estimates come from two independent methods (Siess isochrones and Robitaille SED fitting) whose inputs are Teff/luminosity and optical-to-mid-IR photometry, not the Hα EW values or the fv classification. The Macc versus M* and Macc versus age relations are both obtained from the Robitaille SED fitting outputs, so they share a common model grid and can be affected by degeneracies; however, the paper does not define Macc as a function of M* or age by construction, and the Hα variability selection is not an input to those fits. The self-citation to Nikoghosyan et al. (2015) is used only for supporting statistics about emission-line fractions and previous classification discrepancies; it is not load-bearing for the new variability or mass conclusions, and no uniqueness theorem or ansatz is imported from the authors' prior work. The heterogeneous provenance of the EW measurements (BAO grism plus Herbig and Luhman literature values) is a legitimate systematic-error concern, because a cross-instrument zero-point offset could inflate fv and affect the 90/127 count, but that is a measurement-robustness issue rather than a circularity: the variable count is not equivalent to any fitted parameter or to the mass/activity results by definition. Overall, the derivation is self-contained; the main caveats are model dependence and heterogeneous data, not circular reasoning.
Assumptions & free parameters
free parameters (2)
- fv variability threshold =
0.3 for R<17 mag; 0.4 for R>=17 mag
- SED fitting photometric uncertainty inflation =
10% added to each photometric band
assumptions (4)
- domain assumption The spectral-type-dependent EW(Hα) boundary of White & Basri (2003) separates CTT from WTT objects.
- domain assumption The Vollmann & Eversberg (2006) formula gives valid EW uncertainties for these spectra.
- domain assumption EW measurements from different telescopes, instruments, and epochs are directly comparable.
- domain assumption Siess et al. (2000) isochrones and Robitaille et al. (2007) SED models describe the IC 348 population.
Cite this review
Pith. "Pith review of Variability of Ha emission in young stellar objects in the cluster IC 348." pith.science (2026). https://pith.science/paper/F25CQW2G
@misc{pith2026190807987,
  author       = {Pith},
  title        = {Pith review of: Variability of Ha emission in young stellar objects in the cluster IC 348},
  year         = {2026},
  howpublished = {\url{https://pith.science/paper/F25CQW2G}},
  note         = {Machine review of arXiv:1908.07987}
}
read the original abstract
The aim of this work is to identify and study the stellar objects with variable EW(Ha) in the young stellar cluster IC 348. We performed photometric and slit-less observations at several epochs in order to reveal the variable objects. Significant variability of EW(Ha) was found in 90 out of 127 examined stars. From all epochs of observations, 32 objects were classified as CTT and 69 as WTT objects. The fraction of the variables in these samples is about 60%. We also identified 20 stellar objects, which showed not only a significant variability of the equivalent width, but which also change their apparent evolutionary stage. The analysis of data obtained over a wide wavelength range (from X-ray to mid-infrared) has shown that Ha activity and the measure of its variability are in good agreement with the activity of stellar objects measured with its other parameters, such as X-ray radiation and the mass accretion rate. The EW(Ha) differs not only between objects at different evolutionary stages, but also between variable and non-variable objects. The variables in the CTT and WTT samples are more active than non-variables although they have almost the same evolutionary age. Another distinct difference between these variables and non-variables is their average masses. The variables from both CTT and WTT samples are noticeably more massive than non-variables. Our data confirm the assumption made for other star formation regions, that the decay of accretion activity occurs more slowly for more massive CTT objects. Apparently, a similar trend is also present in WTT objects, which are at a later stage of evolution. The variability of the stellar objects, which change their evolutionary classes, at least in a fraction of them, is due to the fact that they are close binaries, which affects and modulates their Ha emission activity.
Figures

Figures from the paper (6 more)


Reference graph
Works this paper leans on
-
[1]
Bessell M. S., Brett J. M., 1988, PASP, 100, 1134 Bouvier J., Grankin K., Ellerbroek L. E., Bouy H., Bar- rado D., 2013, A&A, 557, 77 Carpenter J. M., 2001, AJ, 121, 2851 Cieza L., Baliber N., 2006, ApJ, 649, 862 Cieza L. A., et al., 2013, ApJ, 762, 100 Cohen R. E., Herbst W., Williams E. C., 2004, AJ, 127, 1602 Costigan G., Vink J. S., Scholz A., Ray T.,...
work page 1988
-
[4]
Edited by Bo Reipurth. p. 372 Hillenbrand L. A., 1997, AJ, 113, 1733 Koenigl A., 1991, ApJ, 370, L39 Lada C. J., Lada E. A., 2003, ARA&A, 41, 57 Lada C. J., et al., 2006, AJ, 131, 1574 Luhman K. L., 1999, ApJ, 525, 466 Luhman K. L., Stauffer J. R., Muench A. A., Rieke G. H., Lada E. A., Bouvier J., Lada C. J., 2003, ApJ, 593, 1093 Manara C. F., Robberto M....
work page 1997
Reviewed August 14, 2026 · model on record in the stance chip above.
Discussion (0). Continue with ORCID to comment.