REVIEW 4 major objections 6 minor 41 references
Multiple Stellar Populations of Globular Clusters from Homogeneous Ca--CN--CH Photometry. V. $cn^\prime_{\rm JWL}$ as a Surrogate $cn_{\rm JWL}$ Index and NGC 6723
T0 review · 4 major / 6 minor · reviewed 2026-08-14 · deepseek-v4-flash
Pith's one-line read This paper introduces a surrogate CN photometric index, cn′JWL, and uses it to show that NGC 6723's two red-giant populations share the same radial distribution — overturning a claimed counterexample to globular-cluster…
desk verdict A useful photometric-tool paper whose refutation of Lim et al. on NGC 6723 is probably correct but statistically oversold. read the letter →
The pith
A machine-rendered reading of the paper's core claim, the machinery that carries it, and where it could break.
The reading
What carries the argument
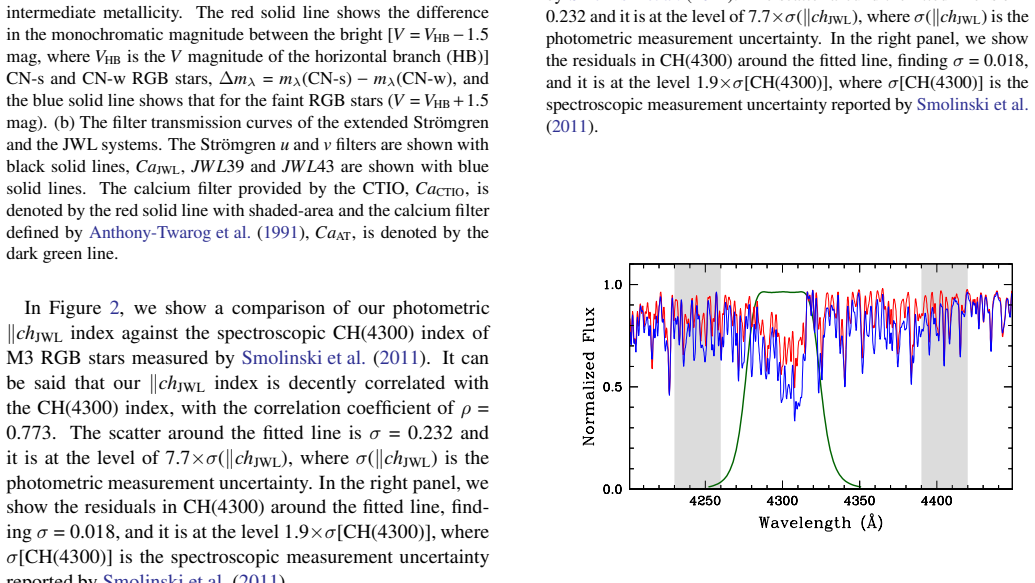
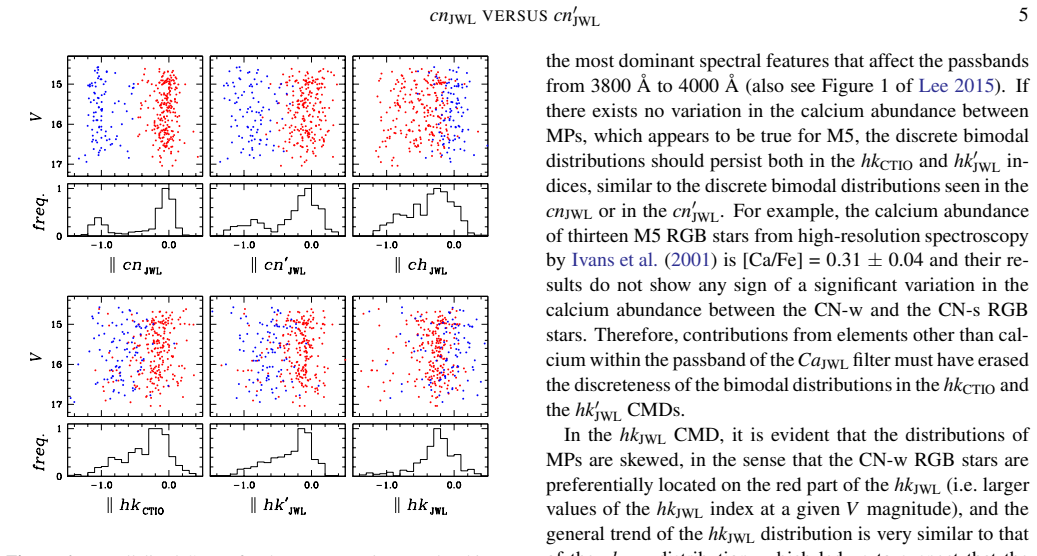
The load-bearing instrument is the photometric index $cn'_{\rm JWL} = Ca_{\rm CTIO} - Ca_{\rm JWL}$. Because the CTIO calcium filter's passband has aged into a shape close to the custom JWL39 filter, this difference reproduces the information in $cn_{\rm JWL} = JWL39 - Ca_{\rm JWL}$, making accurate CN-band ($\lambda3883$) tagging possible without the custom filter. Its partner, $ch_{\rm JWL} = (JWL43 - b) - (b - y)$, measures the CH G band at $\lambda4250$, and the parallelized indices $\|cn_{\rm JWL}$ and $\|cn'_{\rm JWL}$ (sequences aligned to red and blue RGB fiducials) perform the actual population separation. Classification uses an expectation-maximization two-component Gaussian mixture, membership comes from Gaia DR2 proper motions, and completeness is estimated from artificial-star experiments. Synthetic spectra from ATLAS12/SYNTHE and MOOG are used to check whether abundance differences can account for the observed RGB and AGB colors.
What would settle it
Reclassify NGC 6723 giants using cn′JWL photometry but with membership and completeness from HST proper motions, which cover the cluster center where Gaia DR2 is incomplete; if the CN-w population then appears more centrally concentrated than CN-s, the paper's refutation of the earlier counterexample fails. A cheaper check is high-resolution spectroscopy of stars tagged CN-w in the inner region: if their measured CN strengths disagree with the photometric tags, cn′JWL is not a reliable population tracer.
Extended reading notes
Core claim
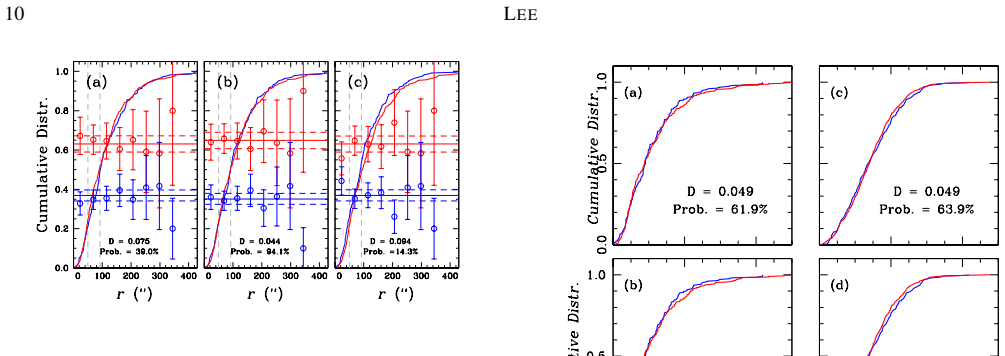
On its own terms, the paper's central discovery is that the color difference $cn'_{\rm JWL} = Ca_{\rm CTIO} - Ca_{\rm JWL}$ is a reliable surrogate for the previously validated CN-band index $cn_{\rm JWL} = JWL39 - Ca_{\rm JWL}$, and that this index, combined with a new CH measure $ch_{\rm JWL} = (JWL43 - b) - (b - y)$, cleanly separates the multiple populations of NGC 6723. For Gaia DR2 proper-motion members, the two RGB populations are classified with an expectation-maximization two-component Gaussian mixture, giving $n({\rm CN\text{-}w}):n({\rm CN\text{-}s}) = 35.5:64.5 \pm 2.8$; their cumulative radial distributions are statistically indistinguishable. That result contradicts the earlier claim of a centrally concentrated CN-w population, which the paper traces to misclassification by the $hk_{\rm CTIO}$ index, a poor CN tracer with weak CH contamination. The same data show discrete double AGB sequences, a CN-s RGB bump brighter by $0.031 \pm 0.030$ mag (translating to $\Delta Y = 0.012 \pm 0.012$), and a step-like photometric CN--CH anticorrelation in M5. Synthetic spectra reproduce the RGB sequences but not the CN-w AGB, suggesting a mild nitrogen enhancement or a large drop in $^{12}$C/$^{13}$C in those AGB stars.
Load-bearing premise
The load-bearing premise is that Gaia DR2 proper-motion membership and the artificial-star completeness corrections do not remove CN-w and CN-s stars at different rates as a function of radius; if the cluster center is incomplete in a population-dependent way, the observed identical radial distributions could be a sample artifact rather than a property of the cluster.
Editorial extensions
If this is right
- The NGC 6723 reversed radial distribution claimed in the 2016 study disappears when stars are tagged with a clean CN index, so this cluster no longer counts as an observational counterexample to standard multiple-population formation.
- The measured RGB ratio of 35.5:64.5 agrees with the independent HST-based first-generation fraction of 0.363 ± 0.017, supporting a flat population ratio that does not change with radius.
- The CN-s RGB bump is brighter by 0.031 ± 0.030 mag, implying a modest helium enhancement of ΔY = 0.012 ± 0.012 for the later generation.
- The cnJWL and cn′JWL CMDs reveal discrete double AGB populations, and the bright AGB number ratio is marginally consistent with the RGB ratio; the deficit of faint CN-s AGB stars suggests helium-enhanced stars may evolve as AGB-manqué.
- Because cn′JWL requires only the existing CTIO calcium filter, archival photometry of other globular clusters can be re-analyzed with the same population-tagging procedure.
Reading between the lines
- If the surrogate index passes independent validation, archival CaCTIO photometry of many clusters could be re-processed in the same way, turning claimed radial-segregation anomalies into a systematic survey without new observations.
- The step-like photometric CN–CH relation in M5 suggests that the continuous abundance spreads reported in high-resolution Na–O studies may partly reflect measurement scatter; a joint photometric–spectroscopic analysis could test whether the underlying populations are genuinely discrete.
- The RGB/AGB mismatch in synthetic colors points to phase-dependent abundance changes in first-generation stars that can be tested directly with high-resolution spectra of a handful of CN-w AGB stars in NGC 6723.
- A center-complete reobservation with HST proper motions would decide whether Gaia DR2 incompleteness hid a real gradient; if the null result survives, other radial-segregation claims should be rechecked with the same index.
Signed reviews
Editorial analysis
A structured set of objections, weighed in public.
Referee Report
Summary. This paper, the fifth in the author's series on homogeneous Ca-CN-CH photometry, introduces two new photometric indices, cn'_JWL = Ca_CTIO - Ca_JWL and ch_JWL = (JWL43 - b) - (b - y), intended as accurate measures of the CN lambda 3883 band and the CH G band. Using M5 RGB stars, the author shows that ||cn'_JWL correlates well with ||cn_JWL (rho = 0.918) and that the photometric CN-CH relation between the CN-w and CN-s populations is step-like rather than continuous. Applying the indices to NGC 6723, the paper reports an RGB number ratio n(CN-w):n(CN-s) = 35.5:64.5 +/- 2.8, no radial gradient between the two RGB populations (contradicting Lim et al. 2016), Delta Y = 0.012 +/- 0.012 for the CN-s population from the RGB bump, and discrete double AGB populations whose bright-star ratio is marginally consistent with the RGB ratio. Synthetic spectra reproduce the RGB sequences but leave a 0.035 mag discrepancy for the CN-w AGB, which is attributed to a possible mild nitrogen enhancement and/or a large 12C/13C decrement.
Significance. If the no-radial-gradient result holds, the paper removes an important claimed counterexample to the standard formation scenario for globular-cluster multiple populations and demonstrates that a ground-based Ca-CN-CH system can tag populations reliably. The paper's strengths include agreement of the RGB ratio with the independent HST measurement of Milone et al. (2017), consistency with the Milone et al. (2018) helium estimate, and an explicit, transparent discussion of the limitations of the completeness correction and of the adopted CNO abundances. The central refutation of Lim et al. (2016), however, rests on a Monte Carlo calibration that is internally inconsistent and on a completeness treatment that is not population-specific, so the quantitative support for the headline claim is currently weaker than the text states.
major comments (4)
- [Section 6.3.2, Table 4] The calibration of the Monte Carlo test is internally inconsistent. Under the null hypothesis, a two-sample K-S p-value is uniform on [0,1], so P(p <= 0.002) should be 0.2%. The 'Empirical' entry of 4.46% is more than twenty times larger, while 'Empirical1' and 'Gaussian' give 0.18% and 0.20%. This indicates that the empirical simulation does not sample a correctly pooled null distribution, so the statement in Section 7 that Lim et al.'s result has less than 5% probability and is 'highly improbable' is not supported by the reported numbers. Please report the actual K-S statistics and p-values for the comparisons in Figure 13 and rerun the randomization under a properly defined null hypothesis.
- [Section 6.3.2, Figure 13] The text states that K-S tests show the CN-w and CN-s populations are most likely drawn from the same parent distribution, but no test statistic or p-value is reported for any of the three color indices. The reader cannot distinguish p approximately 0.04 from p approximately 0.4, which matters because the paper's central claim is the absence of radial segregation. Please tabulate D and p for ||cn_JWL, ||cn'_JWL, and ||hk_CTIO, together with sample sizes and the radial ranges used.
- [Sections 6.1 and 6.3.2] The completeness correction used to argue that incomplete detection cannot hide a radial gradient is not population-specific. The artificial-star completeness fractions f_complete are computed for the full sample, while the relevant question is whether CN-w and CN-s stars are detected and retained at different rates as a function of radius in this bulge-contaminated field (l = 0.07 deg, b = -17.30 deg) with Gaia DR2 proper-motion membership incomplete in the center. The paper itself notes that applying f_complete to the observed radial distributions is not exactly correct and that the inverse process is delicate. Please test the pipeline's ability to recover an artificially injected reversed gradient of the kind claimed by Lim et al. (2016), or provide per-population completeness and membership-retention curves with radial uncertainties.
- [Section 6.4.1, Figure 16] The inferred need for extra nitrogen enhancement and/or a large 12C/13C decrement in the CN-w AGB is conditional on adopting the CNO abundances of M5 for NGC 6723 and on the specific ATLAS12/SYNTHE model assumptions. Since no CNO abundances for NGC 6723 are available, the 0.035 mag discrepancy could instead reflect incorrect input abundances, model atmospheres, or the adopted isochrones. The abstract states this as a result; please either soften the claim to a model-dependent speculation or obtain spectroscopic CNO constraints for at least a few NGC 6723 giants.
minor comments (6)
- [Section 1] The phrase 'one of the most greatest achievements' contains a grammatical error; it should be 'one of the greatest achievements'.
- [Figure 14 caption] The fourth panel is labeled '(c)' twice; the label for the final panel should be '(d)'.
- [Figure 14 caption] 'Mote Carlo simulations' should be 'Monte Carlo simulations'.
- [Section 4] 'the second Gaia date release' should be 'the second Gaia data release'.
- [Section 6.4.1] The text adopts [Fe/H] approximately -1.0 dex but the footnote gives [Fe/H] = -0.93 +/- 0.05 from Crestani et al. (2019); please state explicitly which value is used in the synthetic models and whether the difference affects the conclusions.
- [References] The in-text citation 'Zachairias et al. (2004)' is misspelled; it should be 'Zacharias et al. (2004)' to match the reference list.
Circularity Check
No significant circularity found; the index validation rests on external spectroscopic benchmarks and the central radial-distribution claim is data-driven rather than definitional.
full rationale
The paper's derivation chain is not circular. The new cn'JWL index is introduced as an empirical surrogate for cnJWL, and the correlation between them (Table 1, rho = 0.918) is a validation, not a derivation of a predicted quantity from the same input. The underlying cnJWL index is independently anchored to the external spectroscopic delta-S(3839) index of Smolinski et al. (2011) with rho = 0.981, and chJWL is compared with the external CH(4300) index. The RGB population ratio in NGC 6723, n(CN-w):n(CN-s) = 35.5:64.5 +/- 2.8, is checked against the independent HST measurement of Milone et al. (2017), who found an FG fraction of 0.363 +/- 0.017. The helium enhancement estimate is derived from the standard RGB-bump luminosity method and agrees with an external HST result. The synthetic spectra for the AGB discrepancy use ATLAS12, SYNTHE, MOOG, Dartmouth isochrones, and abundances adopted from Cohen et al. (2002); they are not fitted to the CN-w AGB discrepancy but are used to propose falsifiable abundance variations. The central claim of identical cumulative radial distributions for the two populations is an empirical result from Gaia DR2 membership and the paper's photometry, not a consequence of how the indices are defined. Concerns about Gaia completeness in the cluster center, the approximate inverse completeness correction, and the Monte Carlo result P = 4.46% in Table 4 are statistical and observational robustness issues rather than circular reductions; the paper even states that its completeness correction is not exactly correct. Self-citations to earlier Lee papers are present, but the load-bearing calibrations and comparisons are external, so no circular step is established by the quoted equations or construction.
Assumptions & free parameters
free parameters (5)
- Adopted CNO abundances for NGC 6723 populations (from M5) =
[C/Fe]=-0.2, [N/Fe]=-0.1, [O/Fe]=+0.3 (CN-w); [C/Fe]=-0.8, [N/Fe]=+1.3, [O/Fe]=-0.2 (CN-s)
- Nitrogen enhancement for CN-w AGB =
Delta[N/Fe] = 0.1 dex
- Carbon isotope ratio for CN-w AGB =
12C/13C approximately 2.3 (from initial approximately 20)
- Gaussian mixture model parameters for population classification =
Means, variances, and mixing fraction fitted by EM
- Parallelization fiducial sequences (CIred, CIblue) =
Not tabulated, defined per cluster by eye or fit
assumptions (5)
- domain assumption CN band at lambda 3883 is primarily a nitrogen tracer and CH G band at lambda 4250 a carbon tracer in cool giants.
- domain assumption Two-component Gaussian mixture correctly describes the population distribution in the parallelized indices.
- domain assumption The RGB bump luminosity difference between populations is caused only by helium, with no age or metallicity differences.
- domain assumption ATLAS12, SYNTHE, MOOG, and Dartmouth isochrones accurately model the relevant stellar atmospheres and evolution for RGB and AGB stars.
- domain assumption Gaia DR2 proper-motion membership and completeness corrections are adequate for the radial distribution comparison.
Cite this review
Pith. "Pith review of Multiple Stellar Populations of Globular Clusters from Homogeneous Ca--CN--CH Photometry. V. $cn^\prime_{\rm JWL}$ as a Surrogate $cn_{\rm JWL}$ Index and NGC 6723." pith.science (2026). https://pith.science/paper/F4OYKQC7
@misc{pith2026190806670,
  author       = {Pith},
  title        = {Pith review of: Multiple Stellar Populations of Globular Clusters from Homogeneous Ca--CN--CH Photometry. V. $cn^\prime_\rm JWL$ as a Surrogate $cn_\rm JWL$ Index and NGC 6723},
  year         = {2026},
  howpublished = {\url{https://pith.science/paper/F4OYKQC7}},
  note         = {Machine review of arXiv:1908.06670}
}
abstract
We introduce new color indices $cn^\prime_{\rm JWL}$ (= $Ca_{\rm CTIO} - Ca_{\rm JWL}$) and $ch_{\rm JWL}$ [=$(JWL43 - b) - (b-y)$], accurate photometric measures of the CN band at $\lambda$3883 and the CH G band, respectively, in the study of the multiple populations (MPs) in globular clusters (GCs). Our photometric CN--CH relation for a large number of red-giant branch (RGB) in M5 shows that the evolutions of the CN and CH between the CN-w and CN-s populations are not continuous. Armed with our new color indices, we investigate the MPs of NGC 6723, finding the RGB populational number ratio of $n$(CN-w):$n$(CN-s) $\approx$ 35.5:64.5 ($\pm$2.8) with no radial gradient. Similar to other normal GCs with MPs, the helium abundance of the CN-s population inferred from the RGB bump magnitude is slightly enhanced by $\Delta Y$ = 0.012 $\pm$ 0.012. Our $cn_{\rm JWL}$ and $cn^\prime_{\rm JWL}$ color-magnitude diagrams clearly show the discrete double AGB populations in NGC 6723, whose bright AGB populational number ratio is in marginally agreement with that of the RGB stars within the statistical errors. Finally, our synthetic $cn_{\rm JWL}$ index is in good agreement with observations, except for the CN-w asymptotic giant branch (AGB). To mitigate the discrepancy in the CN-w AGB may require a mild nitrogen enhancement and/or a large decrement in the $^{12}$C/$^{13}$C ratio with respect to the bright RGB.
Figures


Figures from the paper (8 more)




Reference graph
Works this paper leans on
-
[1]
Anthony-Twarog, B. J., Laird, J. N., Payne, D., & Twarog, B. A . 1991, AJ, 101, 1902
work page 1991
-
[2]
Bastian, N., Kamann, S., Cabrera-Ziri, I., et al. 2019, MNRA S, 480, 3739
work page 2019
-
[3]
2019, MNRAS, 482, 5138
Baumgardt, H., Hilker, M., Sollima, A., & Bellini, A. 2019, MNRAS, 482, 5138
2019
- [4]
-
[5]
Briley, M. M., Smith, G. H., Bell, R. A., Oke, J. B., & Hesser, J . E. 1992, ApJ, 387, 612
work page 1992
-
[6]
Brown, A.G.A., V allenari, A., Prusti, T. et al. 2018, A&A, 616, A1
work page 2018
-
[7]
Campbell, S. W., D’Orazi, V ., Y ong, D. et al. 2013, Nature, 498, 198
work page 2013
-
[8]
2014, ApJL, 795, L28 Carretta E., Bragaglia, A., Gratton, R.G., Lucatello S., Ca ntanzaro G
Carretta, E. 2014, ApJL, 795, L28 Carretta E., Bragaglia, A., Gratton, R.G., Lucatello S., Ca ntanzaro G. et al. 2009, A&A, 505, 117
work page 2014
Show all 41 references
-
[9]
2013, Old Stellar Populations: ho w to study the fossil record of galaxy formation (Berlin:Wiley- VCH)
Cassisi, S., & Salaris, M. 2013, Old Stellar Populations: ho w to study the fossil record of galaxy formation (Berlin:Wiley- VCH)
2013
-
[10]
2005, Mem
Castelli, F. 2005, Mem. S.A.It. Suppl. 8, 25
2005
-
[11]
G., Briley, M
Cohen, J. G., Briley, M. M., Stetson, P . B. 2002, AJ, 123, 2525
2002
-
[12]
Crestani, J., Alves-Brito, A., Bono, G. et al. 2019, MNRAS, 4 87, 5463
2019
-
[13]
Dotter, A., Chaboyer, B., Jevremovi ´c, D. et al. 2008, ApJS, 178, 89
2008
-
[14]
K., & Avrett, E
Dupree, A. K., & Avrett, E. H. 2013, ApJL, 773, L28
2013
-
[15]
R., Lucatello, S., Sollima A
Gratton, G. R., Lucatello, S., Sollima A. et al. 2015, A&A, 57 3, A92 cnJWL VERSUS cn′ JWL 15
2015
-
[16]
Andersen, M. I. 1999, ApJ, 524, 242
1999
-
[17]
Harris, W. E. 1996, AJ, 112, 1487
1996
-
[18]
I., Kraft, R
Ivans, I. I., Kraft, R. P ., Sneden, C. et al. 2001, AJ, 122, 143 8
2001
-
[19]
1970, SAOSR, 309, 291
Kurucz, R., L. 1970, SAOSR, 309, 291
1970
-
[20]
2005, Mem
Kurucz, R., L. 2005, Mem. S.A.It. Suppl. 8, 14
2005
-
[21]
P ., Milone, A
Lagioia, E. P ., Milone, A. P ., Marino, A. F., et al. 2018, MNRAS, 475, 4088
2018
-
[22]
2010, MNRAS, 405, L36
Lee, J.-W. 2010, MNRAS, 405, L36
2010
-
[23]
2016, ApJS, 226, 16
Lee, J.-W. 2016, ApJS, 226, 16
2016
-
[24]
2018, ApJS, 238, 24
Lee, J.-W. 2018, ApJS, 238, 24
2018
-
[25]
Lee, J.-W., & Carney, B. W. 1999, AJ, 117, 2868
1999
-
[26]
Lee, J.-W., López-Morales, M., Hong, K. et al. 2014, ApJS, 21 0, 6
2014
-
[27]
2016, JKAS, 49, 289
Lee, J.-W., & Pogge, R. 2016, JKAS, 49, 289
2016
-
[28]
Lim, D., Lee, Y .-W., Pasquato, M. et al. 2016, ApJ, 832, 99
2016
-
[29]
F., Milone, A
Marino, A. F., Milone, A. P ., Casagrande, L., et al. 2018, ApJ L, 863, L33
2018
-
[30]
F., Milone, A
Marino, A. F., Milone, A. P ., Y ong, D., et al. 2017, ApJ, 843, 66
2017
-
[31]
F., Villanova, S., Piotto, G
Marino, A. F., Villanova, S., Piotto, G. et al. 2008, AAS Meet ing Abstracts, 490, 625
2008
-
[32]
P ., Marino., A
Milone, A. P ., Marino., A. F., Mastrobuono-Battisti, A., & Lagioia, E. P . 2018, MNRAS, 479, 5005
2018
-
[33]
P ., Marino, A
Milone, A. P ., Marino, A. F., Piotto, G. et al. 2015, ApJ, 808, 51
2015
-
[34]
P ., Piotto, G., Renzini, A
Milone, A. P ., Piotto, G., Renzini, A. et al. 2017, MNRAS, 464 , 3636
2017
-
[35]
L., Freeman, K
Norris, J., Cottrell, P . L., Freeman, K. C., & Da Costa, G. S. 1 981, ApJ, 244, 205 Piotto. G., Milone, A. P ., Bedin, L. R. et al. 2015, AJ, 149, 91
2015
-
[36]
Sbordone, L., Bonifacio, P ., Castelli, F., & Kurucz, R. L. 2004, Mem. S.A.It. Suppl. 5, 93
2004
-
[37]
Smith, G. H. 1987, PASP, 99, 67
1987
-
[38]
P ., Martell, S., Beers, T
Smolinski, J. P ., Martell, S., Beers, T. C., et al. 2011, ApJ, 142, 126
2011
-
[39]
1973, ApJ, 184, 839
Sneden, C. 1973, ApJ, 184, 839
1973
-
[40]
I., & Kraft, R
Sneden, C., Ivans, I. I., & Kraft, R. P . 2000, Mem. Soc. Astron. Italiana, 71, 657 Stetson P . B. 1987, PASP, 99, 191 Stetson P . B. 1994, PASP, 106, 250 Stetson P . B., & Harris, W. E. 1988, AJ, 96, 909
2000
-
[41]
G., Levine, S
Zacharias, N., Monet, D. G., Levine, S. E., et al. 2004, AAS, 2 05, 4815
2004
Reviewed August 14, 2026 · model on record in the stance chip above.
Discussion (0). Continue with ORCID to comment.