REVIEW 2 major objections 5 minor 12 references
ANTARES and IceCube combined search for neutrino point-like and extended sources in the Southern Sky
T0 review · 2 major / 5 minor · reviewed 2026-08-14 · deepseek-v4-flash
Pith's one-line read Combining ANTARES and IceCube data improves Southern-Sky neutrino-source sensitivity by a factor of about two, yet the analysis finds no significant source.
desk verdict First combined ANTARES+IceCube Southern-sky search: a clean null result with a plausible factor-two sensitivity gain, delivered as an honest but notationally sloppy proceedings. read the letter →
The pith
A machine-rendered reading of the paper's core claim, the machinery that carries it, and where it could break.
The reading
What carries the argument
The engine of the analysis is a joint unbinned maximum-likelihood fit over seven event samples: ANTARES tracks and showers plus the IceCube runs IC40, IC59, IC79, and IC86. The likelihood multiplies, for each sample and event, a weighted mixture of signal and background probability density functions, each formed as a product of a spatial and an energy term. For IceCube the spatial signal PDF is a two-dimensional Gaussian with effective width $\sigma_{\mathrm{eff}} = \sqrt{\sigma^2 + \sigma_s^2}$; for ANTARES it is a Monte-Carlo-derived point-spread function, with $\sigma_s$ encoding a Gaussian source extension. The test statistic $Q = \log L(\hat{n}_s, \hat{\gamma}) - \log L(n_s = 0)$ is scanned over the sky in $1^\circ \times 1^\circ$ bins. Trial-corrected p-values come from comparing the observed $Q$ with the distribution obtained from background-only pseudo-experiments in which event times are randomized to destroy clustering.
What would settle it
Re-run the identical pipeline on pseudo-experiments that randomize event directions rather than event times; if the tail of the resulting test-statistic distribution is heavier than the time-randomized one, the reported post-trial p-values (0.18 full-sky, 0.03 Galactic Centre) would overstate the significance of the observed excesses. A complementary check is to inject a simulated $E^{-2}$ point-source flux at the level of a reported 90% upper limit at a random Southern-Sky position and verify that the analysis recovers it at the claimed sensitivity.
Extended reading notes
Core claim
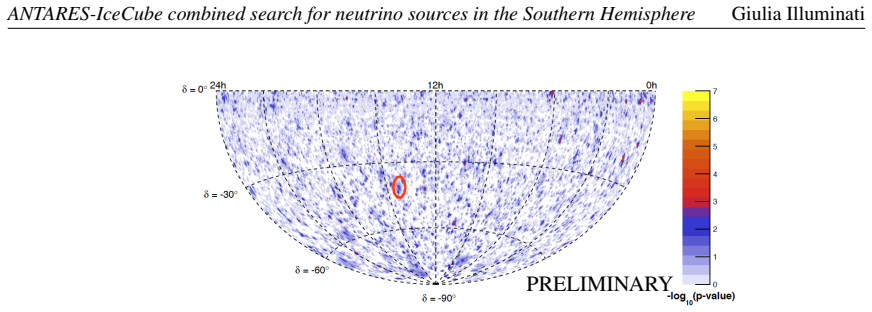
On the paper's own terms, the central result is a null result obtained with an improved tool: none of the five searches—the full Southern-Sky scan, a list of 57 candidate sources, the Galactic Centre region, Sagittarius A*, and the supernova remnant RXJ 1713.7-3946—produces evidence of a cosmic neutrino source at the 90% confidence level. The best full-Sky point-like cluster yields 5.7 fitted signal events with a spectral index of 2.5 and a post-trial p-value of 0.18. The Galactic Centre extended-source search with $\sigma_s = 2.0^\circ$ gives 20.3 fitted events, a spectral index of 3.0, and the smallest post-trial p-value in the paper, 0.03. The constructive claim is that the combined analysis, exploiting ANTARES' better angular resolution at low energies in the Southern Sky alongside IceCube's larger effective volume, reaches roughly twice the sensitivity of either standalone search, as quantified by the 90% C.L. median sensitivity curves.
Load-bearing premise
The quoted significances and sensitivity gain assume that the time-randomized background-only pseudo-experiments reproduce the true joint atmospheric background of the two detectors, including its energy and directional distributions.
Editorial extensions
If this is right
- A Southern-Sky neutrino source whose $E^{-2}$ flux lies at or above the combined 90% C.L. upper limits would be excluded by this analysis, so the limits set the benchmark for future hadronic-emission models of these objects.
- The smallest post-trial p-value in the paper occurs in the 2-degree extended Galactic Centre search (0.03), making that region and source-size hypothesis the one most likely to yield a real signal with more data.
- Because the two data sets enter a single likelihood, the same procedure can be applied without structural changes to future, larger event samples from either detector.
- The candidate-list search yields no significant excess for any of the 57 objects and provides per-object 90% C.L. upper limits on the flux normalization for $E^{-2}$ and $E^{-2.5}$ spectra.
Reading between the lines
- If the 2-degree Galactic Centre excess is a genuine neutrino signal rather than a background fluctuation, its fitted parameters ($\hat{n}_s=20.3$, $\hat{\gamma}=3.0$) point to a population of unresolved cosmic-ray accelerators spread over a degree-scale region, a hypothesis a larger deep-sea telescope with Southern-Sky coverage could confirm or reject within a few years.
- The distance between the RXJ 1713.7-3946 limits and the two assumed model fluxes (factors of 10.7 and 9.7) implies that roughly an order-of-magnitude gain in sensitivity is needed to test those models; such a gain is plausible with a several-times-larger detector effective volume.
- The same likelihood machinery could be repurposed as a live monitoring tool: recomputing the local p-value of the Galactic Centre hotspot after each new data release would show whether the excess grows or decays, providing an early, trial-free test of its reality.
Editorial analysis
A structured set of objections, weighed in public.
Referee Report
Summary. This proceedings paper reports a combined search for point-like and extended neutrino sources in the Southern Sky, using track and shower events from the nine-year ANTARES point-source analysis and through-going tracks from the seven-year IceCube point-source search. A seven-sample unbinned likelihood (Eq. 3.1) is used to scan the Southern Sky, to test a list of 57 candidate sources, and to perform dedicated searches of the Galactic Centre region, Sagittarius A*, and RX J1713.7-3946. The paper reports no significant excess; the most significant results are a point-like cluster with post-trial p = 0.18 in the full-sky scan and an extended (2°) cluster with post-trial p = 0.03 in the Galactic Centre region. The abstract and conclusions claim an improvement in Southern-Sky sensitivity by a factor of about 2 compared to individual analyses, and 90% confidence level upper limits are presented.
Significance. The combination of ANTARES and IceCube is an important step for Southern-Sky neutrino astronomy, and the claimed factor of about 2 sensitivity gain is an encouraging result. The paper adheres to established likelihood methods, uses signal and background probability density functions from prior peer-reviewed analyses, and applies a Monte-Carlo based trial correction, which are strengths. However, the underspecified coupling between per-sample signal counts and a common source flux means that the statistical hypothesis tested by the quoted p-values and the basis for the sensitivity-gain claim must be clarified before the results can be accepted at face value.
major comments (2)
- [Section 3, Eq. (3.1)] The likelihood is written in terms of n_j^s, the signal count in sample j, but the text introduces n_s as the unknown total number of signal events without specifying any relationship such as n_j^s = n_s A_j(gamma). As written, the alternative hypothesis in the test statistic Q (Eq. 3.2) has seven independent signal amplitudes, one per sample, constrained only by the sum n_s = sum_j n_j^s. The reported p-values (e.g., 0.18 in Section 4.1, 0.03 in Section 4.3) and the sensitivity gain are then not p-values and sensitivities for the hypothesis of a single physical source with one flux normalization. The authors should either provide the missing coupling (for instance via sample-dependent acceptance fractions) or explicitly state that the n_j^s are independent; in the latter case the physical interpretation of the limits changes and should be discussed.
- [Section 3.1, text after Eq. (3.1)] The statement that the values of the number of signal events ns (ns >= 0.001) and the signal spectral index gamma are optimised is inconsistent with the likelihood, which contains only n_j^s and no explicit n_s. If n_s is a derived quantity, the optimisation should be described in terms of the n_j^s with the constraint n_s = sum_j n_j^s; if n_s is the primary parameter, Eq. (3.1) must be rewritten to show its relation to n_j^s. The present text makes it impossible to reproduce the fitted best-fit values listed in Tables 2, 4, and 5.
minor comments (5)
- [Abstract] The phrase 'events from the direction of the Southern Sky' should read 'events with directions in the Southern Sky' to avoid implying a single direction.
- [Section 4.1] The phrase 'the location of the fitted cluster being left free to vary within these boundaries' is unclear; if the scan is performed in 1-degree steps, the text should state whether the cluster position is optimized over a continuous range or within each grid cell.
- [Section 4.4] There is a missing space in 'Table5'; it should read 'Table 5'.
- [Table 3] The notation 'Phi90%E-2.0_nu' in the table header is difficult to parse; consider a clearer formatting such as 'Phi^{90%}_{nu,E^{-2.0}}'.
- [Section 4.3] The best-fit position for the 2.0-degree extended search, (274.1 degrees, -40.1 degrees), is about 13 degrees away from the Galactic Centre; the text should explicitly note that the excess is not centered on the Galactic Centre, which is relevant for the interpretation of the 'Galactic Centre region' search.
Circularity Check
No significant circularity: the combined-search results are statistical outputs from external data samples and published PDFs, with no fitted quantity renamed as a prediction.
full rationale
The paper reports an experimental search: it takes data samples and signal/background PDFs from the published ANTARES [3] and IceCube [4] point-source analyses, constructs the joint likelihood in Eq. (3.1), maximizes it over the signal normalization and spectral index, and compares the resulting test statistic to background-only pseudo-experiments. The quoted post-trial p-values and 90% C.L. upper limits are observed outcomes of that procedure, not quantities derived from themselves. The sensitivity gain of about a factor of 2 is an estimate from pseudo-experiments and from the combined likelihood, not a claim that a fitted parameter has been independently predicted. Citations to the collaborations' own earlier papers provide the concrete data samples and PDF parameterizations, which are external inputs with stated assumptions; they are not used to assert the conclusion of this paper. The possible ambiguity in Eq. (3.1) about how the per-sample signal counts n_j^s relate to a common source flux is a modeling/presentation concern, but it does not make the analysis circular. Hence the correct finding is no significant circularity, score 0.
Assumptions & free parameters
free parameters (3)
- signal event count n_s =
5.7 (full-sky best, point-like); 20.3 (Galactic Centre, 2.0 deg); per-candidate values in Table 3
- spectral index gamma =
2.5 (full-sky best, point-like); 3.0 (Galactic Centre, 2.0 deg); per-candidate values in Table 3
- source position (RA, Dec) =
(213.2 deg, -40.8 deg) for full-sky best; (274.1 deg, -40.1 deg) for Galactic Centre search
assumptions (5)
- standard math The maximum likelihood defined in Eq. (3.1) over the product of per-sample and per-event terms is a valid inference framework.
- domain assumption The signal and background PDFs from the nine-year ANTARES analysis [3] and the seven-year IceCube analysis [4] remain valid when the samples are combined.
- domain assumption Time-randomized pseudo-experiments produce background-only test statistic distributions that match the real atmospheric background.
- domain assumption Extended sources are modeled as Gaussian with effective width sigma_eff = sqrt(sigma^2 + sigma_s^2) for IceCube and as a MC PSF convolved with a Gaussian for ANTARES.
- domain assumption The RXJ 1713.7-3946 neutrino spectra follow the two published models [7,8] with parameters in Table 6.
Cite this review
Pith. "Pith review of ANTARES and IceCube combined search for neutrino point-like and extended sources in the Southern Sky." pith.science (2026). https://pith.science/paper/FCNAADVH
@misc{pith2026190807439,
  author       = {Pith},
  title        = {Pith review of: ANTARES and IceCube combined search for neutrino point-like and extended sources in the Southern Sky},
  year         = {2026},
  howpublished = {\url{https://pith.science/paper/FCNAADVH}},
  note         = {Machine review of arXiv:1908.07439}
}
abstract
The ANTARES neutrino telescope, located in the Mediterranean Sea, and the IceCube neutrino observatory, located at the geographic South Pole, both search for cosmic neutrino events with an instantaneous full-sky field of view. The different characteristics of the two telescopes, in particular the larger instrumented volume of IceCube and the better visibility towards the Southern Sky for neutrino energies below 100 TeV of ANTARES, are exploited in a combined search for point-like and extended sources. The sensitivity to neutrino sources located in the Southern Sky is improved by a factor of $\sim$2 compared to individual studies. The data samples used in this analysis correspond to all track-like and shower-like events from the direction of the Southern Sky which were included in the nine-year ANTARES point-source analysis, combined with the through-going track-like events used in the seven-year IceCube point-source search. In this analysis, the Southern Sky is scanned for possible excesses of neutrinos that might indicate the presence of a source, while the coordinates of predefined candidate neutrinos sources are also evaluated in order to limit the penalty of trials. In addition, special focus is given to the region around the Galactic Centre, treated as an extended neutrinos source, and to the location of the supernova remnant RXJ 1713.7-3946. The result of this combined search for galactic and extra-galactic neutrino sources in the Southern Sky is reported here. No significant evidence of cosmic neutrino sources is found and flux upper limits from the various searches are presented.
Figures


Reference graph
Works this paper leans on
-
[3]
Albert et al., Phys
ANTARES Collaboration, A. Albert et al., Phys. Rev. D96 (2017) 082001
2017
-
[4]
IceCube Collaboration, M. G. Aartsen et al., Astrophys. J. 835 (2017) 151
2017
-
[1]
Ageron et al., Nucl
ANTARES Collaboration, M. Ageron et al., Nucl. Instrum. Meth. A656 (2011) 11
2011
-
[2]
IceCube Collaboration, M. G. Aartsen et al., JINST 12 (2017) P03012
2017
-
[5]
H.E.S.S. Collaboration, F. Aharonian, Astron. Astrophys. 467 (2007) 1075–1080
work page 2007
-
[6]
Neyman, Phil
J. Neyman, Phil. Trans. Roy. Soc. Lond. A236 (1937) 333
1937
- [7]
-
[8]
KM3NeT Collaboration, A. Trovato, R. Coniglione, P. Sapienza, and J. Barrios-Martí, PoS(ICRC2017)999 (2018)
work page 2018
Show all 12 references
-
[9]
Vissani, Astropart
F. Vissani, Astropart. Phys. 26 (2006) 310–313
2006
-
[10]
F. L. Villante and F. Vissani, Phys. Rev. D78 (2008) 103007
2008
-
[11]
Vissani and F
F. Vissani and F. L. Villante, Nucl. Instrum. Meth. A588 (2008) 123–129
2008
-
[12]
Abdalla et al., Astron
HESS Collaboration, H. Abdalla et al., Astron. Astrophys. 612 (2018) A6. 8
2018
Reviewed August 14, 2026 · model on record in the stance chip above.
Discussion (0). Continue with ORCID to comment.