REVIEW 4 major objections 5 minor 77 references
Chandra Spectral and Timing Analysis of Sgr A*'s Brightest X-ray Flares
T0 review · 4 major / 5 minor · reviewed 2026-08-14 · deepseek-v4-flash
Pith's one-line read The two brightest X-ray flares ever seen from the Milky Way's central black hole are the same phenomenon as its fainter daily flares.
desk verdict Solid, careful analysis of Sgr A*'s brightest Chandra flares; the pile-up formula in the paper is mis-printed, but the actual correction is standard and the main conclusions survive. read the letter →
The pith
A machine-rendered reading of the paper's core claim, the machinery that carries it, and where it could break.
The reading
What carries the argument
The load-bearing tool is the pile-up correction relation $f_r = 1 - [\exp(\alpha\Lambda)-1][\exp(-\Lambda)]/(\alpha\Lambda)$, which converts raw Chandra count rates into incident count rates; the claim that F1 is the brightest flare ever seen, and the 600 times and 245 times luminosity contrasts, rest on it. Spectral results come from the joint model fgcdust × TBnew × (powerlaw_f + powerlaw_q + blackbody), which separates the flare power law from the quiescent power law and the magnetar blackbody while fixing the absorption column and quiescent index to external values. Timing results come from Fourier power spectra and Lomb–Scargle periodograms compared with Monte Carlo red-plus-white noise simulations, plus a bad-column diagnostic that re-extracts the event list without the flagged pixel columns.
What would settle it
Reprocess the Chandra ObsID 15043 event list without excluding the flagged bad pixel columns and check the 3 mHz feature: the paper's own re-analysis shows it disappears, so a persistent narrow peak in the cleaned light curve would refute the artifact claim. A second test: measure the quiescent power-law index simultaneously with a bright flare using a pile-up-free, high-resolution spectrum; if the quiet component is not $\Gamma\approx3$, the reported $\Gamma\approx2$ flare indices would shift and the shared-mechanism claim would need revision.
Extended reading notes
Core claim
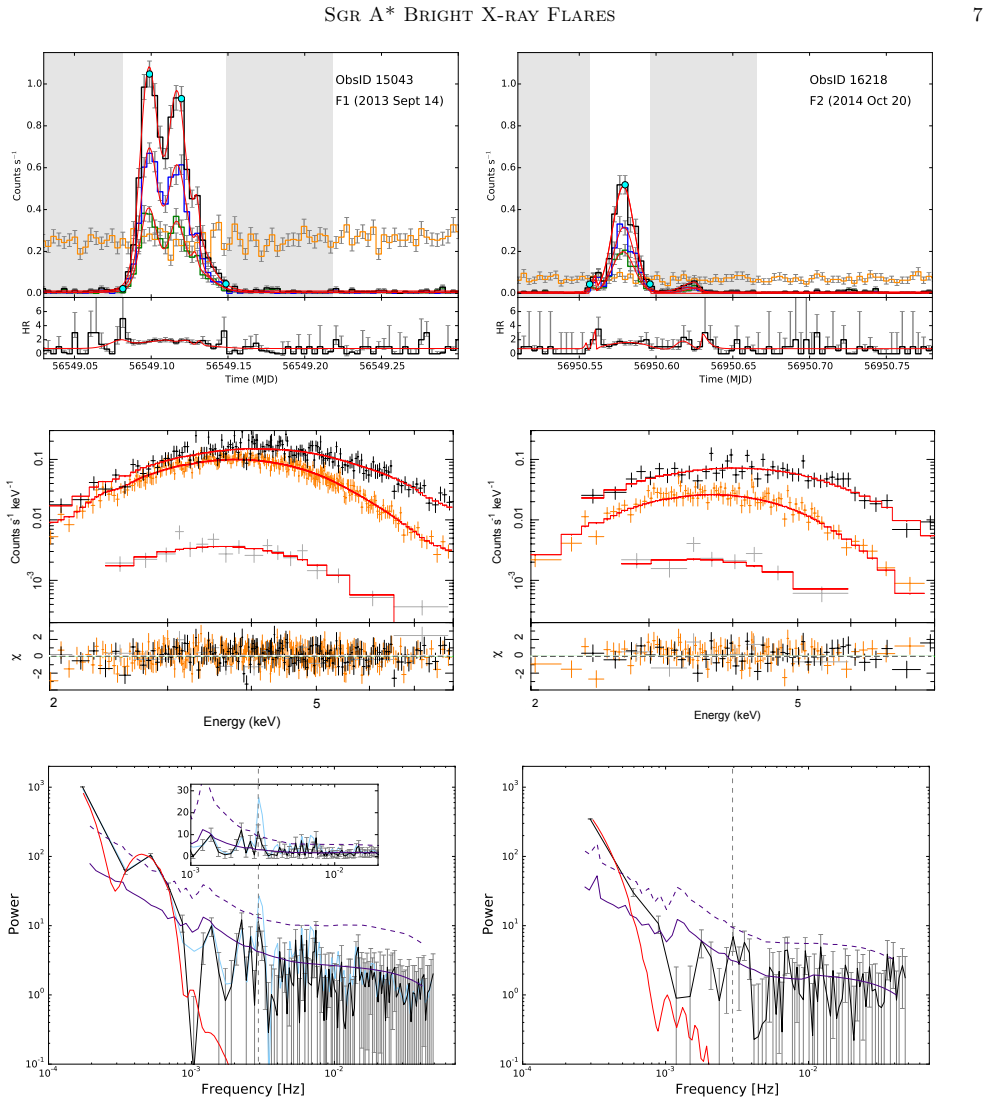
The paper establishes that Sgr A*'s two brightest Chandra-detected X-ray flares are the same kind of event as its common faint flares. After correcting for photon pile-up and for contamination from the nearby magnetar SGR J1745−2900, F1 reaches a peak 2–10 keV luminosity near 1.2×$10^{36}$ erg/s and F2 near 4.9×$10^{35}$ erg/s, more than 600 and 245 times the quiescent level respectively. Their power-law photon indices (the spectral slope, with smaller values meaning harder emission), 2.06±0.14 and 2.03±0.27, are consistent with those of earlier bright and faint flares and significantly harder than the quiescent index 3.0±0.2, so the authors argue that all Sgr A* X-ray flares arise from similar physical processes. The paper also rules out short-timescale periodicity: the apparent narrow 3 mHz peak in F1's power spectrum disappears when the event list is re-extracted without excluding the flagged bad pixel column, and no quasi-periodic oscillation or excess non-periodic power is found at the 95 percent confidence level in either flare.
Load-bearing premise
The flare spectral indices depend on the assumptions, taken from earlier work, that the neutral hydrogen column is $16.3\times10^{22}$ cm$^{-2}$ and that the quiescent emission during the flares has photon index $3.0\pm0.2$; if the quiet emission behind the flare differed, the quoted flare indices would shift.
Editorial extensions
If this is right
- The fainter and brighter Sgr A* X-ray flares can be analyzed as one population; the fluence, count-rate, and duration relations measured on the large faint-flare sample can be extended to the bright end without invoking a separate mechanism.
- A candidate quasi-periodic oscillation in Chandra Sgr A* data should be treated as an artifact until the extraction region's crossing of bad pixel columns during telescope dither is checked.
- The roughly 3–6 ks flare timescale and the roughly 1.8 ks separation between F1's two peaks place the emitting structure near 5 Schwarzschild radii, close to the innermost stable circular orbit, supporting hot-spot models of the emitting region.
- The flare energy budget, roughly $3.3\times 10^{39}$ erg in the 2–10 keV band for F1, implies that brighter flares need larger emitting volumes, so the source size likely grows with flare brightness.
- Because neither flare has near-infrared coverage, simultaneous Chandra and near-infrared interferometric observations are the next direct test of whether X-ray and infrared flares trace the same orbiting structure.
Reading between the lines
- One implication the authors do not spell out is that if bright and faint flares share a mechanism, the same joint spectral model should recover $\Gamma \approx 2$ for faint flares even when the quiescent index is fitted rather than fixed; stacking many faint Chandra flares could test this.
- The artifact diagnosis predicts that the 3 mHz peak should reappear whenever the flagged pixel columns are masked, and should be absent for a pointing whose dither path does not cross them; a different Chandra roll angle on Sgr A* would settle this independently.
- The morphological resemblance between F1 and a double-peaked near-infrared flare observed by interferometry suggests both wavebands trace the same orbiting structure; simultaneous Chandra and near-infrared coverage of one bright flare would test that directly, though the authors only call for such campaigns.
- If the emitting region size grows with luminosity, the largest flares should also be the longest and most structured; this can be checked by extending the fluence-duration plane as more bright flares are collected.
Signed reviews
Editorial analysis
A structured set of objections, weighed in public.
Referee Report
Summary. The paper reports a spectral and timing analysis of two bright X-ray flares from Sgr A* observed with Chandra ACIS-S in 1/8 subarray mode: F1 on 2013 September 14 (ObsID 15043) and F2 on 2014 October 20 (ObsID 16218). It argues that F1 is the brightest Chandra-detected Sgr A* flare to date, with a double-peaked 5.7 ks light curve and a pile-up-corrected peak 2-10 keV luminosity near 1.2e36 erg/s, and that F2 is the second-brightest such flare. Both flares are reported to be harder than quiescence (Gamma ~ 2.0-2.1 versus Gamma ~ 3.0), consistent with previous Sgr A* flares. A candidate 3 mHz quasi-periodic oscillation in F1 is identified and shown to be an instrumental artifact from a bad-column/dither interaction; no other significant periodic or quasi-periodic variability is found. The analysis includes joint spectral modeling of flare, quiescent, and magnetar components with dust scattering and pile-up, plus Monte Carlo significance testing of the power spectra.
Significance. If the quantitative claims hold, these observations extend the known Sgr A* X-ray flare population to substantially higher peak luminosities and support a common emission mechanism for bright and faint flares. The paper is unusually careful in its treatment of systematic effects: it models magnetar contamination with ChaRT/MARX, includes dust scattering, treats pile-up with a free grade-migration parameter for F1, and explicitly identifies and removes the 3 mHz bad-column artifact. The subtraction check in Section 4.3, which yields harder indices (Gamma = 1.83 +/- 0.13 and 1.93 +/- 0.30), demonstrates that the hardness result is not an artifact of the joint spectral model. However, the headline numbers---the 'brightest flare' luminosity, the 600x and 245x quiescence ratios, and the ranking of F2 relative to the Nowak et al. (2012) flare---all pass through a pile-up correction whose printed formula does not reproduce the corrected rates in Table 2. This issue must be resolved before the quantitative claims can be used for physical conclusions.
major comments (4)
- [Section 3.5, Eq. (1) and Table 2] The printed pile-up relation is inconsistent with the corrected rates reported in Table 2. For F1's peak raw rate of 1.04 ct/s and a frame time of 0.44 s, the incident rate is Lambda ~ 0.46 counts/frame; Eq. (1) with alpha = 0.5 yields a corrected rate of about 1.4 ct/s, not the listed 1.17 ct/s. The relation commonly used in ISIS/xspec pile-up models, C = [1 - exp(-alpha Lambda)]/alpha, reproduces the 1.17 ct/s value with alpha near 0.5. Moreover, the ratios of corrected to raw rates in Table 2 are approximately constant across the mean and peak values, whereas the printed nonlinear relation would require a larger correction at the higher peak rate. This indicates either a typographical error in Eq. (1) or a different correction procedure in the actual analysis. Because the 'brightest flare' claim, the 600x and 245x ratios, and the fluences all depend on the corrected rates, the authors must state exactly what formula and alpha values were used, correct Eq. (1), and rerun or verify the tabulated values.
- [Section 4.3 and Table 2] The quoted flare photon indices and luminosities assume Gamma_q = 3.0 +/- 0.2 and N_H = 16.3e22 cm^-2, both fixed to external values, and for F2 the pile-up grade-migration parameter alpha is fixed to 0.5 because it cannot be constrained by the data. The systematic uncertainty in these fixed parameters is not propagated into Gamma_f or the luminosities. The paper's own quiescent fit gives Gamma_q ~ 3.7 +/- 0.5, and the subtraction check gives harder indices (1.83 and 1.93), so the direction of the hardness result is robust; however, the exact numerical indices and the comparison with previous flare measurements are conditional on these assumptions. I request a sensitivity analysis that varies Gamma_q over at least its quoted 1-sigma range (and ideally over the 2.8-3.7 range allowed by the current data), N_H over its uncertainty, and alpha over the range allowed for F2, with the resulting shifts in Gamma_f and L reported. This is especially pertinent because the adopted Gamma_q is taken from a previous paper with overlapping authorship.
- [Section 6 and Table 2] The claim that F2 is the second-brightest Chandra Sgr A* flare rests on a luminosity of 49.1 x 10^34 erg/s versus 48 x 10^34 erg/s for the Nowak et al. (2012) flare, a margin of about two percent. Given the pile-up correction inconsistency identified above and the unconstrained alpha for F2, this ranking is not yet supported. F1's status as the brightest flare is robust---its peak luminosity is a factor of about 2.5 above the previous record---but the same is not true for F2. Either the ranking should be made contingent on a systematic-error analysis that includes the pile-up ambiguity, or the wording should be softened to 'among the brightest flares detected.'
- [Abstract and Section 5.1] The abstract states that no periodic or quasi-periodic variability is found 'at the 95% confidence level,' but Section 5.1 presents 50% and 90% confidence intervals for the FFT-based PSD analysis, while Section 5.3 uses 95% confidence for the Lomb-Scargle permutation test. These confidence levels should be reconciled in the text and the abstract. If both tests support the null result at the 95% level, the paper should say so explicitly; otherwise, the abstract's confidence statement should be revised to match the actual significance thresholds used.
minor comments (5)
- [Table 2 header] The spectral-fit column headers are difficult to parse in the typeset version; please reformat the table so that flux, luminosity, photon index, hardness ratio, magnetar flux, kT, alpha, and chi-squared are each clearly labeled.
- [Section 4.2] After reporting Gamma_q ~ 3.7 +/- 0.5 from the current quiescent data, the text immediately adopts Gamma_q = 3.0 from Nowak et al. (2012); a sentence explaining why the literature value is preferred over the direct fit would improve clarity.
- [Appendix B and Table B.1] The parameter A in Eqs. (B1) and (B2) is an integrated normalization rather than a peak amplitude, but the text and Table B.1 label it as 'amplitude' with units of cnts/s; please relabel it to avoid confusion.
- [Section 5.3] The description of the Poisson simulation, which draws from an expectation value equal to the larger of the observed frame count or the quiescent expectation, is nonstandard; please provide a clearer definition or a reference for this zero-count treatment.
- [Abstract] The phrase 'either flares' time series' in the abstract contains a typo; it should read 'either flare's time series.'
Circularity Check
No significant circularity: flare indices are fitted and independently checked by a subtraction-only fit; the only overlapping-author citation (quiescent photon index) is not load-bearing.
full rationale
The paper's derivation chain is observational: raw ACIS-S lightcurves and spectra are corrected for pile-up using the Chandra ABC Guide/Ponti et al. (2015) relation (an external calibration), and the flare power-law indices are fitted with the quiescent index, N_H, and magnetar contributions fixed from external analyses. The central claims—F1/F2 as the brightest Chandra flares, hard indices Gamma ~ 2, and no QPOs—are not equivalent to any input. The quiescent index Gamma_q = 3.0 ± 0.2 is adopted from Nowak et al. (2012), a paper with overlapping authors, but this citation is not load-bearing: the present paper's own quiescent fit gives Gamma_q ~ 3.7 ± 0.5 (Section 4.2), and the independent off-flare subtraction check (Section 4.3) yields Gamma = 1.83 ± 0.13 and 1.93 ± 0.30, so the 'harder than quiescence' conclusion and consistency with previous flares survive without the adopted value. The pile-up correction is load-bearing for the luminosity ranking, but it is an externally calibrated instrumental correction rather than a parameter fitted to produce the headline result; any possible typographical inconsistency in Equation (1) is a reproducibility/correctness issue, not circularity. The apparent 3 mHz peak is identified as an artifact through the bad-column analysis (Section 5.2) and then removed, rather than being interpreted as a signal. No self-definitional, fitted-input-as-prediction, ansatz-smuggling, or author-imported-uniqueness step is present. The score of 1 reflects only the minor overlapping-authorship citation for the quiescent baseline, which does not force any claimed result.
Assumptions & free parameters
free parameters (7)
- Flare photon index Gamma_F1 =
2.06 +/- 0.14
- Flare photon index Gamma_F2 =
2.03 +/- 0.27
- Pile-up grade migration parameter alpha =
0.68 (+0.19/-0.17) for F1; fixed to 0.5 for F2
- Quiescent photon index Gamma_q =
3.0 +/- 0.2 (adopted from Nowak et al. 2012)
- Absorption column N_H =
16.3 x 10^22 cm^-2 (adopted from magnetar fit)
- Red noise slope beta =
1.0 and 2.0 (assumed)
- Lightcurve model parameters =
Table B.1 (Gaussian and skewed Gaussian amplitudes, centers, widths, gamma)
assumptions (5)
- domain assumption The X-ray spectrum during flaring is the sum of a flare power law, a quiescent power law, and a magnetar blackbody, all behind the same absorption and dust-scattering screen.
- domain assumption The Ponti et al. (2015) pile-up relation (Eq. 1) correctly converts observed to incident count rates for ACIS-S in 1/8 subarray mode.
- domain assumption The flare lightcurve noise is described by P(f) = f^-beta + 1 with beta in {1, 2} plus Poisson white noise.
- domain assumption The magnetar contributes 3% (F1) and 2.5% (F2) of the flux at Sgr A*'s position, per ChaRT/MARX ray tracing with Galactic-center dust halo approximations.
- standard math Standard background results: the 8 kpc Galactocentric distance, the Sgr A* mass of 4.28 x 10^6 solar masses, and the Keplerian conversion of timescales to orbital radii near the ISCO.
Cite this review
Pith. "Pith review of Chandra Spectral and Timing Analysis of Sgr A*'s Brightest X-ray Flares." pith.science (2026). https://pith.science/paper/FJN6B6AK
@misc{pith2026190801781,
  author       = {Pith},
  title        = {Pith review of: Chandra Spectral and Timing Analysis of Sgr A*'s Brightest X-ray Flares},
  year         = {2026},
  howpublished = {\url{https://pith.science/paper/FJN6B6AK}},
  note         = {Machine review of arXiv:1908.01781}
}
abstract
We analyze the two brightest Chandra X-ray flares detected from Sagittarius A*, with peak luminosities more than 600 x and 245 x greater than the quiescent X-ray emission. The brightest flare has a distinctive double-peaked morphology --- it lasts 5.7 ksec ($\sim 2$ hours), with a rapid rise time of 1500 sec and a decay time of 2500 sec. The second flare lasts 3.4 ksec, with rise and decay times of 1700 sec and 1400 sec. These luminous flares are significantly harder than quiescence: the first has a power law spectral index $\Gamma = 2.06\pm 0.14$ and the second has $\Gamma = 2.03\pm 0.27$, compared to $\Gamma = 3.0\pm0.2$ for the quiescent accretion flow. These spectral indices (as well as the flare hardness ratios) are consistent with previously-detected Sgr A* flares, suggesting that bright and faint flares arise from similar physical processes. Leveraging the brightest flare's long duration and high signal-to-noise, we search for intraflare variability and detect excess X-ray power at a frequency of $\nu \approx 3$ mHz, but show that it is an instrumental artifact and not of astrophysical origin. We find no other evidence (at the 95% confidence level) for periodic or quasi-periodic variability in either flares' time series. We also search for non-periodic excess power but do not find compelling evidence in the power spectrum. Bright flares like these remain our most promising avenue for identifying Sgr A*'s short timescale variability in the X-ray, which may probe the characteristic size scale for the X-ray emission region.
Figures


Figures from the paper (1 more)

Reference graph
Works this paper leans on
-
[1]
Baganoff, F. K., Bautz, M. W., Brandt, W. N., et al. 2001, Nature, 413, 45 Baganoff, F. K., Maeda, Y., Morris, M., et al. 2003, ApJ, 591, 891
work page 2001
- [2]
-
[3]
2018, ApJ, 853, 184 Barrière, N
Ball, D., Özel, F., Psaltis, D., Chan, C.-K., & Sironi, L. 2018, ApJ, 853, 184 Barrière, N. M., Tomsick, J. A., Baganoff, F. K., et al. 2014, ApJ, 786, 46 Bélanger, G., Goldwurm, A., Melia, F., et al. 2005, ApJ, 635, 1095
work page 2018
-
[4]
Boehle, A., Ghez, A. M., Schödel, R., et al. 2016, ApJ, 830, 17 Bouffard, É., Haggard, D., Nowak, M. A., et al. 2019, ApJ, 884, 148
work page 2016
-
[5]
C., Markoff, S., Dexter, J., et al
Bower, G. C., Markoff, S., Dexter, J., et al. 2015, ApJ, 802, 69
2015
-
[6]
2019, ApJ, 871, 161
Boyce, H., Haggard, D., Witzel, G., et al. 2019, ApJ, 871, 161
2019
-
[7]
M., Haggard, D., Choux, N., et al
Capellupo, D. M., Haggard, D., Choux, N., et al. 2017, ApJ, 845, 35
2017
-
[8]
R., García, J., Wilms, J., & Baganoff, F
Corrales, L. R., García, J., Wilms, J., & Baganoff, F. 2016, MNRAS, 458, 1345
work page 2016
Show all 77 references
-
[9]
R., Mon, B., Haggard, D., et al
Corrales, L. R., Mon, B., Haggard, D., et al. 2017, ApJ, 839, 76 Coti Zelati, F., Rea, N., Papitto, A., et al. 2015, MNRAS, 449, 2685 Coti Zelati, F., Rea, N., Turolla, R., et al. 2017, MNRAS, 471, 1819
2017
-
[10]
2008, MNRAS, 383, 458
Cuadra, J., Nayakshin, S., & Martins, F. 2008, MNRAS, 383, 458
2008
-
[11]
2005, MNRAS, 360, L55 —
Cuadra, J., Nayakshin, S., Springel, V., & Di Matteo, T. 2005, MNRAS, 360, L55 —. 2006, MNRAS, 366, 358
2005
-
[12]
M., Kennea, J., et al
Degenaar, N., Miller, J. M., Kennea, J., et al. 2013, ApJ, 769, 155
2013
-
[13]
C., & McKinney, J
Dexter, J., Agol, E., Fragile, P. C., & McKinney, J. C. 2010, ApJ, 717, 1092
2010
-
[14]
C., et al
Dexter, J., Kelly, B., Bower, G. C., et al. 2014, MNRAS, 442, 2797
2014
-
[15]
2014, MNRAS, 441, 1005 —
Dibi, S., Markoff, S., Belmont, R., et al. 2014, MNRAS, 441, 1005 —. 2016, MNRAS, 461, 552
2014
-
[16]
M., Morris, M
Do, T., Ghez, A. M., Morris, M. R., et al. 2009, ApJ, 691, 1021
2009
-
[17]
K., et al
Do, T., Witzel, G., Gautam, A. K., et al. 2019, ApJL, 882, L27
2019
-
[18]
2009, ApJ, 698, 676
Dodds-Eden, K., Porquet, D., Trap, G., et al. 2009, ApJ, 698, 676
2009
-
[19]
K., et al
Dodds-Eden, K., Gillessen, S., Fritz, T. K., et al. 2011, ApJ, 728, 37 18 Haggard et al
2011
-
[20]
S., Weintroub, J., Rogers, A
Doeleman, S. S., Weintroub, J., Rogers, A. E. E., et al. 2008, Nature, 455, 78
2008
-
[21]
C., Gammie, C
Dolence, J. C., Gammie, C. F., Shiokawa, H., & Noble, S. C. 2012, ApJL, 746, L10
2012
-
[22]
K., Zamaninasab, M., et al
Eckart, A., Baganoff, F. K., Zamaninasab, M., et al. 2008, A&A, 479, 625 Event Horizon Telescope Collaboration, Akiyama, K.,
2008
-
[23]
G., Hora, J
Fazio, G. G., Hora, J. L., Witzel, G., et al. 2018, ApJ, 864, 58
2018
-
[24]
C., Allen, G
Fruscione, A., McDowell, J. C., Allen, G. E., et al. 2006, in Proc. SPIE, Vol. 6270, Society of Photo-Optical Instrumentation Engineers (SPIE) Conference Series, 62701V
2006
-
[25]
2010, Reviews of Modern Physics, 82, 3121
Genzel, R., Eisenhauer, F., & Gillessen, S. 2010, Reviews of Modern Physics, 82, 3121
2010
-
[26]
M., Salim, S., Weinberg, N
Ghez, A. M., Salim, S., Weinberg, N. N., et al. 2008, ApJ, 689, 1044
2008
-
[27]
K., et al
Gillessen, S., Eisenhauer, F., Fritz, T. K., et al. 2009, ApJL, 707, L114
2009
-
[28]
K., et al
Gillessen, S., Genzel, R., Fritz, T. K., et al. 2012, Nature, 481, 51
2012
-
[29]
M., Eisenhauer, F., et al
Gillessen, S., Plewa, P. M., Eisenhauer, F., et al. 2017, ApJ, 837, 30
2017
-
[30]
2003, ApJ, 584, 751 Gravity Collaboration, Abuter, R., Amorim, A., et al
Goldwurm, A., Brion, E., Goldoni, P., et al. 2003, ApJ, 584, 751 Gravity Collaboration, Abuter, R., Amorim, A., et al. 2018a, A&A, 618, L10 —. 2018b, A&A, 615, L15 —. 2019, A&A, 625, L10
2003
-
[31]
D., Matthews, K., Ghez, A
Hornstein, S. D., Matthews, K., Ghez, A. M., et al. 2007, ApJ, 667, 900
2007
-
[32]
C., & Denicola, L
Houck, J. C., & Denicola, L. A. 2000, Astronomical Society of the Pacific Conference Series, Vol. 216, ISIS: An Interactive Spectral Interpretation System for High Resolution X-Ray Spectroscopy, ed. N. Manset, C. Veillet, & D. Crabtree, 591
2000
-
[33]
2017, MNRAS, 468, 2532
Jin, C., Ponti, G., Haberl, F., & Smith, R. 2017, MNRAS, 468, 2532
2017
-
[34]
D., Bursa, M., Eckart, A., et al
Karssen, G. D., Bursa, M., Eckart, A., et al. 2017, MNRAS, 472, 4422
2017
-
[35]
A., Burrows, D
Kennea, J. A., Burrows, D. N., Kouveliotou, C., et al. 2013, ApJL, 770, L24 Kostić, U., Čadež, A., Calvani, M., & Gomboc, A. 2009, A&A, 496, 307
2013
-
[36]
A., Darbro, W., Elsner, R
Leahy, D. A., Darbro, W., Elsner, R. F., et al. 1983, ApJ, 266, 160
1983
-
[37]
2002, ApJL, 566, L77
Liu, S., & Melia, F. 2002, ApJL, 566, L77
2002
-
[38]
2004, ApJL, 611, L101 Markoff, S., Falcke, H., Yuan, F., & Biermann, P
Liu, S., Petrosian, V., & Melia, F. 2004, ApJL, 611, L101 Markoff, S., Falcke, H., Yuan, F., & Biermann, P. L. 2001, A&A, 379, L13
2004
-
[39]
C., Morris, M., Walter, F., & Baganoff, F
Mauerhan, J. C., Morris, M., Walter, F., & Baganoff, F. K. 2005, ApJL, 623, L25
2005
-
[40]
1992, ApJL, 387, L25
Melia, F. 1992, ApJL, 387, L25
1992
-
[41]
2008, ApJL, 688, L17
Meyer, L., Do, T., Ghez, A., et al. 2008, ApJL, 688, L17
2008
-
[42]
V., Zhang, S., et al
Mori, K., Gotthelf, E. V., Zhang, S., et al. 2013, ApJL, 770, L23 Mościbrodzka, M., Gammie, C. F., Dolence, J. C.,
2013
-
[43]
Shiokawa, H., & Leung, P. K. 2009, ApJ, 706, 497
2009
-
[44]
2017, A&A, 604, A85
Mossoux, E., & Grosso, N. 2017, A&A, 604, A85
2017
-
[45]
H., & Porquet, D
Mossoux, E., Grosso, N., Vincent, F. H., & Porquet, D. 2015, A&A, 573, A46
2015
-
[46]
2016, A&A, 589, A116
Mossoux, E., Grosso, N., Bushouse, H., et al. 2016, A&A, 589, A116
2016
-
[47]
A., Gammie, C., et al
Neilsen, J., Nowak, M. A., Gammie, C., et al. 2013, ApJ, 774, 42
2013
-
[48]
A., et al
Neilsen, J., Markoff, S., Nowak, M. A., et al. 2015, ApJ, 799, 199
2015
-
[49]
A., Neilsen, J., Markoff, S
Nowak, M. A., Neilsen, J., Markoff, S. B., et al. 2012, ApJ, 759, 95
2012
-
[50]
L., Siemiginowska, A., et al
Park, T., Kashyap, V. L., Siemiginowska, A., et al. 2006, ApJ, 652, 610
2006
-
[51]
M., Gillessen, S., Pfuhl, O., et al
Plewa, P. M., Gillessen, S., Pfuhl, O., et al. 2017, ApJ, 840, 50
2017
-
[52]
R., et al
Ponti, G., De Marco, B., Morris, M. R., et al. 2015, MNRAS, 454, 1525
2015
-
[53]
2017, MNRAS, 468, 2447
Ponti, G., George, E., Scaringi, S., et al. 2017, MNRAS, 468, 2447
2017
-
[54]
2003, A&A, 407, L17
Porquet, D., Predehl, P., Aschenbach, B., et al. 2003, A&A, 407, L17
2003
-
[55]
2008, A&A, 488, 549
Porquet, D., Grosso, N., Predehl, P., et al. 2008, A&A, 488, 549
2008
-
[56]
2002, ApJ, 575, 855
Quataert, E. 2002, ApJ, 575, 855
2002
-
[57]
A., et al
Rea, N., Esposito, P., Pons, J. A., et al. 2013, ApJL, 775, L34
2013
-
[58]
J., & Brunthaler, A
Reid, M. J., & Brunthaler, A. 2004, ApJ, 616, 872
2004
-
[59]
Russell, C. M. P., Wang, Q. D., & Cuadra, J. 2017, MNRAS, 464, 4958
2017
-
[60]
Scargle, J. D. 1982, ApJ, 263, 835
1982
-
[61]
K., Valencic, L
Smith, R. K., Valencic, L. A., & Corrales, L. 2016, ApJ, 818, 143
2016
-
[62]
1995, A&A, 300, 707 Čadež, A., Calvani, M., & Kostić, U
Timmer, J., & Koenig, M. 1995, A&A, 300, 707 Čadež, A., Calvani, M., & Kostić, U. 2008, A&A, 487, 527
1995
-
[63]
A., Ferland, G
Verner, D. A., Ferland, G. J., Korista, K. T., & Yakovlev, D. G. 1996, ApJ, 465, 487
1996
-
[64]
D., Nowak, M
Wang, Q. D., Nowak, M. A., Markoff, S. B., et al. 2013, Science, 341, 981
2013
-
[65]
2000, ApJ, 542, 914 Sgr A* Bright X-ray Flares 19
Wilms, J., Allen, A., & McCray, R. 2000, ApJ, 542, 914 Sgr A* Bright X-ray Flares 19
2000
-
[66]
2012, ApJS, 203, 18
Witzel, G., Eckart, A., Bremer, M., et al. 2012, ApJS, 203, 18
2012
-
[67]
N., Ghez, A
Witzel, G., Sitarski, B. N., Ghez, A. M., et al. 2017, ApJ, 847, 80
2017
-
[68]
2018, ApJ, 863, 15
Witzel, G., Martinez, G., Hora, J., et al. 2018, ApJ, 863, 15
2018
-
[69]
Xu, Y.-D., Narayan, R., Quataert, E., Yuan, F., & Baganoff, F. K. 2006, ApJ, 640, 319
2006
-
[70]
2004, ApJ, 612, 724
Yuan, F., & Narayan, R. 2004, ApJ, 612, 724
2004
-
[71]
2003, ApJ, 598, 301
Yuan, F., Quataert, E., & Narayan, R. 2003, ApJ, 598, 301
2003
-
[72]
Yuan, Q., & Wang, Q. D. 2016, MNRAS, 456, 1438
2016
-
[73]
2016, ApJ, 819, 60
Yusef-Zadeh, F., Wardle, M., Schödel, R., et al. 2016, ApJ, 819, 60
2016
-
[74]
D., et al
Yusef-Zadeh, F., Bushouse, H., Dowell, C. D., et al. 2006, ApJ, 644, 198
2006
-
[75]
2012, AJ, 144, 1
Yusef-Zadeh, F., Wardle, M., Dodds-Eden, K., et al. 2012, AJ, 144, 1
2012
-
[76]
K., Ponti, G., et al
Zhang, S., Baganoff, F. K., Ponti, G., et al. 2017, ApJ, 843, 96
2017
-
[77]
2012, MNRAS, 421, 1315
Zubovas, K., Nayakshin, S., & Markoff, S. 2012, MNRAS, 421, 1315
2012
Reviewed August 14, 2026 · model on record in the stance chip above.
Discussion (0). Continue with ORCID to comment.