REVIEW 1 major objections 2 minor 80 references
The Importance of Galaxy-Wide Star Formation in Driving Winds at z~1
T0 review · 1 major / 2 minor · reviewed 2026-06-27 · grok-4.3
Pith's one-line read At z~1, galactic winds are driven by star formation spread across entire galaxies, not just their compact regions.
desk verdict z~1 winds follow the same v_wind-SFR relation as local starbursts and show no stronger tie to compact Σ_SFR, but the compact test lacks error analysis that could change the interpretation. read the letter →
The pith
A machine-rendered reading of the paper's core claim, the machinery that carries it, and where it could break.
The reading
What carries the argument
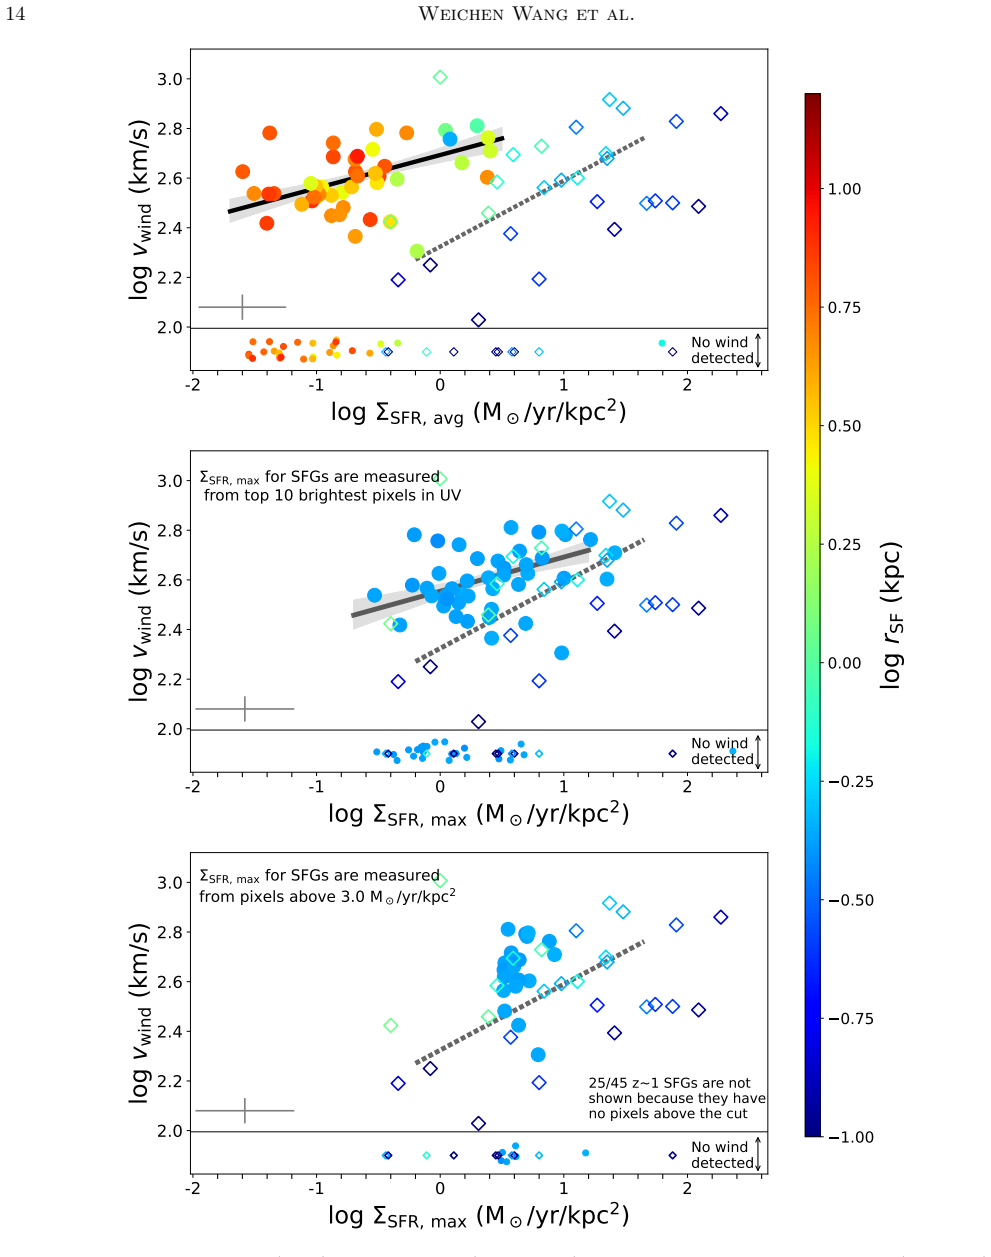
Comparison of correlation strength between wind velocity and star-formation surface density Σ_SFR when the density is computed over the whole galaxy versus only the most compact star-forming regions.
What would settle it
A larger sample in which wind velocity correlates significantly more strongly with compact-region Σ_SFR than with galaxy-wide Σ_SFR would undermine the claim that galaxy-wide star formation is the main driver.
Extended reading notes
Core claim
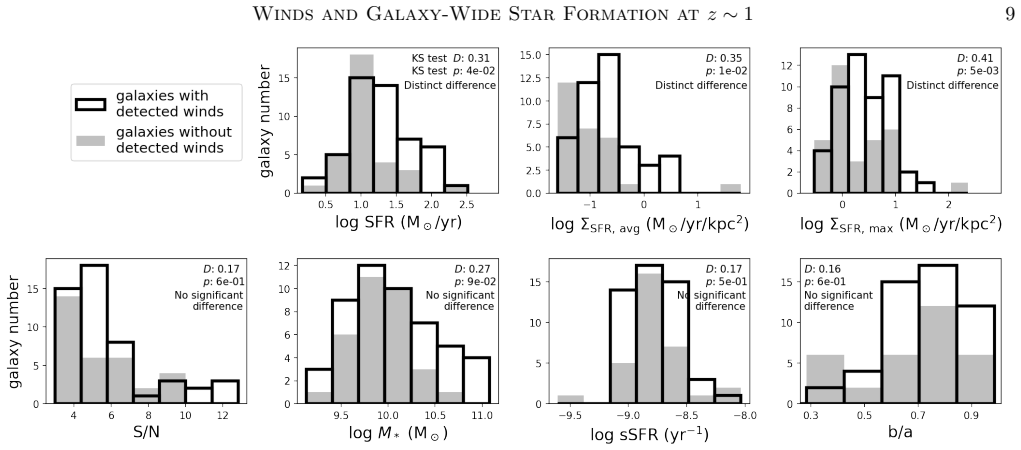
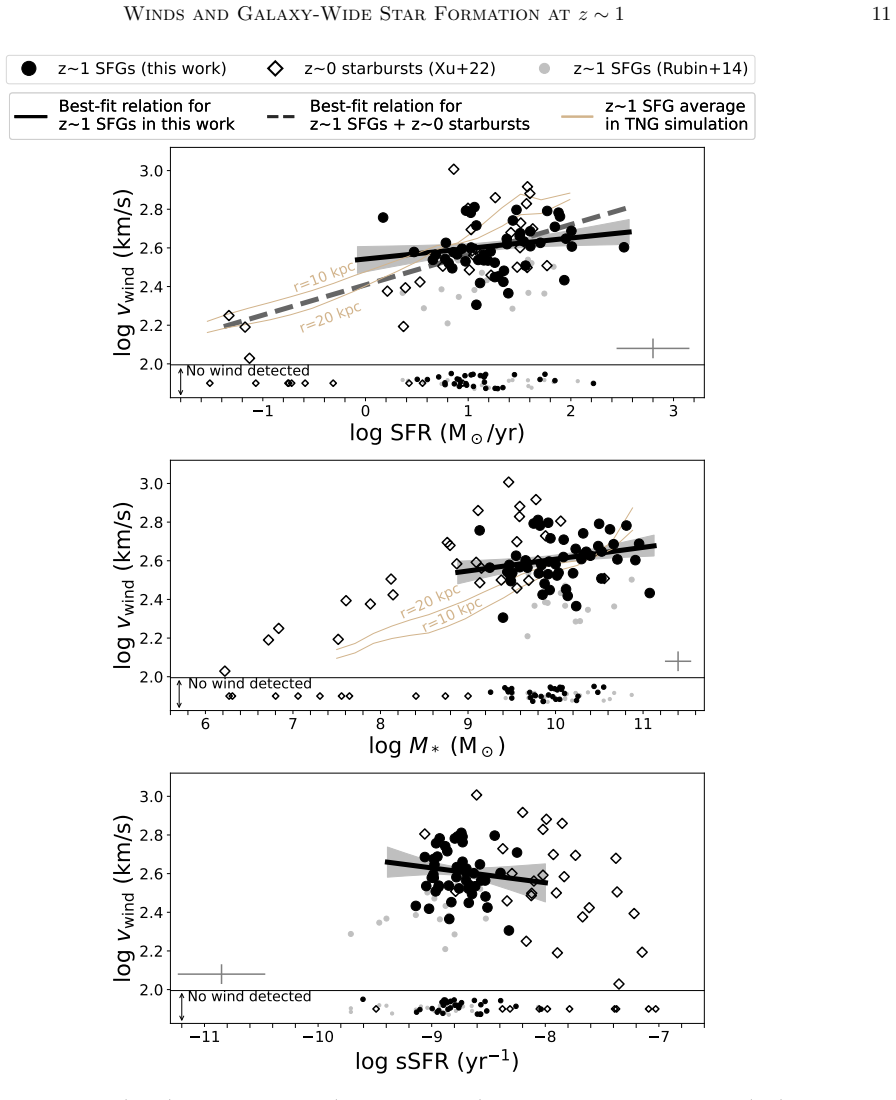
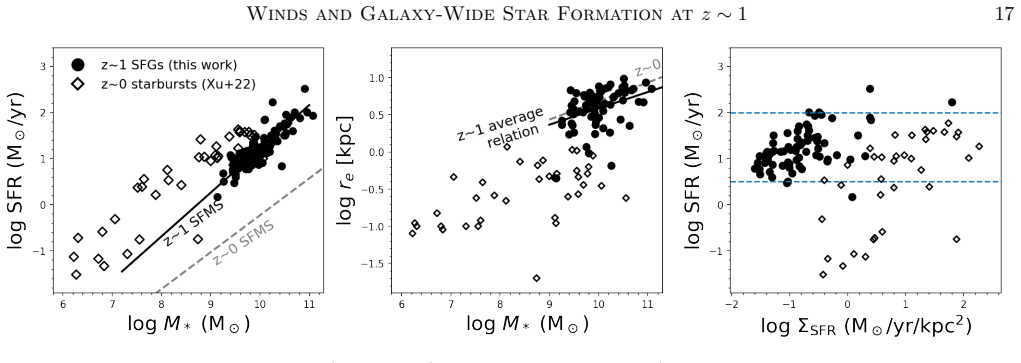
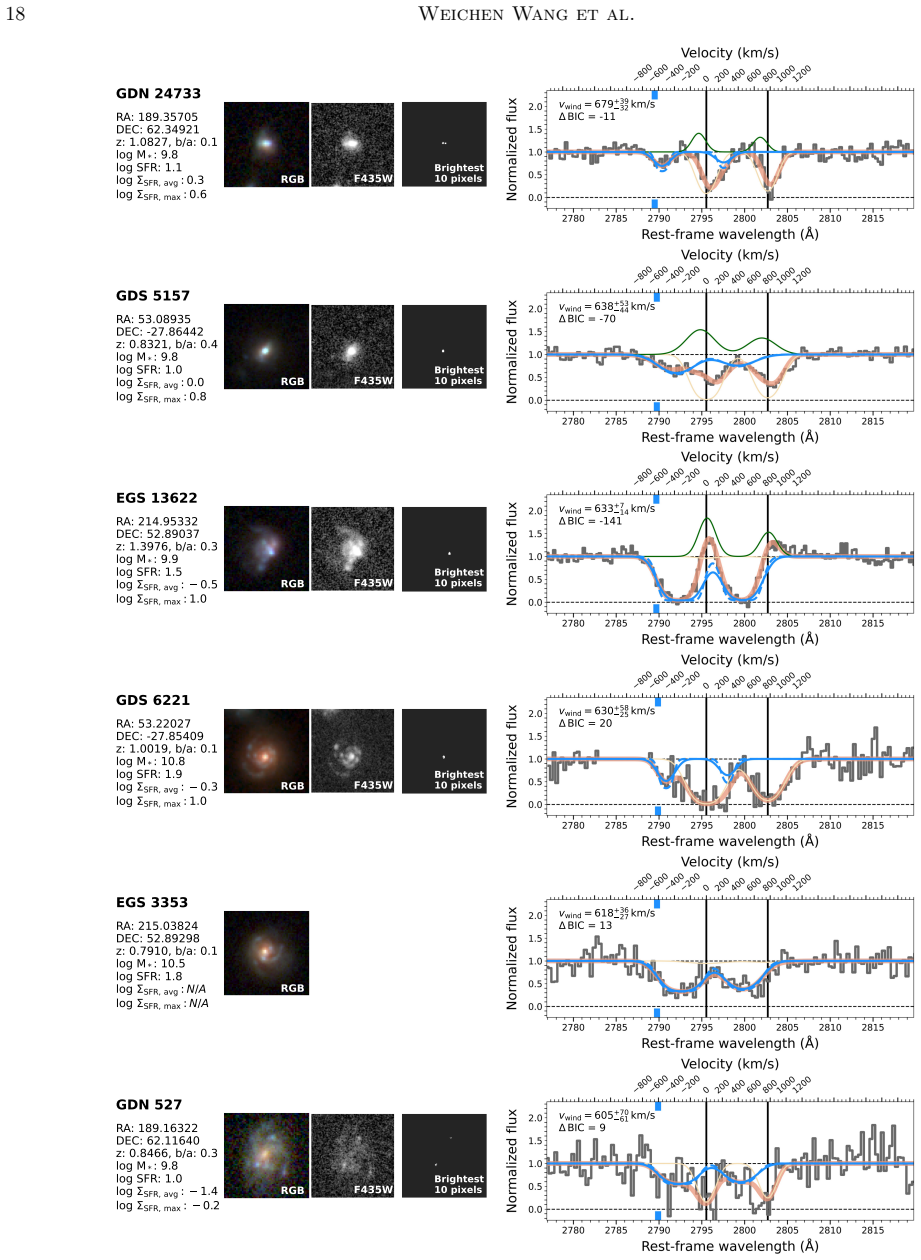
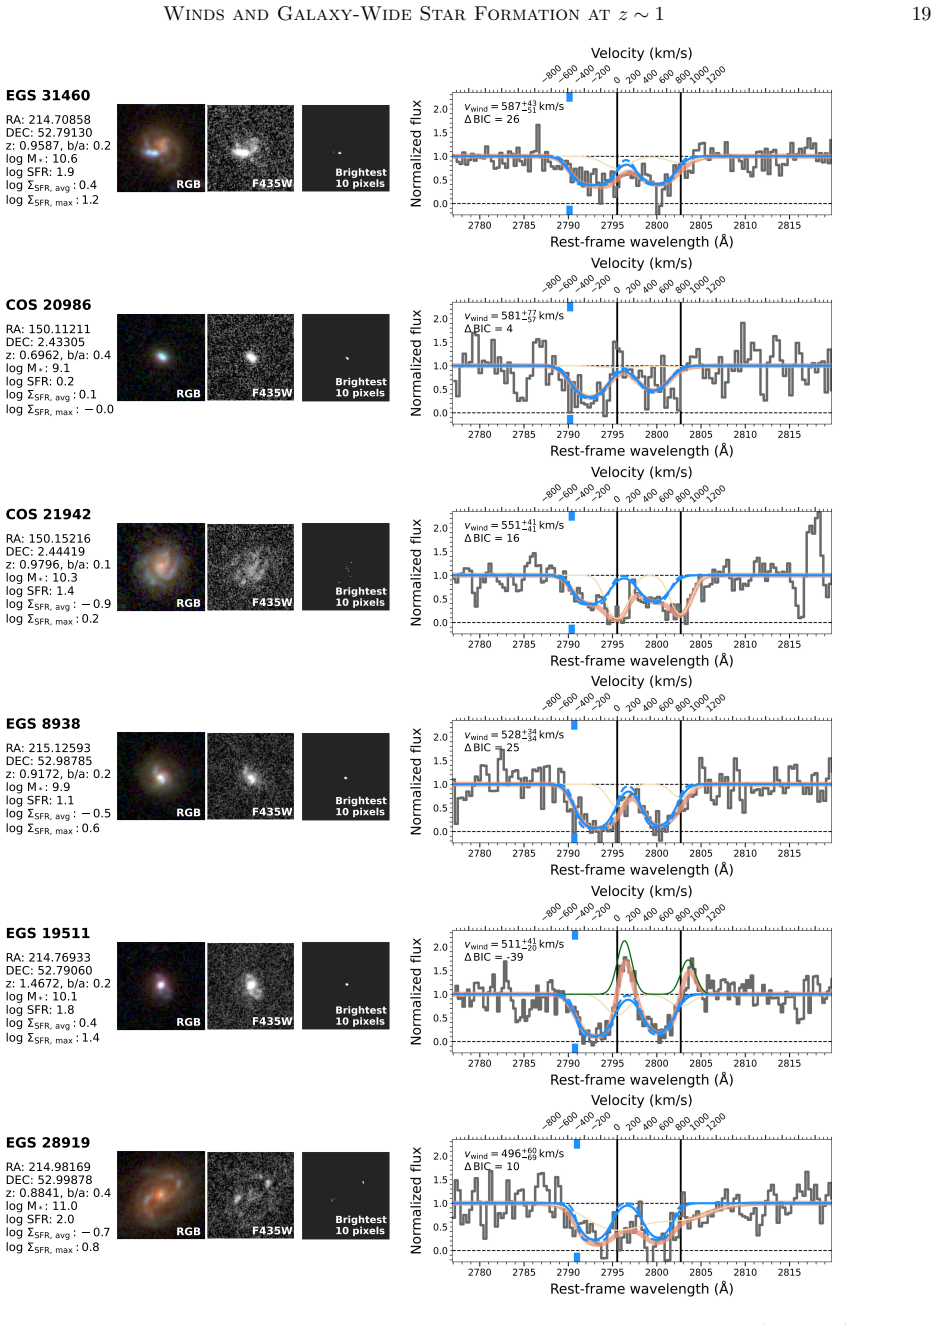
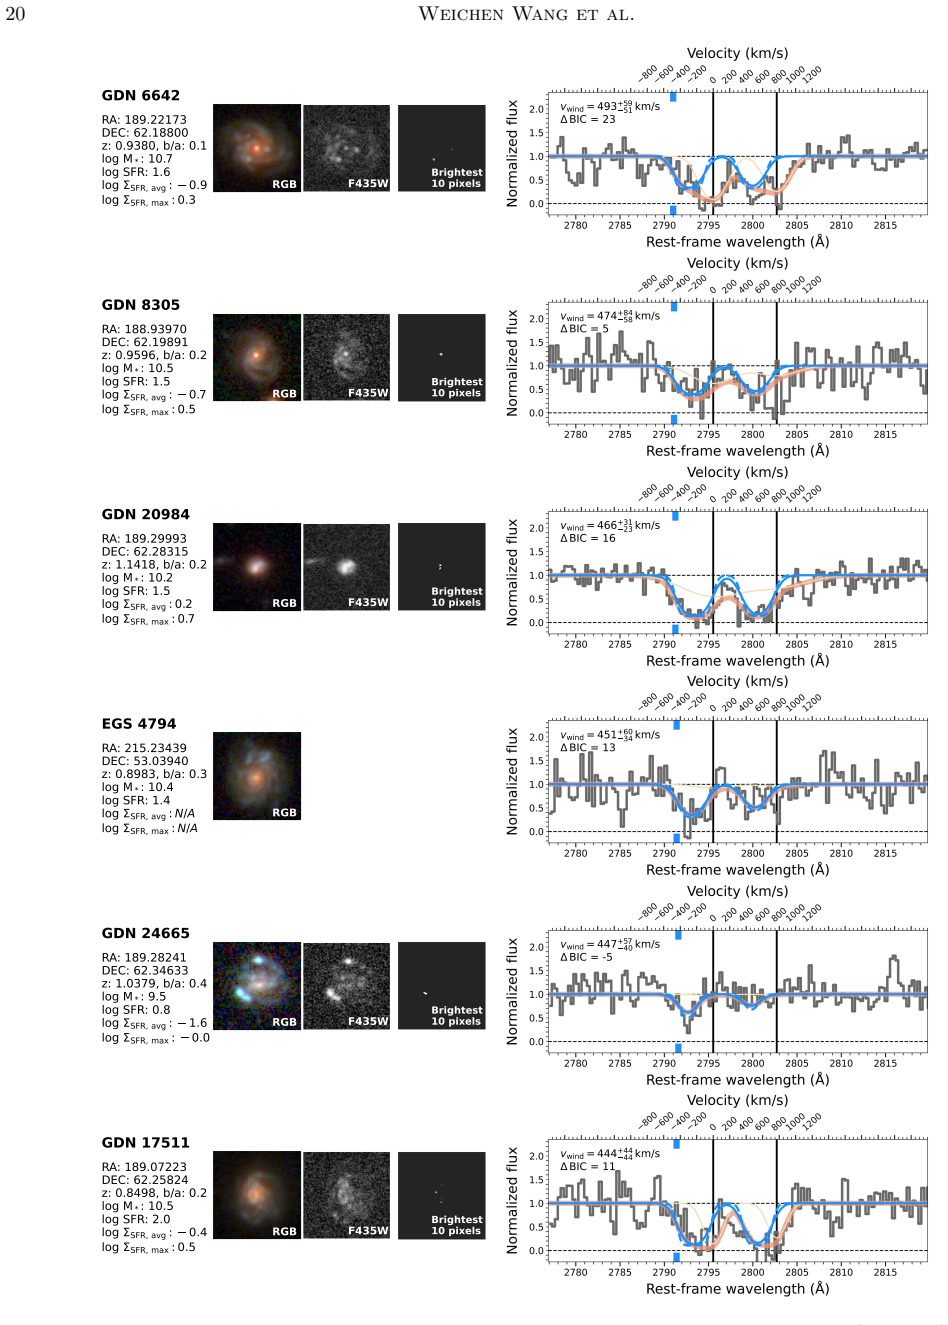
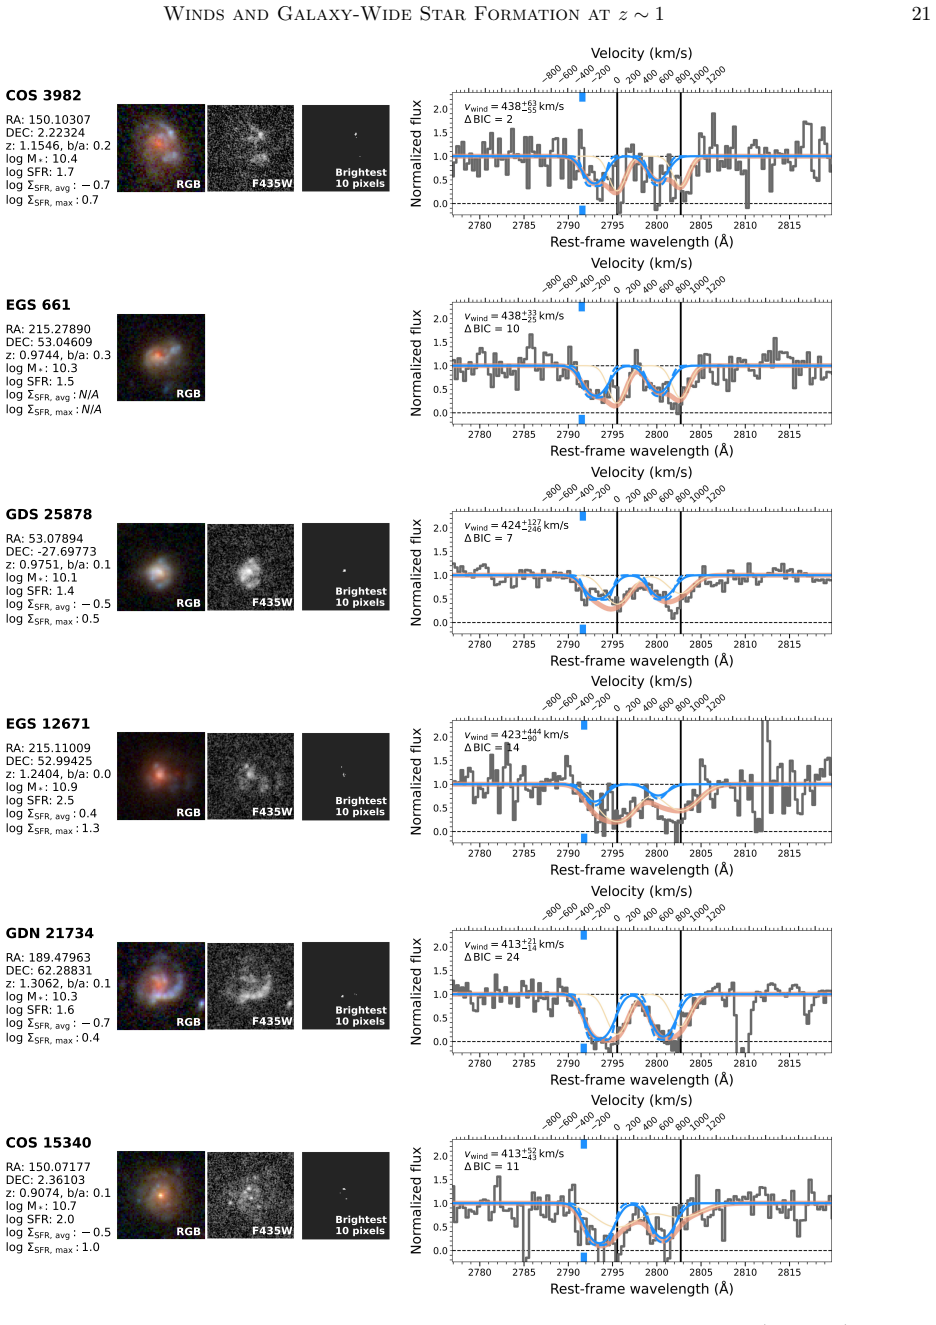
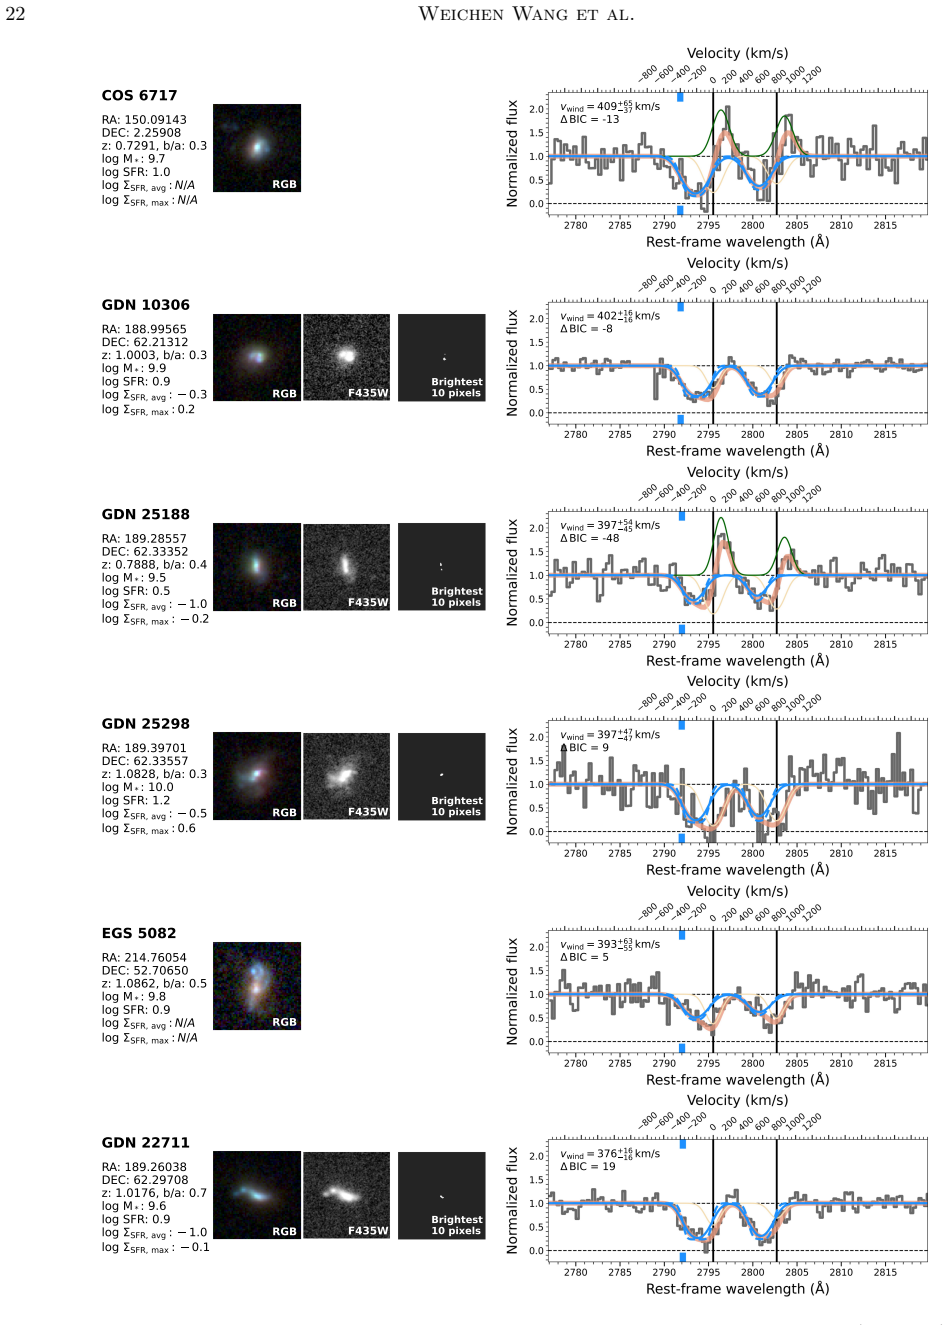
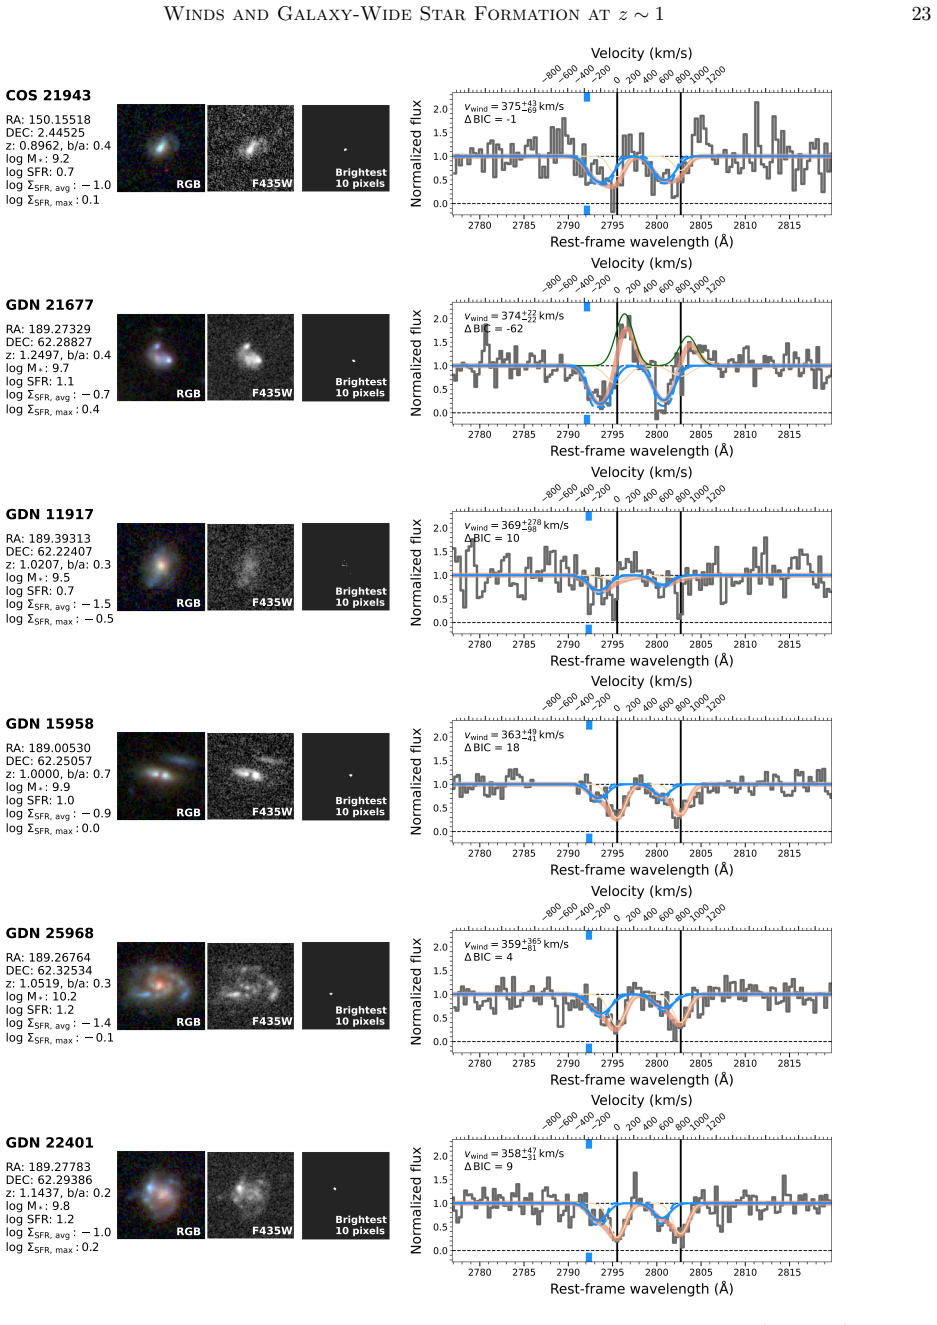
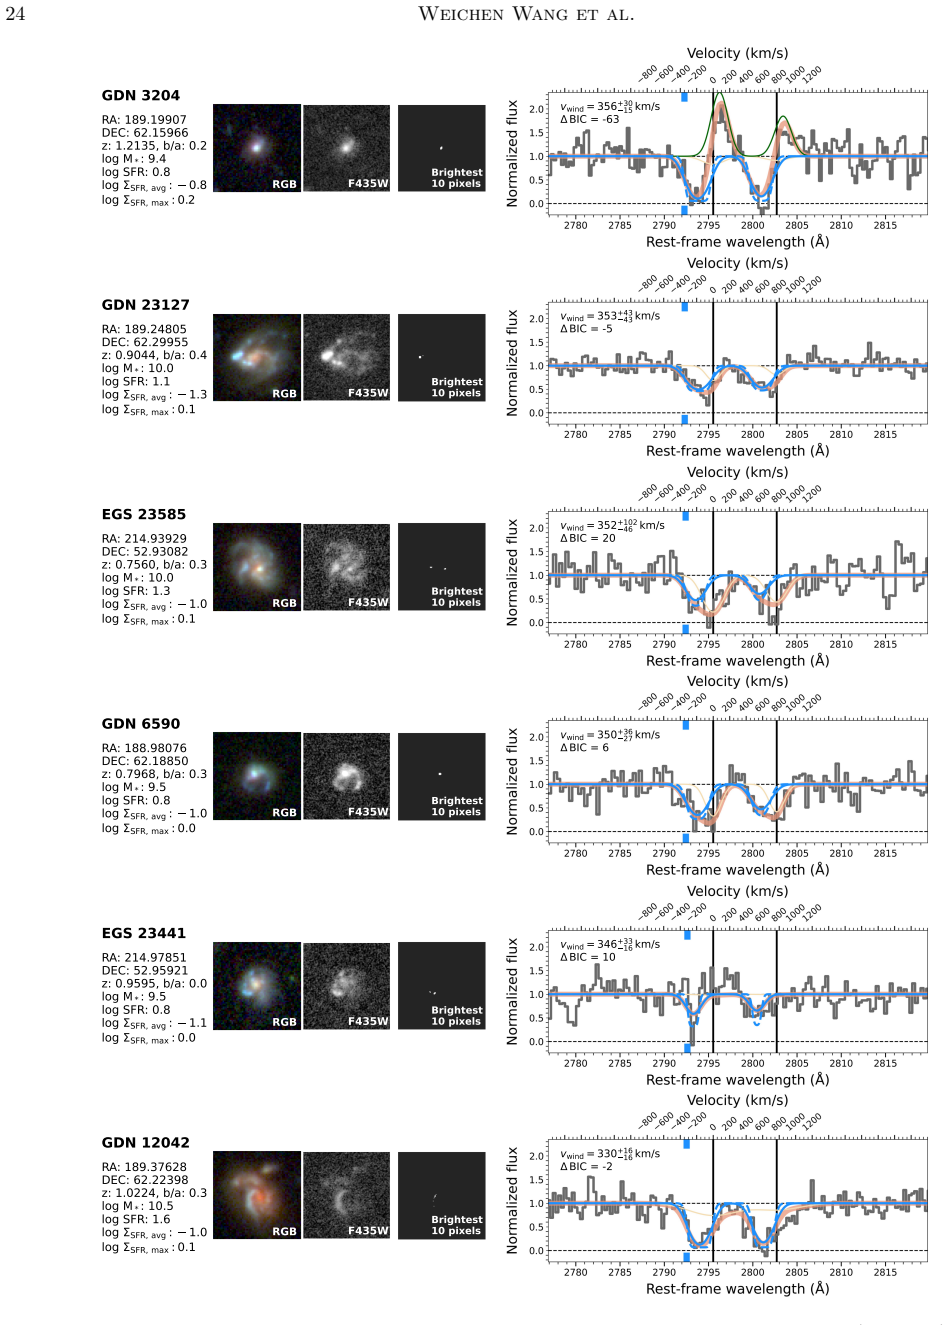
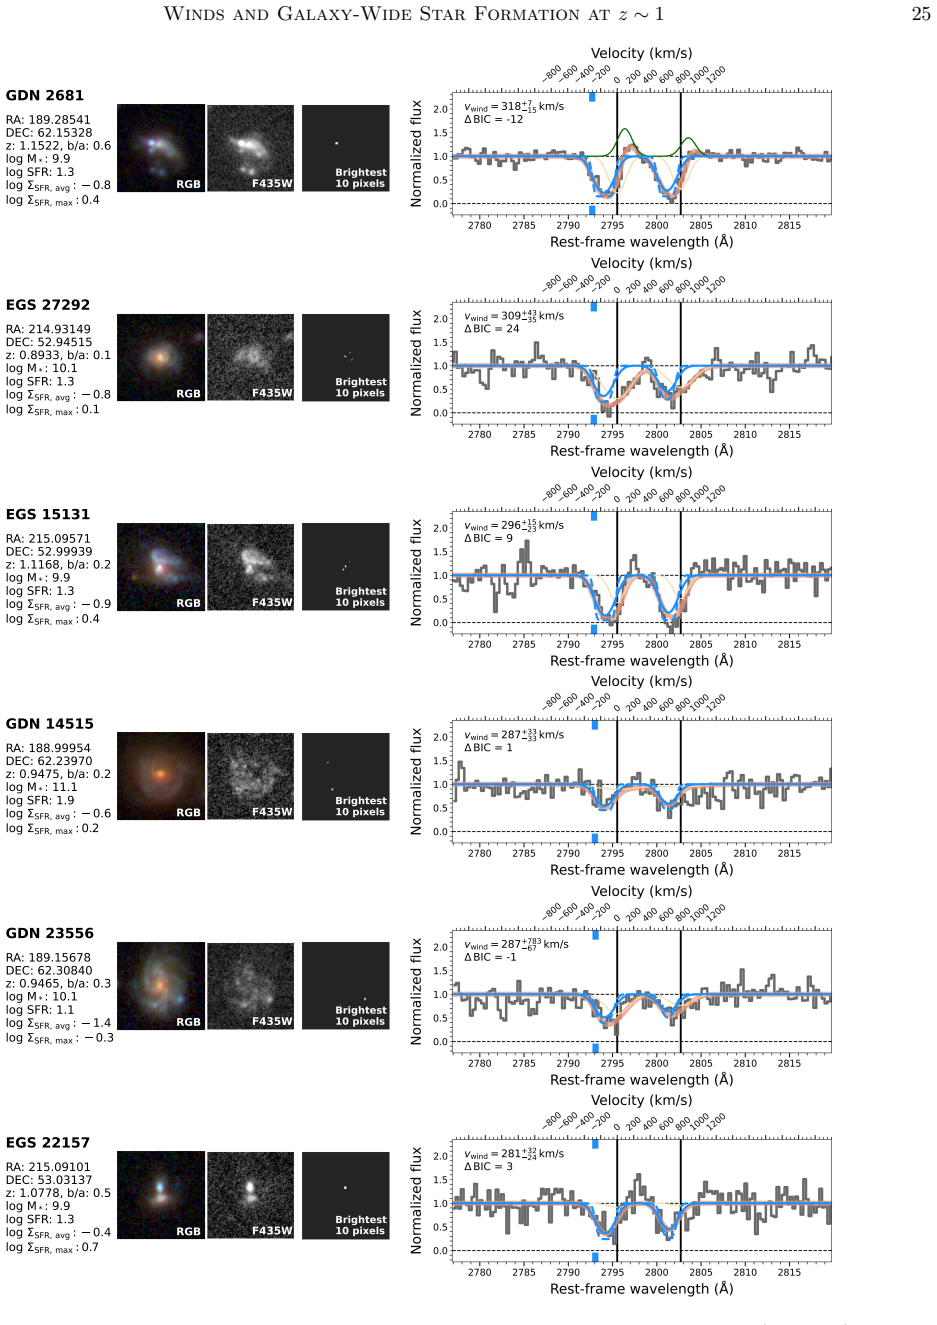
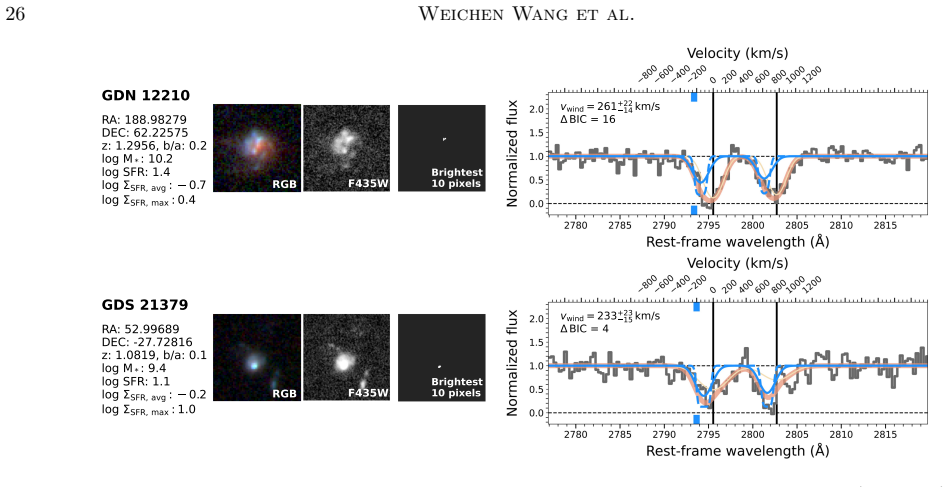
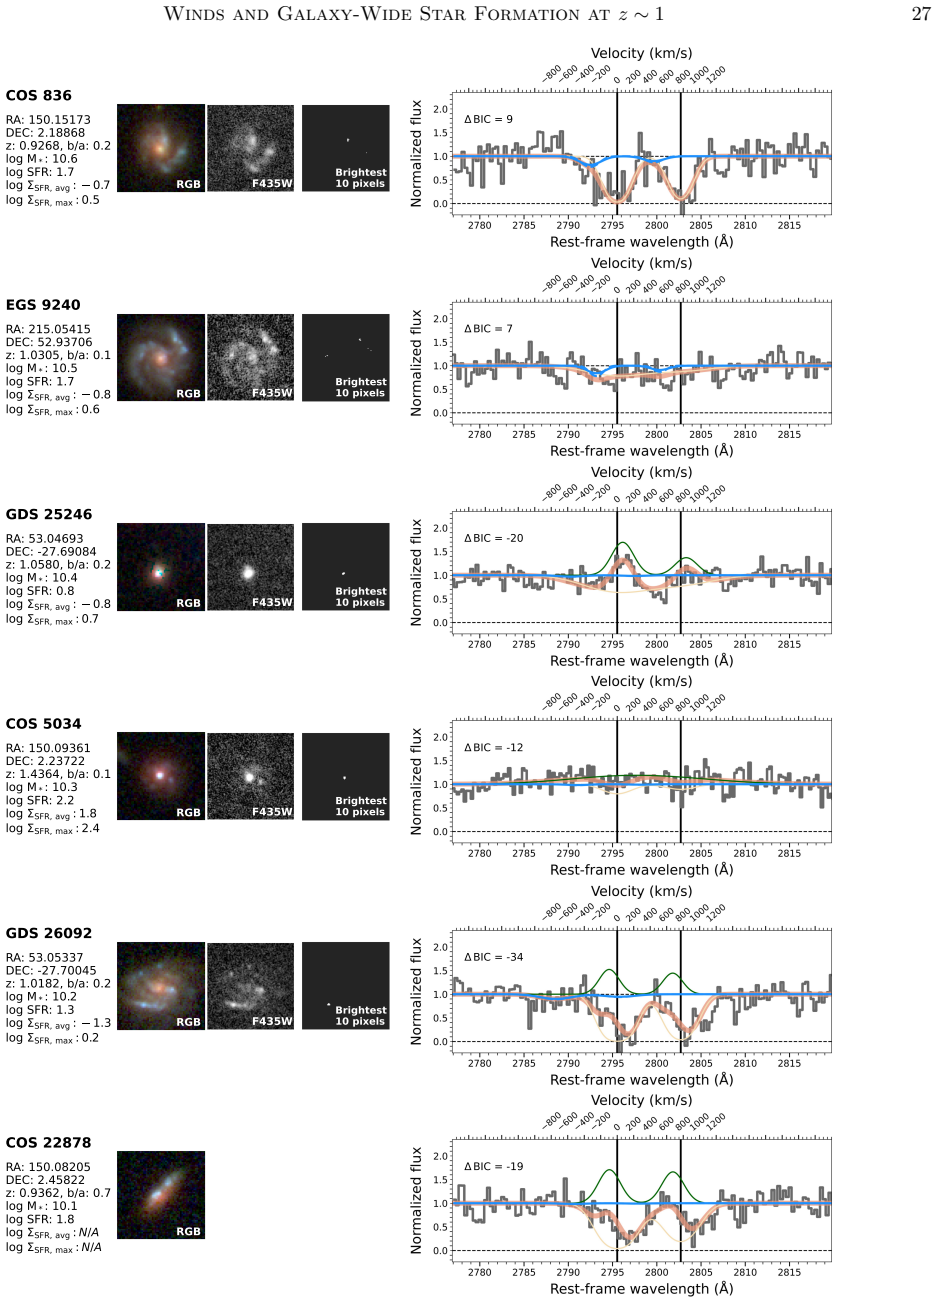
In 86 star-forming galaxies at z~1, winds traced by Mg II are found in 50 systems. Wind velocity follows log v_wind = 0.16 log SFR + 2.4, matching local starbursts over more than four orders of magnitude in SFR. The relation of v_wind to galaxy-wide Σ_SFR is not weaker than its relation to Σ_SFR measured only in compact regions, indicating that star formation throughout the galaxy drives the winds as bubbles from many sites combine their momentum to lift gas outward.
Load-bearing premise
The surface density of star formation measured in compact regions is determined accurately enough and can be compared directly to the galaxy-wide value to distinguish between driving mechanisms.
Editorial extensions
If this is right
- Wind velocity scales with total SFR in a single relation that applies from local starbursts through z~1 galaxies.
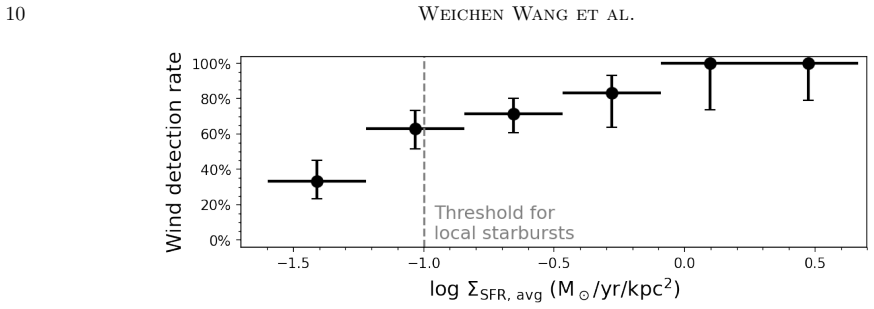
- Wind detection rate falls gradually near Σ_SFR of 0.1 solar masses per year per square kiloparsec rather than showing a sharp threshold.
- Winds tie more closely to total SFR than to stellar mass, specific SFR, or Σ_SFR alone.
- Momentum supplied by star-forming regions distributed across the galaxy can collectively lift entrained gas out of the system.
Reading between the lines
- Galaxy evolution models at high redshift may need to treat feedback as arising from distributed star formation rather than localized events to reproduce observed wind speeds.
- The spatial spread of star-forming regions could set an additional factor in how efficiently gas is expelled beyond what total SFR predicts.
- Combining high-resolution imaging with spectroscopy on individual galaxies could test whether more clumpy systems launch winds differently than smoother ones.
Editorial analysis
A structured set of objections, weighed in public.
Referee Report
Summary. The manuscript analyzes Mg II absorption-line profiles in deep Keck spectra of 86 star-forming galaxies at z~1 (M⋆ = 10^9.0–10^11.5 M⊙), detecting winds in 50 objects (58%). It reports correlations of wind velocity v_wind with SFR, Σ_SFR, and stellar mass; a unified v_wind–SFR relation with local starbursts (log v_wind = 0.16 log SFR + 2.4 at 3σ); and no stronger correlation of v_wind with Σ_SFR measured only in the most compact star-forming regions than with the galaxy-wide value. The central conclusion is that galaxy-wide star formation drives the winds, with momentum from distributed regions combining to lift gas.
Significance. If the correlation comparison is robust after accounting for measurement precision, the result would strengthen the case for distributed (rather than centrally concentrated) wind driving at cosmic noon and provide an observational anchor for the v_wind–SFR scaling seen in Illustris-TNG across four decades in SFR.
major comments (1)
- [Abstract, final paragraph] Abstract, final paragraph: the inference that galaxy-wide Σ_SFR drives winds because the compact-region Σ_SFR correlation is not stronger rests on the assumption that the two Σ_SFR estimators have comparable uncertainties and dynamic range. No error budget, covariance analysis, or control test equalizing measurement precision is reported; if compact Σ_SFR uncertainties are systematically larger (z~1 resolution, smaller areas, subjective region selection), the observed correlation coefficient is biased low even if compact regions dominate the driving.
minor comments (2)
- [Abstract] Abstract: individual v_wind and Σ_SFR measurements lack reported uncertainties; the 86-galaxy sample selection function and completeness are not quantified.
- [Abstract] Abstract: the statement that the wind detection rate shows a gradual decline around Σ_SFR = 0.1 M⊙ yr⁻¹ kpc⁻² would benefit from a quantitative threshold test or cumulative distribution comparison.
Simulated Author's Rebuttal
We thank the referee for their constructive feedback, which helps clarify the robustness of our conclusions regarding the role of galaxy-wide star formation in driving winds. We address the single major comment below and will incorporate revisions as noted.
read point-by-point responses
-
Referee: [Abstract, final paragraph] Abstract, final paragraph: the inference that galaxy-wide Σ_SFR drives winds because the compact-region Σ_SFR correlation is not stronger rests on the assumption that the two Σ_SFR estimators have comparable uncertainties and dynamic range. No error budget, covariance analysis, or control test equalizing measurement precision is reported; if compact Σ_SFR uncertainties are systematically larger (z~1 resolution, smaller areas, subjective region selection), the observed correlation coefficient is biased low even if compact regions dominate the driving.
Authors: We agree that a quantitative comparison of uncertainties between the galaxy-wide and compact-region Σ_SFR measurements is necessary to fully support the inference. The compact Σ_SFR values are derived from the same HST imaging and ground-based spectra used for the global measurements, with regions selected via a consistent surface-brightness threshold; however, we did not include an explicit error budget, covariance analysis, or noise-equalization test in the submitted manuscript. To address this, we will add a dedicated subsection in the revised Methods and Results that (1) quantifies the measurement uncertainties for both estimators (including contributions from resolution, area, and selection), (2) reports the dynamic ranges, and (3) performs a control test by injecting additional noise into the galaxy-wide Σ_SFR values to match the estimated precision of the compact measurements before recomputing the correlation coefficients. This will allow readers to assess whether the lack of a stronger compact correlation persists under equalized precision. revision: yes
Circularity Check
No circularity detected; relations are direct empirical measurements
full rationale
The paper performs an observational analysis of Mg II absorption in Keck spectra for 86 galaxies, reports wind detection rates, and measures correlations between v_wind and SFR/Σ_SFR/stellar mass directly from the data. The unified fit log v_wind = 0.16 log SFR + 2.4 is an empirical regression, not a derivation that reduces to its own inputs. The key test (no stronger correlation with compact-region Σ_SFR) is a straightforward comparison of observed correlation coefficients. No equations, ansatzes, or self-citations are invoked to force the central conclusion that galaxy-wide star formation drives the winds. The work is self-contained against external benchmarks and contains no load-bearing self-referential steps.
Assumptions & free parameters
assumptions (1)
- domain assumption Mg II line profiles can be reliably decomposed into wind components without significant contamination from inflows, rotation, or instrumental effects.
Cite this review
Pith. "Pith review of The Importance of Galaxy-Wide Star Formation in Driving Winds at z~1." pith.science (2026). https://pith.science/paper/FJNSGRQH
@misc{pith2026260610116,
  author       = {Pith},
  title        = {Pith review of: The Importance of Galaxy-Wide Star Formation in Driving Winds at z~1},
  year         = {2026},
  howpublished = {\url{https://pith.science/paper/FJNSGRQH}},
  note         = {Machine review of arXiv:2606.10116}
}
abstract
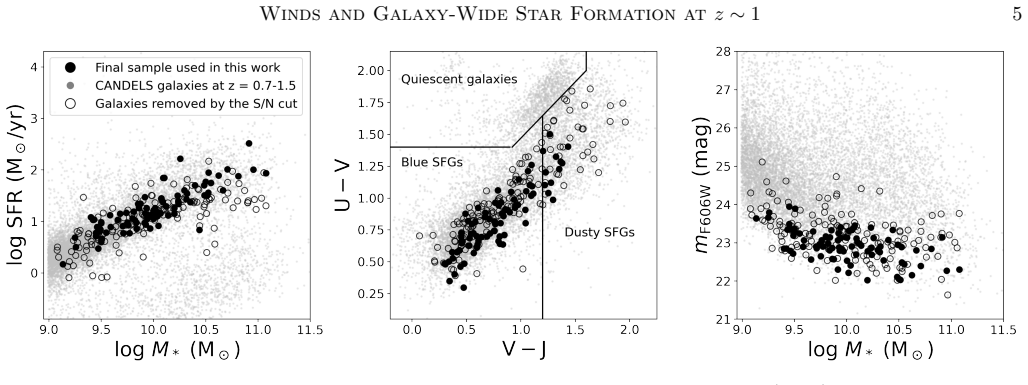
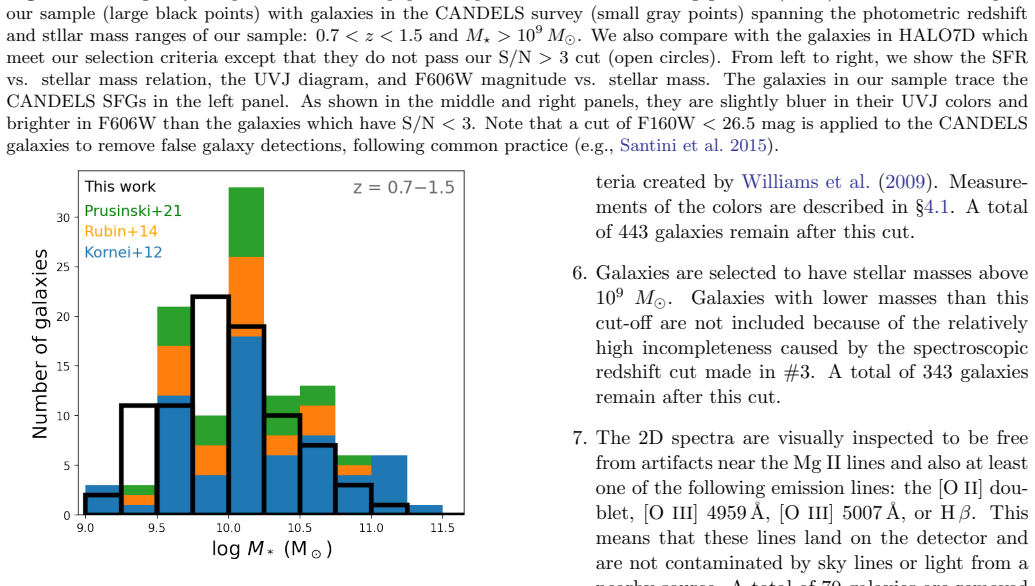
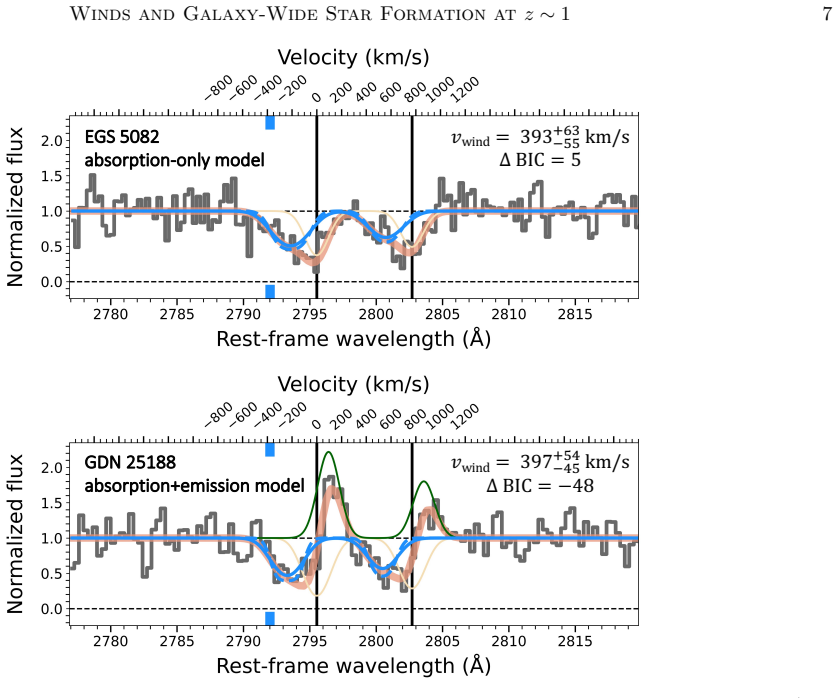
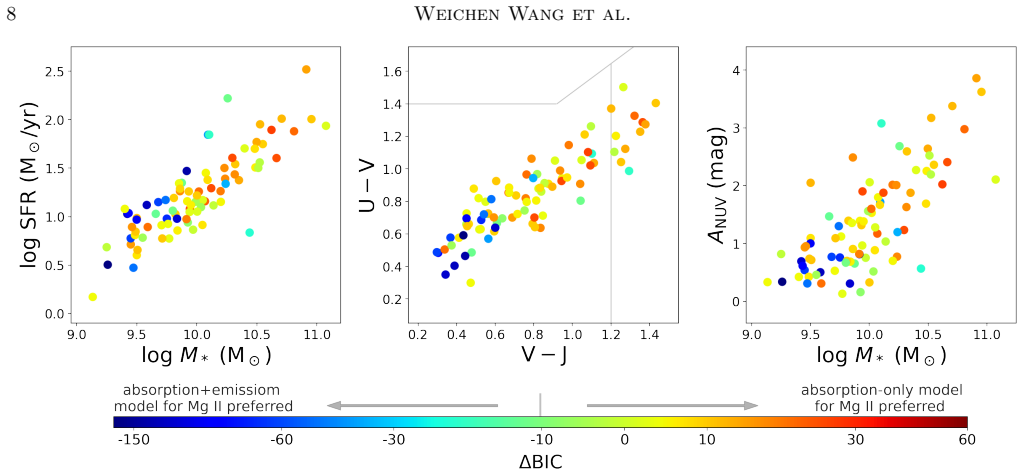
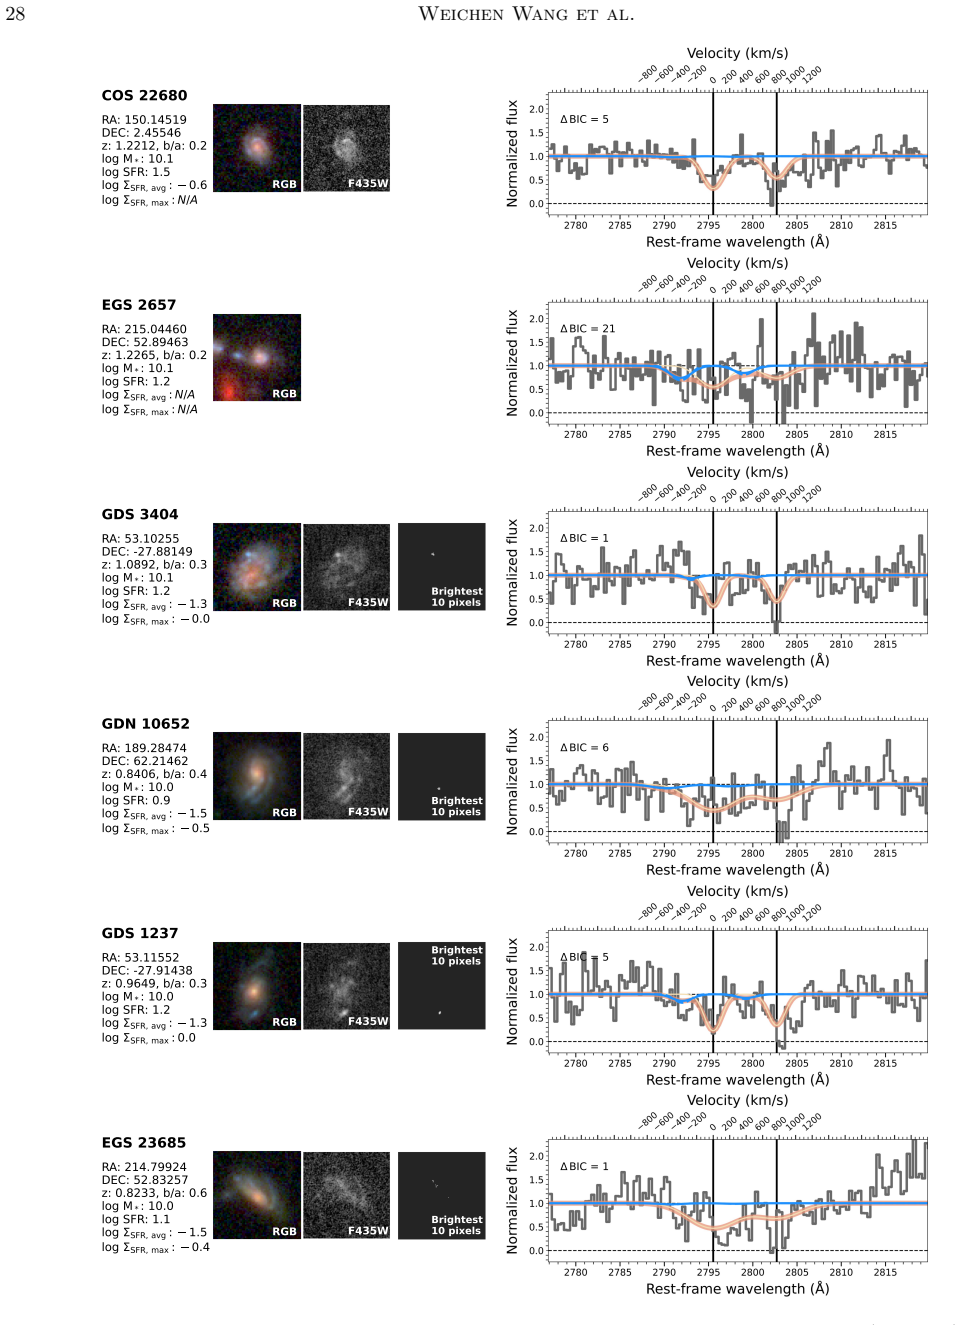
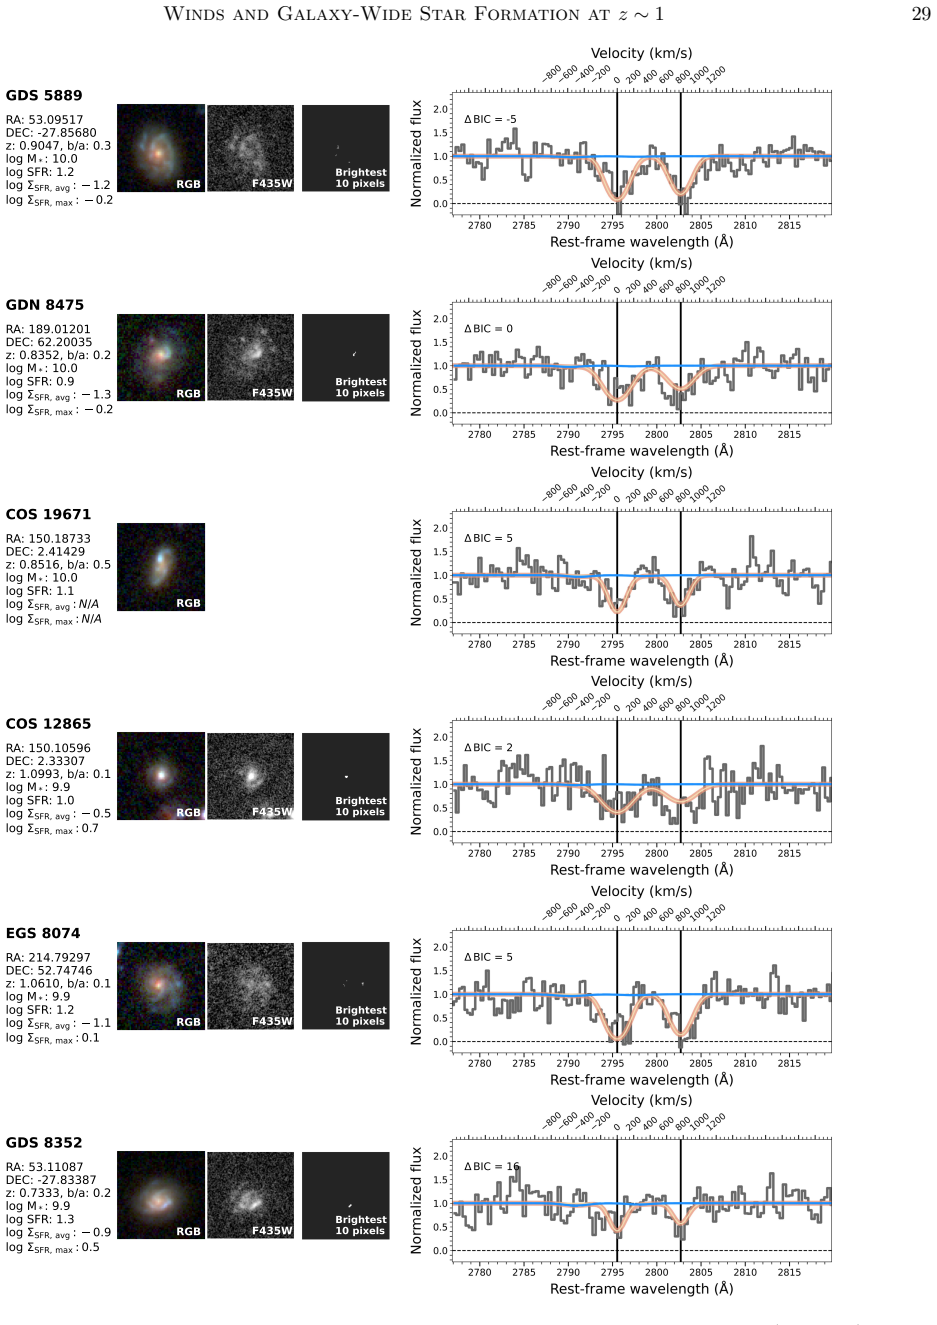
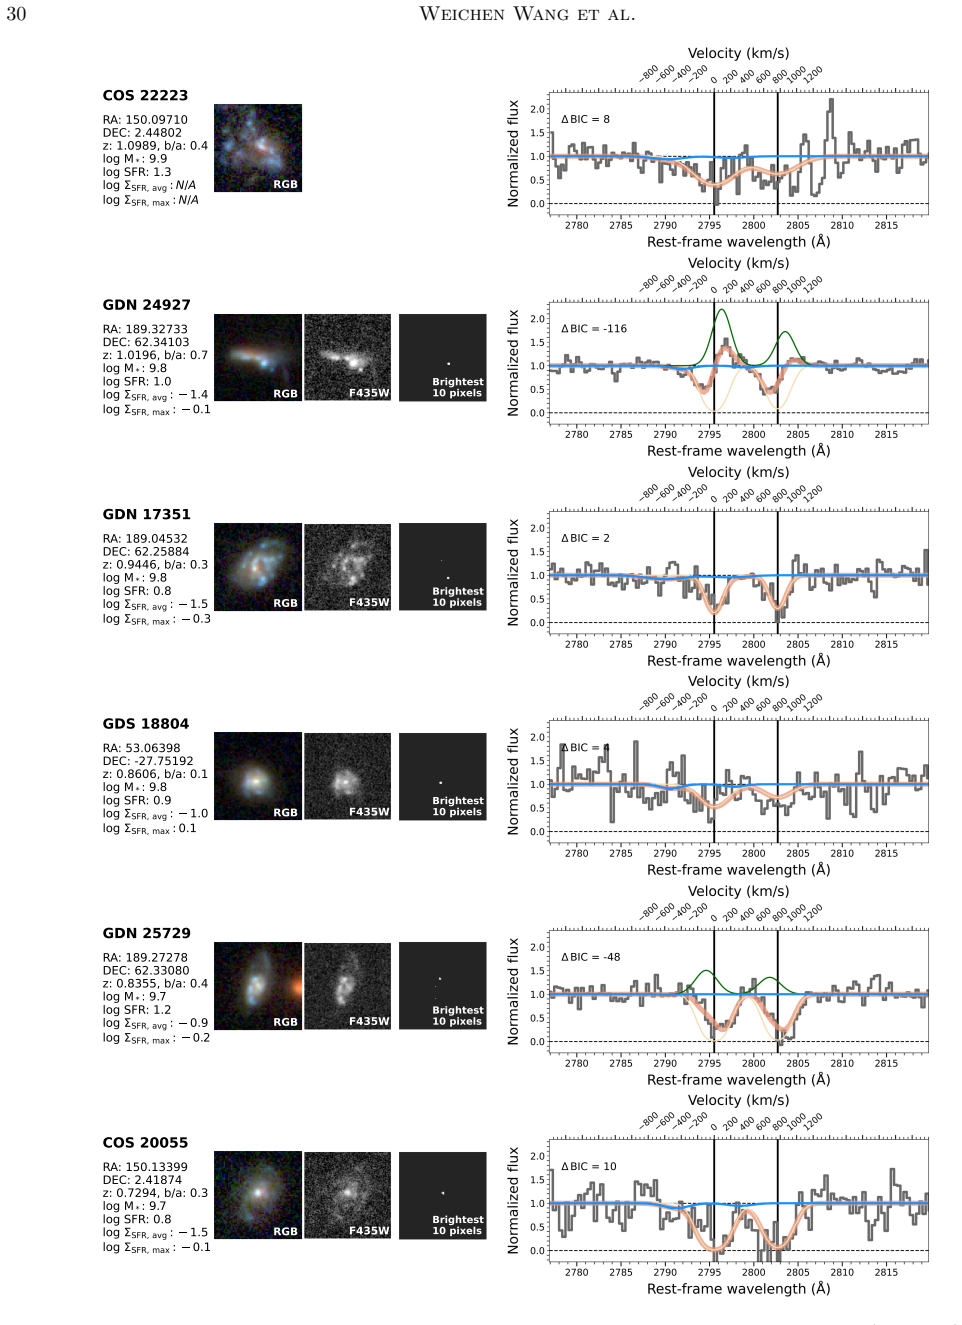
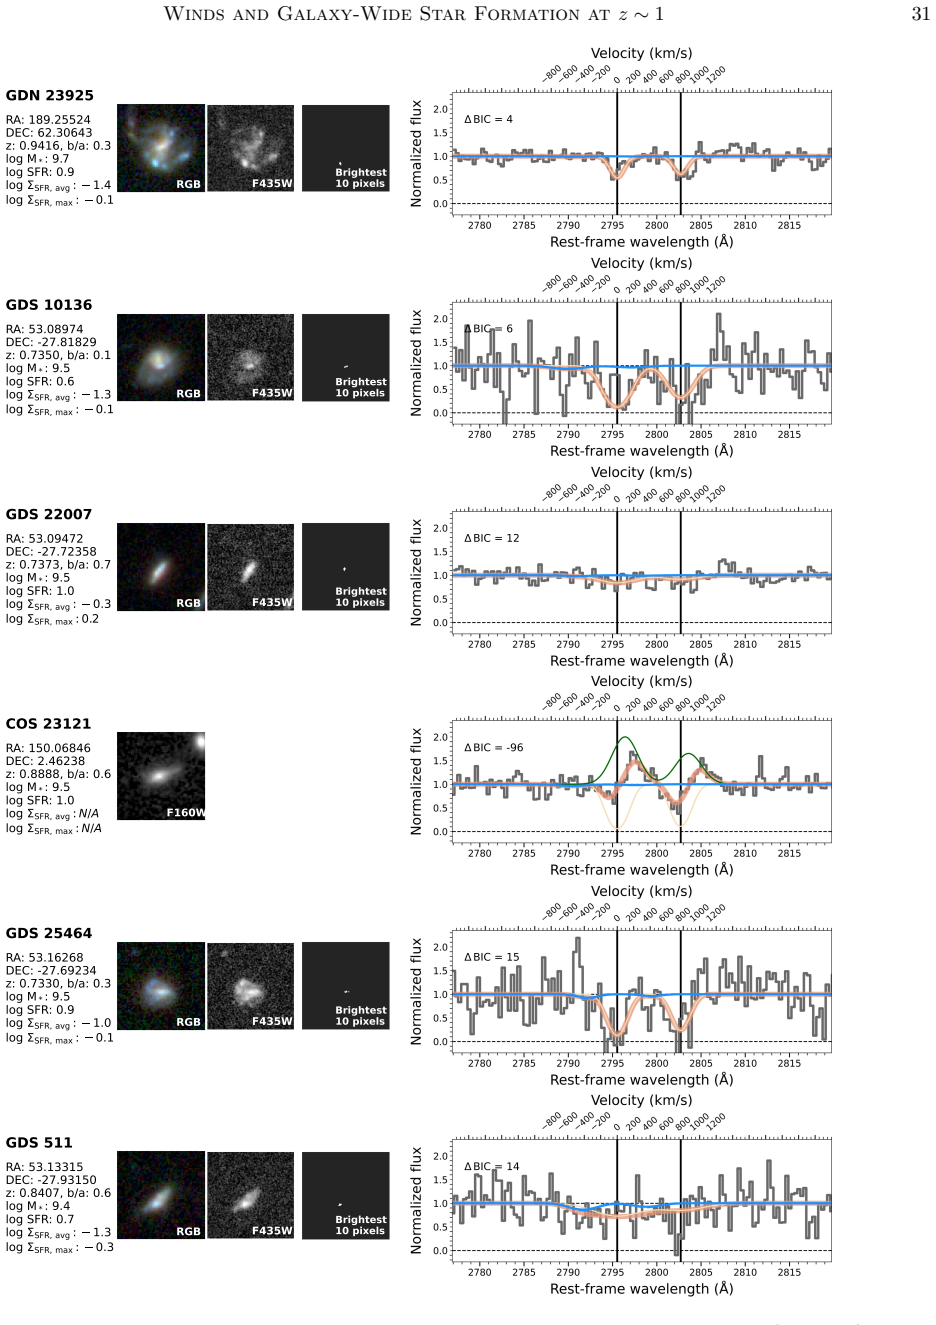
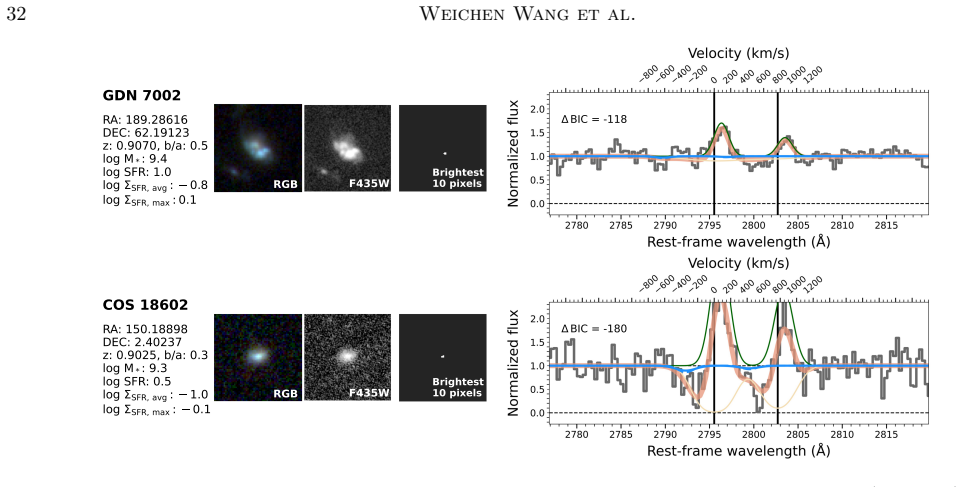
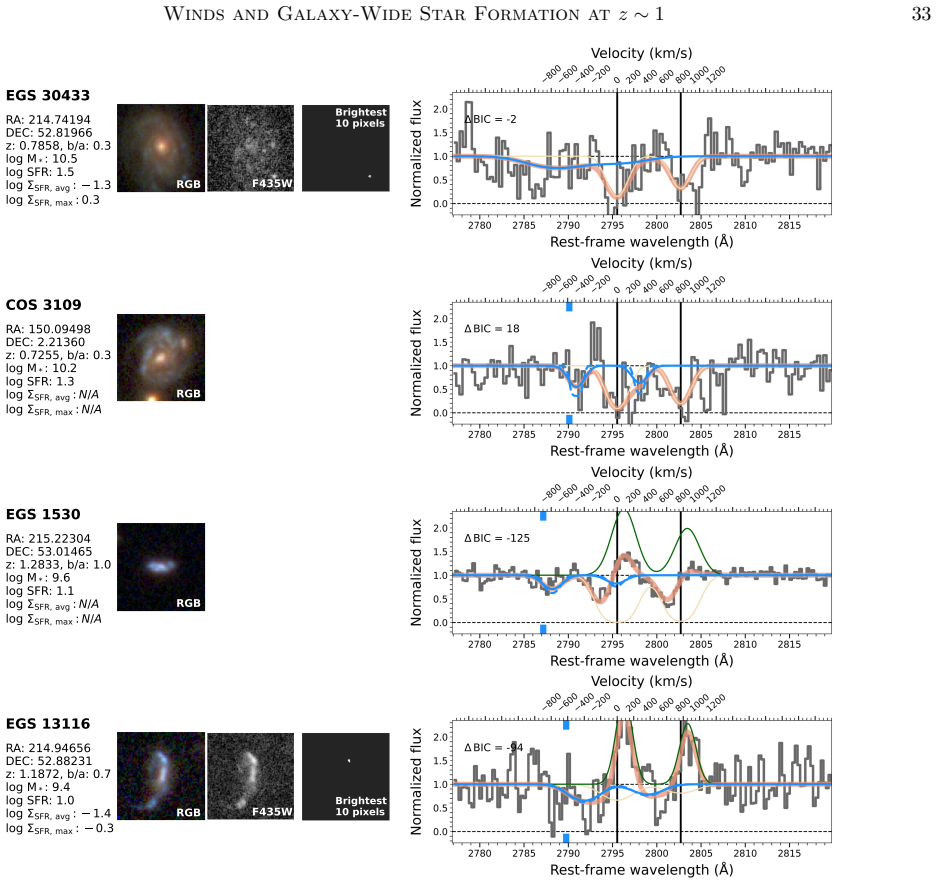
In this work, we study winds for a representative sample of 86 star-forming galaxies (SFGs) at z~1 with $M_\star = 10^{9.0}-10^{11.5} M_\odot$, by measuring the Mg II line profiles in deep Keck spectra. A total of 50 (58\%) are found to have winds. Unlike local starburst galaxies, the wind detection rate does not exhibit a threshold in star-formation rate (SFR) density $\Sigma_\mathrm{SFR}$ at 0.1 Msun/yr/kpc$^2$, but shows a gradual decline around this value. We find correlations between wind velocity $v_\mathrm{wind}$ and SFR, $\Sigma_\mathrm{SFR}$, and stellar mass, as per previous studies. Intriguingly, the z~1 SFGs appear to follow the same $v_\mathrm{wind}$-SFR relation as local starbursts. A combined fit gives: log $v_\mathrm{wind}$ = 0.16 log SFR + 2.4 (3-sigma significance). This unified relation spans over 4 dex in SFR and agrees with Illustris-TNG. No unified relation is found between $v_\mathrm{wind}$ and stellar mass, sSFR, or $\Sigma_\mathrm{SFR}$. This suggests winds might be most closely associated with SFR. We examine whether winds in z~1 SFGs are driven by their most compact star-forming regions. To do so, we consider whether the relation between $v_\mathrm{wind}$ and the $\Sigma_\mathrm{SFR}$ measured from only these regions is stronger than that for the galaxy-wide $\Sigma_\mathrm{SFR}$. We do not find a stronger correlation, suggesting that winds are most related to $\Sigma_\mathrm{SFR}$ of the entire galaxy. Collectively, these findings suggest a picture in which galaxy-wide star formation plays an important role in driving winds at z~1. Wind bubbles from all star-forming regions could combine momentum and help lift their entrained gas out of the galaxy.
Figures
Figures from the paper (23 more)
Reference graph
Works this paper leans on
-
[1]
Astropy Collaboration, Robitaille, T. P., Tollerud, E. J., et al. 2013, A&A, 558, A33, doi: 10.1051/0004-6361/201322068 Astropy Collaboration, Price-Whelan, A. M., Sip˝ ocz, B. M., et al. 2018, AJ, 156, 123, doi: 10.3847/1538-3881/aabc4f
-
[2]
R., Wuyts, S., F¨ orster Schreiber, N
Avery, C. R., Wuyts, S., F¨ orster Schreiber, N. M., et al. 2022, MNRAS, 511, 4223, doi: 10.1093/mnras/stac190
-
[3]
Barro, G., P´ erez-Gonz´ alez, P. G., Cava, A., et al. 2019, ApJS, 243, 22, doi: 10.3847/1538-4365/ab23f2
-
[4]
Berg, D. A., James, B. L., King, T., et al. 2022, ApJS, 261, 31, doi: 10.3847/1538-4365/ac6c03
-
[5]
Bertin, E., & Arnouts, S. 1996, A&AS, 117, 393, doi: 10.1051/aas:1996164
-
[6]
Bordoloi, R., Lilly, S. J., Knobel, C., et al. 2011, ApJ, 743, 10, doi: 10.1088/0004-637X/743/1/10
-
[7]
, archivePrefix = "arXiv", eprint =
Bordoloi, R., Lilly, S. J., Hardmeier, E., et al. 2014, ApJ, 794, 130, doi: 10.1088/0004-637X/794/2/130
-
[8]
2020, astropy/photutils: 1.0.0, 1.0.0 Zenodo, doi: 10.5281/zenodo.4044744
Bradley, L., Sip˝ ocz, B., Robitaille, T., et al. 2020, astropy/photutils: 1.0.0, 1.0.0, Zenodo, doi: 10.5281/zenodo.4044744
Show all 80 references
-
[9]
B., van Dokkum, P
Brammer, G. B., van Dokkum, P. G., & Coppi, P. 2008, ApJ, 686, 1503 Calabr` o, A., Pentericci, L., Talia, M., et al. 2022, A&A, 667, A117, doi: 10.1051/0004-6361/202244364
2008 doi
-
[10]
2011, PASA, 28, 128, doi: 10.1071/AS10046
Cameron, E. 2011, PASA, 28, 128, doi: 10.1071/AS10046
2011 doi
-
[11]
2003, PASP, 115, 763
Chabrier, G. 2003, PASP, 115, 763
2003
-
[12]
Y., Wel, A
Chang, Y. Y., Wel, A. V. D., Cunha, E. D., & Rix, H. W. 2015, ApJS, 219, 8, doi: 10.1088/0067-0049/219/1/8
2015 doi
-
[13]
A., & Clegg, A
Chevalier, R. A., & Clegg, A. W. 1985, Nature, 317, 44, doi: 10.1038/317044a0
1985 doi
-
[14]
2016, MNRAS, 462, 1415, doi: 10.1093/mnras/stw1756
Chevallard, J., & Charlot, S. 2016, MNRAS, 462, 1415, doi: 10.1093/mnras/stw1756
2016 doi
-
[15]
2016, ApJ, 819, 62, doi: 10.3847/0004-637X/819/1/62
Civano, F., Marchesi, S., Comastri, A., et al. 2016, ApJ, 819, 62, doi: 10.3847/0004-637X/819/1/62
2016 doi
-
[16]
2025, MNRAS, 537, 2535, doi: 10.1093/mnras/staf058
Claeyssens, A., Adamo, A., Messa, M., et al. 2025, MNRAS, 537, 2535, doi: 10.1093/mnras/staf058
2025 doi
-
[17]
2022, MNRAS, 513, 2535, doi: 10.1093/mnras/stac1026
Concas, A., Maiolino, R., Curti, M., et al. 2022, MNRAS, 513, 2535, doi: 10.1093/mnras/stac1026
2022 doi
-
[18]
C., Newman, J
Cooper, M. C., Newman, J. A., Davis, M., Finkbeiner, D. P., & Gerke, B. F. 2012, spec2d: DEEP2 DEIMOS Spectral Pipeline. http://ascl.net/1203.003
2012
-
[19]
C., Deason, A
Cunningham, E. C., Deason, A. J., Rockosi, C. M., et al. 2019a, ApJ, 876, 124, doi: 10.3847/1538-4357/ab16cb
-
[20]
C., Deason, A
Cunningham, E. C., Deason, A. J., Sanderson, R. E., et al. 2019b, ApJ, 879, 120, doi: 10.3847/1538-4357/ab24cd de la Vega, A., Kassin, S. A., Pacifici, C., et al. 2025, ApJ, 980, 168, doi: 10.3847/1538-4357/ada8a2
2025 doi
-
[21]
L., Koekemoer, A
Donley, J. L., Koekemoer, A. M., Brusa, M., et al. 2012, ApJ, 748, 142
2012
-
[22]
K., Quider, A
Erb, D. K., Quider, A. M., Henry, A. L., & Martin, C. L. 2012, ApJ, 759, 26, doi: 10.1088/0004-637X/759/1/26
2012 doi
-
[23]
M., Phillips, A
Faber, S. M., Phillips, A. C., Kibrick, R. I., et al. 2003, in SPIE Conference Series, Vol. 4841, Instrument Design and Performance for Optical/Infrared Ground-based Telescopes, ed. M. Iye & A. F. M. Moorwood, 1657–1669
2003
-
[24]
2018, A&A, 617, A62
Feltre, A., Bacon, R., Tresse, L., et al. 2018, A&A, 617, A62
2018
-
[25]
W., Lang, D., & Goodman, J
Foreman-Mackey, D., Hogg, D. W., Lang, D., & Goodman, J. 2013, PASP, 125, 306, doi: 10.1086/670067
2013 doi
-
[26]
2019, Journal of Open Source Software, 4, 1864, doi: 10.21105/joss.01864
Foreman-Mackey, D., Farr, W., Sinha, M., et al. 2019, Journal of Open Source Software, 4, 1864, doi: 10.21105/joss.01864
2019 doi
-
[27]
C., Koekemoer, A
Giavalisco, M., Ferguson, H. C., Koekemoer, A. M., et al. 2004, ApJL, 600, L93, doi: 10.1086/379232
2004 doi
-
[28]
A., Kocevski, D
Grogin, N. A., Kocevski, D. D., Faber, S. M., et al. 2011, ApJS, 197, 35
2011
-
[29]
Koekemoer, A. M. 2012, ApJ, 757, 120, doi: 10.1088/0004-637X/757/2/120
2012 doi
-
[30]
C., Bell, E
Guo, Y., Ferguson, H. C., Bell, E. F., et al. 2015, ApJ, 800, 39, doi: 10.1088/0004-637X/800/1/39
2015 doi
-
[31]
2015, ApJ, 809, 147, doi: 10.1088/0004-637X/809/2/147
Overzier, R., & Leitherer, C. 2015, ApJ, 809, 147, doi: 10.1088/0004-637X/809/2/147
2015 doi
-
[32]
M., Armus, L., & Miley, G
Heckman, T. M., Armus, L., & Miley, G. K. 1990, ApJS, 74, 833, doi: 10.1086/191522
1990 doi
-
[33]
M., & Borthakur, S
Heckman, T. M., & Borthakur, S. 2016, ApJ, 822, 9, doi: 10.3847/0004-637X/822/1/9
2016 doi
-
[34]
W., Bovy, J., & Lang, D
Hogg, D. W., Bovy, J., & Lang, D. 2010, arXiv e-prints, arXiv:1008.4686. https://arxiv.org/abs/1008.4686
2010 arXiv
-
[35]
E., Sanders, R
Kehoe, E., Shapley, A. E., Sanders, R. L., et al. 2025, ApJ, 994, 170, doi: 10.3847/1538-4357/ae10b3
2025 doi
-
[36]
C., & Evans, N
Kennicutt, R. C., & Evans, N. J. 2012, ARA&A, 50, 531, doi: 10.1146/annurev-astro-081811-125610
2012 doi
-
[37]
M., Faber, S
Koekemoer, A. M., Faber, S. M., Ferguson, H. C., et al. 2011, ApJS, 197, 36
2011
-
[38]
A., Shapley, A
Kornei, K. A., Shapley, A. E., Martin, C. L., et al. 2012, ApJ, 758, doi: 10.1088/0004-637X/758/2/135
2012 doi
-
[39]
A., Shapley, A
Kornei, K. A., Shapley, A. E., Martin, C. L., et al. 2013, ApJ, 774, 50, doi: 10.1088/0004-637X/774/1/50
2013 doi
-
[40]
Liddle, A. R. 2007, MNRAS, 377, L74, doi: 10.1111/j.1745-3933.2007.00306.x
2007 doi
-
[41]
N., Xue, Y
Luo, B., Brandt, W. N., Xue, Y. Q., et al. 2017, ApJS, 228, 2, doi: 10.3847/1538-4365/228/1/2
2017 doi
-
[42]
2026, ApJL, 1000, L3, doi: 10.3847/2041-8213/ae48ee
Lyu, C., Yu, H., Wang, E., et al. 2026, ApJL, 1000, L3, doi: 10.3847/2041-8213/ae48ee
2026 doi
-
[43]
2014, ARA&A, 52, 415
Madau, P., & Dickinson, M. 2014, ARA&A, 52, 415
2014
-
[44]
L., Shapley, A
Martin, C. L., Shapley, A. E., Coil, A. L., et al. 2012, ApJ, 760, 127, doi: 10.1088/0004-637X/760/2/127 Winds and Galaxy-Wide Star Formation atz∼1 35
2012 doi
-
[45]
J., & Jarvis, M
McLure, R. J., & Jarvis, M. J. 2002, MNRAS, 337, 109, doi: 10.1046/j.1365-8711.2002.05871.x
2002 doi
-
[46]
C., et al
Mobasher, B., Dahlen, T., Ferguson, H. C., et al. 2015, ApJ, 808, 101, doi: 10.1088/0004-637X/808/1/101
2015 doi
-
[47]
S., Aird, J
Nandra, K., Laird, E. S., Aird, J. A., et al. 2015, ApJS, 220, 10, doi: 10.1088/0067-0049/220/1/10
2015 doi
-
[48]
2019, MNRAS, 490, 3234, doi: 10.1093/mnras/stz2306
Nelson, D., Pillepich, A., Springel, V., et al. 2019, MNRAS, 490, 3234, doi: 10.1093/mnras/stz2306
2019 doi
-
[49]
A., Cooper, M
Newman, J. A., Cooper, M. C., Davis, M., et al. 2013, ApJS, 208, 5
2013
- [50]
-
[51]
2012, MNRAS, 421, 2002, doi: 10.1111/j.1365-2966.2012.20431.x
Pacifici, C., Charlot, S., Blaizot, J., & Brinchmann, J. 2012, MNRAS, 421, 2002, doi: 10.1111/j.1365-2966.2012.20431.x
2012 doi
-
[52]
2015, MNRAS, 447, 786, doi: 10.1093/mnras/stu2447
Pacifici, C., da Cunha, E., Charlot, S., et al. 2015, MNRAS, 447, 786, doi: 10.1093/mnras/stu2447
2015 doi
-
[53]
A., Weiner, B
Pacifici, C., Kassin, S. A., Weiner, B. J., et al. 2016, ApJ, 832, 79, doi: 10.3847/0004-637x/832/1/79
2016 doi
-
[54]
G., Mobasher, B., et al
Pacifici, C., Iyer, K. G., Mobasher, B., et al. 2023, ApJ, 944, 141, doi: 10.3847/1538-4357/acacff
2023 doi
-
[55]
R., & Reeder, K
Peck, E. R., & Reeder, K. 1972, Journal of the Optical Society of America, 62, 958, doi: 10.1364/JOSA.62.000958
1972 doi
-
[56]
B., et al
Pharo, J., Guo, Y., Calvo, G. B., et al. 2022, ApJS, 261, 12, doi: 10.3847/1538-4365/ac6cdf
2022 doi
-
[57]
X., Kasen, D., & Rubin, K
Prochaska, J. X., Kasen, D., & Rubin, K. 2011, ApJ, 734, 24
2011
-
[58]
Z., Erb, D
Prusinski, N. Z., Erb, D. K., & Martin, C. L. 2021, AJ, 161, 212, doi: 10.3847/1538-3881/abe85b
2021 doi
-
[59]
F., Lotz, J
Rodriguez-Gomez, V., Snyder, G. F., Lotz, J. M., et al. 2019, MNRAS, 483, 4140, doi: 10.1093/mnras/sty3345
2019 doi
-
[60]
Rubin, K. H. R., Prochaska, J. X., Koo, D. C., et al. 2014, ApJ, 794, 156, doi: 10.1088/0004-637X/794/2/156
2014 doi
-
[61]
Rubin, K. H. R., Weiner, B. J., Koo, D. C., et al. 2010, ApJ, 719, 1503, doi: 10.1088/0004-637X/719/2/1503
2010 doi
-
[62]
C., Fontana, A., et al
Santini, P., Ferguson, H. C., Fontana, A., et al. 2015, ApJ, 801, 97
2015
-
[63]
1978, Annals of Statistics, 6, 461
Schwarz, G. 1978, Annals of Statistics, 6, 461
1978
-
[64]
S., & Dav´ e, R
Somerville, R. S., & Dav´ e, R. 2015, ARA&A, 53, 51, doi: 10.1146/annurev-astro-082812-140951
2015 doi
-
[65]
1978, Physical processes in the interstellar medium, doi: 10.1002/9783527617722
Spitzer, L. 1978, Physical processes in the interstellar medium, doi: 10.1002/9783527617722
1978 doi
-
[66]
2017, ApJ, 850, 51, doi: 10.3847/1538-4357/aa956d
Sugahara, Y., Ouchi, M., Lin, L., et al. 2017, ApJ, 850, 51, doi: 10.3847/1538-4357/aa956d
2017 doi
-
[67]
M., Harrison, C
Swinbank, A. M., Harrison, C. M., Tiley, A. L., et al. 2019, MNRAS, 487, 381, doi: 10.1093/mnras/stz1275
2019 doi
-
[68]
A., & Heckman, T
Thompson, T. A., & Heckman, T. M. 2024, ARA&A, 62, 529, doi: 10.1146/annurev-astro-041224-011924 van der Wel, A., Bell, E. F., H¨ aussler, B., et al. 2012, ApJS, 203, 24 van der Wel, A., Franx, M., van Dokkum, P. G., et al. 2014, ApJ, 788, 28, doi: 10.1088/0004-637X/788/1/28
2024 doi
-
[69]
M., Liu, F
Wang, W., Faber, S. M., Liu, F. S., et al. 2017, MNRAS, 469, 4063, doi: 10.1093/mnras/stx1148
2017 doi
-
[70]
A., Pacifici, C., et al
Wang, W., Kassin, S. A., Pacifici, C., et al. 2018, ApJ, 869, 161, doi: 10.3847/1538-4357/aaef79
2018 doi
-
[71]
A., Faber, S
Wang, W., Kassin, S. A., Faber, S. M., et al. 2022, ApJ, 930, 146, doi: 10.3847/1538-4357/ac6592
2022 doi
-
[72]
I., Smith, B
Wang, X., Teplitz, H. I., Smith, B. M., et al. 2025, ApJ, 980, 74, doi: 10.3847/1538-4357/ada4ab
2025 doi
-
[73]
J., Willmer, C
Weiner, B. J., Willmer, C. N. A., Faber, S. M., et al. 2006, ApJ, 653, 1049, doi: 10.1086/508922
2006 doi
-
[74]
J., Coil, A
Weiner, B. J., Coil, A. L., Prochaska, J. X., et al. 2009, ApJ, 692, 187
2009
-
[75]
E., Franx, M., Leja, J., et al
Whitaker, K. E., Franx, M., Leja, J., et al. 2014, ApJ, 795, 104
2014
-
[76]
J., Quadri, R
Williams, R. J., Quadri, R. F., Franx, M., van Dokkum, P., & Labb´ e, I. 2009, ApJ, 691, 1879
2009
-
[77]
2022, ApJ, 933, 222, doi: 10.3847/1538-4357/ac6d56
Xu, X., Heckman, T., Henry, A., et al. 2022, ApJ, 933, 222, doi: 10.3847/1538-4357/ac6d56
2022 doi
-
[78]
Q., Luo, B., Brandt, W
Xue, Y. Q., Luo, B., Brandt, W. N., et al. 2016, ApJS, 224, 15, doi: 10.3847/0067-0049/224/2/15 —. 2011, ApJS, 195, 10, doi: 10.1088/0067-0049/195/1/10
2016 doi
-
[79]
M., Koo, D
Yesuf, H. M., Koo, D. C., Faber, S. M., et al. 2017, ApJ, 841, 83
2017
-
[80]
B., Comparat, J., Kneib, J
Zhu, G. B., Comparat, J., Kneib, J. P., et al. 2015, ApJ, 815, 48, doi: 10.1088/0004-637X/815/1/48
2015 doi
Reviewed June 27, 2026 · model on record in the stance chip above.
Discussion (0). Sign in to comment.