REVIEW 3 major objections 5 minor 72 references
Flint: A Semantics-Driven Data Visualization Intermediate Language
T0 review · 3 major / 5 minor · reviewed 2026-08-01 · deepseek-v4-flash
Pith's one-line read Flint claims that chart intent can be expressed as a concise combination of data semantics and chart type, with a compiler generating fully configured executable specifications for Vega-Lite, ECharts, and Chart.js.
desk verdict Flint is a genuinely novel semantic IR for visualization, but the 'no quality loss' claim is undercut by an unvalidated LLM grader—still worth refereeing. read the letter →
The pith
A machine-rendered reading of the paper's core claim, the machinery that carries it, and where it could break.
The reading
What carries the argument
The hierarchical semantic type system is the load-bearing object: 6 L1 semantic domains, 15 L2 families, and 44 L3 leaf types, each carrying inherited compilation decisions about parsing, encoding candidates, zero baseline, aggregation role, diverging class, domain shape, and display formatter. It is consumed by a three-stage compiler—semantics resolution, layout optimization, and backend code generation—which treats data as part of the program and recompiles when data changes. This type system converts implicit low-level decisions into explicit, reusable semantic facts, allowing the compiler to resolve each field–channel–chart combination consistently across backends.
What would settle it
Run a human rating study on a stratified sample of the 315 chart pairs used in the paper, asking participants to answer the original question from each chart and rate design quality; compare human win rates between Flint and direct-Vega-Lite outputs. If human preference does not track the vision-language judge's wins, the claim that Flint preserves visual quality fails.
Extended reading notes
Core claim
The central discovery is that making data semantics first-class—rather than inferred from raw values—lets a compiler systematically derive the low-level parameters that currently force a trade-off between simple-but-broken defaults and verbose, fragile hand-tuned specifications. Flint formalizes a three-level semantic type hierarchy: Level 1 determines how raw values are parsed, Level 2 determines aggregation, zero-baseline, and domain behavior, and Level 3 refines formatting, ordering, and divergence. The compiler uses these types, together with optional intrinsic domains and midpoints, to resolve encoding properties, optimize layout under canvas constraints, and generate backend-native spe
Load-bearing premise
The load-bearing premise is that a vision-language model's scores on rendered charts accurately measure visualization quality; if those scores are biased toward either agent's output style, the paper's evidence that Flint preserves visual quality does not transfer to real users.
Editorial extensions
If this is right
- Specifications become much shorter—in the paper's case study, 85% shorter than native backend code—and edits such as swapping a field or changing chart type no longer involve rewriting low-level parameters.
- The same high-level spec produces executable charts for Vega-Lite, Apache ECharts, and Chart.js, so users can switch rendering backends without changing intent.
- LLM chart agents that emit Flint specs outperform agents that emit Vega-Lite directly under an automated vision-language judge, with the gap widening for smaller LLMs, suggesting a practical route to more reliable natural-language-to-visualization systems.
- Because the compiler recompiles when data changes and encodes design knowledge as deterministic passes, charts remain readable across changes in cardinality, density, and layout without user intervention.
Reading between the lines
- Editorial inference: if semantic typing holds, recommendation engines now built on physical data types could move up one level to chart type and encoding choices, delegating layout and formatting to the compiler and potentially reducing the need for exhaustive constraint models.
- Editorial inference: the automated-judge evaluation may not reflect human preferences for complex or layered charts; a head-to-head human study on a sample of the 315 chart pairs would test whether 'no compromise on visual quality' transfers from the vision-language model to people.
- Editorial inference: the hierarchy's inheritance design hints at a shared cross-tool registry of semantic field types, like a type system for data semantics in analytics platforms, but real adoption depends on how reliably LLMs and humans assign types to messy, ambiguous columns.
Editorial analysis
A structured set of objections, weighed in public.
Referee Report
Summary. Flint is an intermediate language and compiler for data visualization. It separates a dataSpec (hierarchical semantic types, intrinsic domains, midpoints) from a chartSpec (chart type, simple encoding bindings), compiles them into an abstract context, optimizes layout, and generates executable Vega-Lite/ECharts/Chart.js specifications. The paper argues that explicit data semantics let the compiler derive low-level configurations (parsing, axes, scales, aggregation, formatting, layout) that would otherwise be hard-coded, making specifications shorter, more robust to edits, and easier for LLM agents to produce. Evaluation consists of a case study, a 30-chart gallery across backends, and a head-to-head comparison in which a Flint agent and a Direct Vega-Lite agent generate charts for questions on TidyTuesday 2025 datasets, scored by a vision-language model following the VisEval protocol. The main empirical claims are that Flint specs are about 85% shorter than native backend code and that Flint-generated charts win more often than DirectVL.
Significance. The design ideas are valuable: making data semantics first-class, separating intent from low-level parameters, and using deterministic compiler passes rather than prompt-tuned LLM defaults is a credible direction for visualization tooling. The modular architecture (frontend/optimizer/code generator) and the three real backends are concrete contributions, and the gallery/demonstration shows broad chart coverage. If the quality claim were supported by valid evaluation, this would be a useful system paper for both visualization and LLM-agent communities. The code and detailed prompts in the appendix improve reproducibility. The central weakness is evaluative, not architectural: the only quantitative evidence for 'without compromising on visual quality' is an unvalidated vision-language-model grader, and the paper itself documents a counterexample in which that grader's judgment is wrong. The human authoring claim is similarly supported only by anecdote plus an unmeasured length reduction.
major comments (3)
- [§6.2, Table 3; Appendix E, Example 5] The abstract's 'without compromising on visual quality' claim rests entirely on the vision-language-model grader. The paper itself shows in Appendix E, Example 5 that this grader misjudges the outputs: Flint's faithful grouped bar chart receives 10 while DirectVL's incorrect faceted stacked bar receives 13. Table 3 also shows small win margins (e.g., GPT-5.1: 41% vs 38%, p=0.05). Since the grader may systematically prefer the compiler-normalized Flint output, the observed win rates do not by themselves establish a quality advantage. Please validate the grader against human expert ratings on a stratified sample of question–chart pairs (e.g., correlation/agreement), and report agreement. Alternatively, either weaken the abstract's quality claim to 'comparable' or remove it.
- [§6.1] The claim that Flint 'simplifies the authoring process' for humans is supported by one synthetic case study and the unmeasured statement that specifications were 'on average 85% shorter' than native backend code. No definition of the length metric (tokens, characters, JSON nodes?), sample over which the average is computed, or distribution is provided. For a human-centered venue, this is a central claim that needs either a small user study (e.g., task completion time/error rate for editing specs) or a precisely defined, reproducible specification-size metric. Without that, the 'concise' and 'simplifies authoring' conclusions are not independently verifiable.
- [§6.2 and Appendix D] The evaluation deliberately replaces the VisEval benchmark with a new TidyTuesday pipeline in which gpt-5.1 generates the questions and also grades the charts. There is no human check on question quality/answerability or on grader reliability for the new corpus beyond the single admitted counterexample in Appendix E. Because the question and scoring models come from the same family as the Flint agent (GPT-5.1), the loop is not neutral with respect to the compared conditions. Please provide human validation of a sample of generated questions and of the VLM scores, so that the reported p-values can be interpreted as evidence about chart quality rather than about grader preferences.
minor comments (5)
- [§4.2 / Figure 6] The schema uses 'semanticType' while the running examples use 'type' and the LLM prompt uses 'semantic_type'. Standardizing this notation would improve readability.
- [Table 3] Report confidence intervals or a standardized effect size in addition to p-values. For example, GPT-5.1's 129 vs 118 win counts is a small difference and p=0.05 is borderline.
- [Appendix E, Table 5] Chart-type breakdowns with very small n (US Map n=1, World Map n=3, Pie n=8) should be either aggregated or omitted to avoid overinterpretation.
- [References] References [8] and [9] duplicate the same Cleveland 1993 paper; list it once.
- [§5.2] The optimizer's thresholds and defaults ('minimum readable size', 'continuous overlap', 'stretch ratio') are not given numeric values. For reproducibility, include default parameters or pseudocode in an appendix.
Circularity Check
No significant circularity: the central claims rest on external comparisons; self-citations are not load-bearing, and the admitted LLM-grader error is a validity caveat, not a circular step.
full rationale
Flint is a systems paper: its derivation chain is a compiler pipeline from a user- or LLM-authored semantic spec to backend code, and its claims are supported by case-study artifacts and a comparative LLM-generation experiment. No equation-level or construction-level circularity appears. The semantic type registry is a design input, not a consequence of the target claims; the 85% length reduction is a measured comparison of two specification forms, not a fitted prediction; and the LLM-agent win rates compare Flint against a DirectVL baseline on public TidyTuesday data with reported p-values. The self-citations ([37] PiCCL, [41] Dynavis, [44] Data Formulator 2) appear in related work and integration notes but are not load-bearing for the central contribution. The main validity caveat—not circularity—is that visual quality is assessed by the VisEval vision-language grader, and the authors themselves report in Appendix E, Example 5 that the grader 'appears to misjudge the outputs,' assigning Flint 10 vs DirectVL 13 despite Flint producing the faithful grouped bar chart. That is an evaluator-validity threat to the 'without compromising visual quality' claim, not a reduction of the claim to its own inputs. No uniqueness theorem or ansatz is imported from prior author work to force the design.
Assumptions & free parameters
free parameters (4)
- compiler layout options =
hand-tuned; defaults not published
- preferred/maximum chart canvas =
e.g., preferred 300x300, max 800x600
- semantic registry property mappings =
hand-authored 44-type mapping
- minimum readable size and continuous overlap thresholds =
unspecified constants
assumptions (6)
- domain assumption LLM agents can infer correct semantic types (dataSpec) from column names, value patterns, and context.
- domain assumption The VisEval-style vision-language grader is a valid proxy for human judgment of chart quality.
- domain assumption TidyTuesday 2025 datasets with LLM-generated questions are representative of real chart-authoring workloads.
- ad hoc to paper The 6/15/44 semantic type hierarchy and its inheritance rules are sufficient for visualization semantics.
- domain assumption One-to-one mapping between data fields and semantic types suffices for authored charts.
- standard math Banking to 45 degrees and the stated readability constraints improve visual quality.
Cite this review
Pith. "Pith review of Flint: A Semantics-Driven Data Visualization Intermediate Language." pith.science (2026). https://pith.science/paper/FO7BWHPJ
@misc{pith2026260720775,
  author       = {Pith},
  title        = {Pith review of: Flint: A Semantics-Driven Data Visualization Intermediate Language},
  year         = {2026},
  howpublished = {\url{https://pith.science/paper/FO7BWHPJ}},
  note         = {Machine review of arXiv:2607.20775}
}
read the original abstract
We present Flint, an intermediate language that enables authors to create high-quality visualizations from concise, semantics-driven specifications without explicitly configuring low-level parameters such as scales, axes, and formatting. Unlike prior systems that infer default configurations from surface-level data representations, often producing brittle choices, Flint introduces a hierarchical data semantic model that allows users to specify the meanings of data fields structurally and helps the compiler derive appropriate visualization configurations. From a concise specification, the system generates and optimizes library-agnostic visualization configurations and translates them into complete, executable specifications for multiple target grammars, including Vega-Lite, Apache ECharts, and Chart.js. We demonstrate that Flint simplifies the authoring process without compromising on visual quality, and it is an effective intermediate language for both humans and AI agents to create visualizations.
Figures


Figures from the paper (12 more)


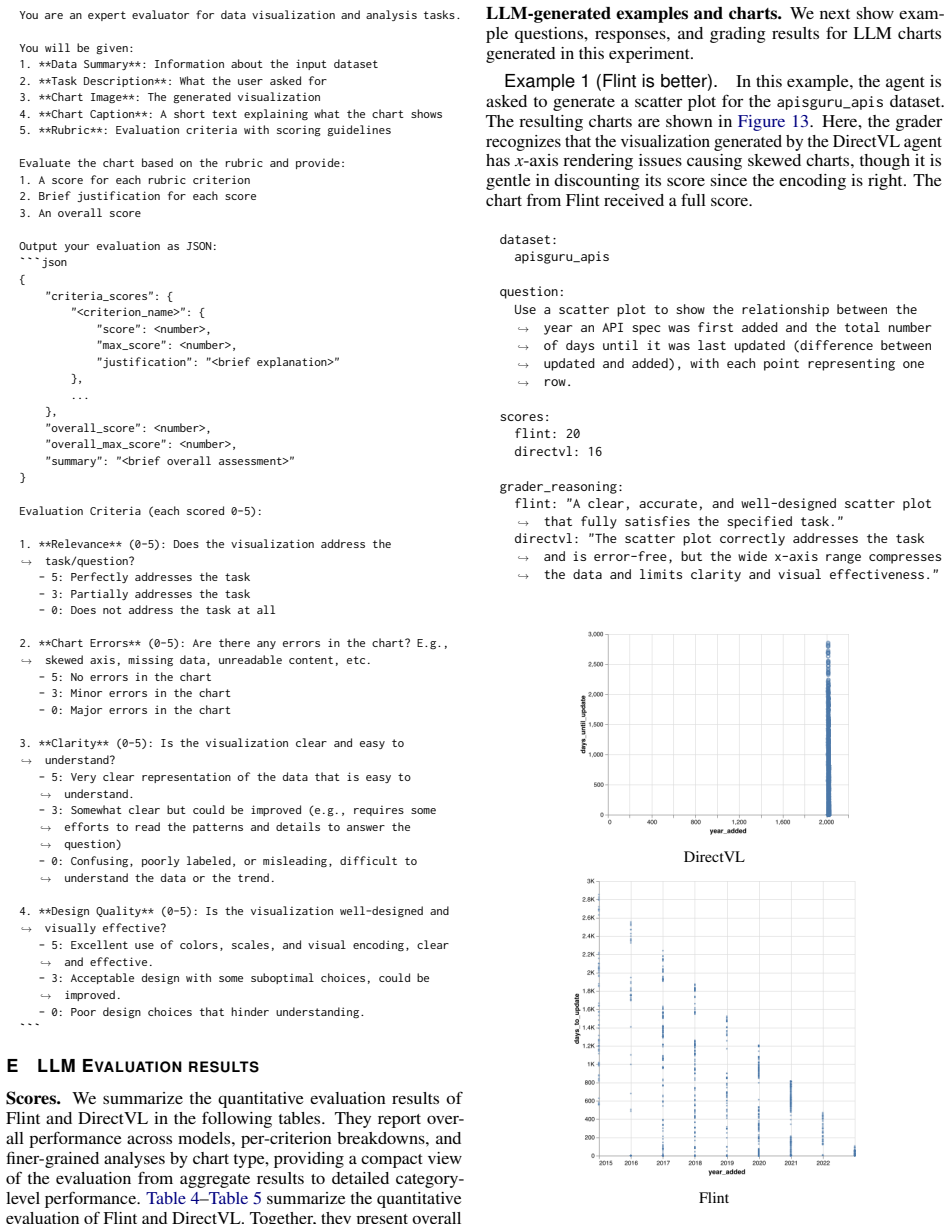


Reference graph
Works this paper leans on
-
[1]
H. Bako, A. Varma, A. Faboro, M. Haider, F. Nerrise, B. Kenah et al. Streamlining visualization authoring in d3 through user-driven templates. In2022 IEEE Visualization and Visual Analytics (VIS), pp. 16–20. IEEE, 2022. doi: 10.1109/VIS54862.2022.00012 2
arXiv 2022
-
[2]
H. K. Bako, X. Liu, L. Battle, and Z. Liu. Understanding how designers find and use data visualization examples.IEEE Transac- tions on Visualization and Computer Graphics, 29(1):1048–1058,
-
[3]
Bertin.Semiology of graphics
J. Bertin.Semiology of graphics. University of Wisconsin press,
-
[4]
M. Bostock, V . Ogievetsky, and J. Heer. D 3 data-driven docu- ments.IEEE Transactions on Visualization and Computer Graph- ics, 17(12):2301–2309, 2011. doi: 10.1109/TVCG.2011.185 2
-
[5]
M. Brossier, T. Isenberg, K. Schönborn, J. Unger, M. Romero, J. Björklund et al. State of the art of LLM-enabled interaction with visualization, 2026. doi: 10.48550/arXiv.2601.14943 1, 3
-
[7]
N. Chen, Y . Zhang, J. Xu, K. Ren, and Y . Yang. Viseval: A benchmark for data visualization in the era of large language mod- els.IEEE Transactions on Visualization and Computer Graphics, 31(1):1301–1311, 2024. doi: 10.1109/TVCG.2024.3456320 2, 3, 9
arXiv 2024
-
[9]
W. S. Cleveland. A model for studying display methods of statisti- cal graphics.Journal of Computational and Graphical Statistics, 2(4):323–343, 1993. doi: 10.1080/10618600.1993.10474616 8
arXiv 1993
-
[10]
W. S. Cleveland and R. McGill. Graphical perception: Theory, experimentation, and application to the development of graph- ical methods.Journal of the American Statistical Association, 79(387):531–554, 1984. doi: 10.1080/01621459.1984.10478080 3
arXiv 1984
Show all 72 references
-
[11]
V . Dibia. Lida: A tool for automatic generation of grammar- agnostic visualizations and infographics using large language mod- els. InProceedings of the 61st Annual Meeting of the Association for Computational Linguistics (Volume 3: System Demonstrations), pp. 113–126, 2023. ...
2023 doi
-
[12]
Elshehaly, R
M. Elshehaly, R. Jianu, A. Slingsby, G. Andrienko, and N. An- drienko. Designing for collaboration: Visualization to enable human–LLM analytical partnership.IEEE Computer Graphics and Applications, 45(5):107–116, 2025. doi: 10.1109/MCG.2025. 3583451 3
2025 doi
-
[13]
T. Gao, M. Dontcheva, E. Adar, Z. Liu, and K. G. Karahalios. Data- tone: Managing ambiguity in natural language interfaces for data visualization. InProceedings of the 28th annual acm symposium on user interface software & technology, pp. 489–500, 2015. doi: 10.1145/2807442.2807478 3
2015
-
[14]
C. C. Gramazio, K. B. Schloss, and D. H. Laidlaw. The relation between visualization size, grouping, and user performance.IEEE transactions on visualization and computer graphics, 20(12):1953– 1962, 2014. doi: 10.1109/TVCG.2014.2346983 3
1953
-
[15]
Heer and M
J. Heer and M. Agrawala. Multi-scale banking to 45 degrees.IEEE Transactions on Visualization and Computer Graphics, 12(5):701– 708, 2006. doi: 10.1109/TVCG.2006.163 8
2006 doi
-
[16]
Hoffswell, W
J. Hoffswell, W. Li, and Z. Liu. Techniques for flexible responsive visualization design. InProceedings of the 2020 CHI Conference on Human Factors in Computing Systems, pp. 1–13, 2020. doi: 10. 1145/3313831.3376777 8
2020
-
[17]
Hostnik, R
M. Hostnik, R. Kurbanov, Y . Sokolov, and A. Trofimov. Veg- achat: A robust framework for LLM-based chart generation and assessment, 2026. doi: 10.48550/arXiv.2601.15385 3
2026 doi
-
[18]
Hulsebos, K
M. Hulsebos, K. Hu, M. Bakker, E. Zgraggen, A. Satyanarayan, T. Kraska et al. Sherlock: A deep learning approach to semantic data type detection. InProceedings of the 25th ACM SIGKDD International Conference on knowledge discovery & data mining, pp. 1500–1508, 2019. doi: 10.11...
2019
-
[19]
Lattner and V
C. Lattner and V . Adve. Llvm: A compilation framework for lifelong program analysis & transformation. InInternational sym- posium on code generation and optimization, 2004. CGO 2004., pp. 75–86. IEEE, 2004. doi: 10.1109/CGO.2004.1281665 2, 4
2004 arXiv
-
[20]
D. J. L. Lee, D. Tang, K. Agarwal, T. Boonmark, C. Chen, J. Kang et al. Lux: Always-on visualization recommendations for ex- ploratory data science.CoRR, abs/2105.00121, 2021. doi: 10. 14778/3494124.349415 2, 3, 5
2021 arXiv
- [21]
-
[22]
D. Li, H. Mei, Y . Shen, S. Su, W. Zhang, J. Wang et al. Echarts: a declarative framework for rapid construction of web-based visu- alization.Visual Informatics, 2(2):136–146, 2018. doi: 10.1016/j. visinf.2018.04.011 1, 2
2018 doi
-
[23]
Z. Liu, C. Chen, and J. Hooker. Manipulable semantic components: a computational representation of data visualization scenes.IEEE Transactions on Visualization and Computer Graphics, 31(1):732– 742, 2024. doi: 10.1109/TVCG.2024.3456296 2
2024
-
[24]
https://developers.google.com/looker-studio/ connector/semantics?hl=zh-cn
Looker. https://developers.google.com/looker-studio/ connector/semantics?hl=zh-cn. Accessed: 2026-02-26. 3
2026
-
[25]
K. Lu, M. Feng, X. Chen, M. Sedlmair, O. Deussen, D. Lischin- ski et al. Palettailor: Discriminable colorization for categorical data.IEEE Transactions on Visualization and Computer Graphics, 27(2):475–484, 2020. doi: 10.1109/TVCG.2020.3030406 3
2020
-
[26]
Mackinlay
J. Mackinlay. Automating the design of graphical presentations of relational information.Acm Transactions On Graphics (Tog), 5(2):110–141, 1986. doi: 10.1145/22949.22950 3
1986
-
[27]
Mackinlay, P
J. Mackinlay, P. Hanrahan, and C. Stolte. Show me: Automatic presentation for visual analysis.IEEE transactions on visualization and computer graphics, 13(6):1137–1144, 2007. doi: 10.1109/ TVCG.2007.70594 3
2007
-
[28]
Maddigan and T
P. Maddigan and T. Susnjak. Chat2vis: Generating data visual- izations via natural language using chatgpt, codex and gpt-3 large language models.Ieee Access, 11:45181–45193, 2023. doi: 10. 1109/ACCESS.2023.3274199 3
2023
-
[29]
A. M. McNutt and R. Chugh. Integrated visualization editing via parameterized declarative templates. InProceedings of the 2021 CHI Conference on Human Factors in Computing Systems, pp. 1–14, 2021. doi: 10.1145/3411764.3445356 2
2021
-
[31]
J. Nam, J. Yoon, J. Chen, and T. Pfister. DS-STAR: data science agent via iterative planning and verification.CoRR, abs/2509.21825, 2025. doi: 10.48550/ARXIV.2509.21825 9, 12
2025 doi
- [33]
-
[34]
Satyanarayan, D
A. Satyanarayan, D. Moritz, K. Wongsuphasawat, and J. Heer. Vega-lite: A grammar of interactive graphics.IEEE Transactions on Visualization and Computer Graphics, 23(1):341–350, 2016. doi: 10.1109/TVCG.2016.2599030 1, 2, 7
2016
-
[35]
Satyanarayan, R
A. Satyanarayan, R. Russell, J. Hoffswell, and J. Heer. Reactive vega: A streaming dataflow architecture for declarative interac- tive visualization.IEEE Transactions on Visualization and Com- puter Graphics, 22(1):659–668, 2015. doi: 10.1109/TVCG.2015. 10 2467091 2
2015 doi
-
[36]
Schöttler, J
S. Schöttler, J. Dykes, J. Wood, U. Hinrichs, and B. Bach. Constraint-based breakpoints for responsive visualization design and development.IEEE Transactions on Visualization and Com- puter Graphics, 2024. doi: 10.1109/TVCG.2024.3410097 8
2024
-
[37]
H. Shi, Y . Wang, J. Chen, C. Wang, and B. Lee. PiCCL: Data-driven composition of bespoke pictorial charts.IEEE Transactions on Visualization and Computer Graphics, 2025. doi: 10.1109/TVCG. 2025.3634264 9, 12
2025
-
[38]
L. S. Snyder and J. Heer. Divi: Dynamically interactive visualiza- tion.IEEE Transactions on Visualization and Computer Graphics, 30(1):403–413, 2023. doi: 10.1109/TVCG.2023.3327172 2
2023
-
[39]
L. S. Snyder, C. Wang, and S. M. Drucker. Challenges & oppor- tunities with LLM-assisted visualization retargeting.2025 IEEE Visualization and Visual Analytics (VIS), pp. 141–145, 2025. doi: 10.1109/VIS60296.2025.00034 2
2025
-
[40]
Tosi.Matplotlib for Python developers, vol
S. Tosi.Matplotlib for Python developers, vol. 307. Packt Publish- ing Birmingham, UK, 2009. 2
2009
-
[41]
Vaithilingam, E
P. Vaithilingam, E. L. Glassman, J. P. Inala, and C. Wang. Dy- navis: Dynamically synthesized ui widgets for visualization editing. InProceedings of the 2024 CHI Conference on Human Factors in Computing Systems, pp. 1–17, 2024. doi: 10.1145/3613904. 3642639 1
2024 doi
-
[42]
P. M. Valero-Mora. ggplot2: elegant graphics for data analysis. Journal of statistical software, 35:1–3, 2010. doi: doi/10.5555/ 1795559 2
2010
-
[43]
VanderPlas and H
S. VanderPlas and H. Hofmann. Signs of the sine illusion—why we need to care.Journal of Computational and Graphical Statistics, 24(4):1170–1190, 2015. doi: 10.1080/10618600.2014.951547 3
2015
-
[44]
C. Wang, B. Lee, S. M. Drucker, D. Marshall, and J. Gao. Data formulator 2: Iterative creation of data visualizations, with ai trans- forming data along the way. InProceedings of the 2025 CHI Conference on Human Factors in Computing Systems, pp. 1–17,
2025
-
[45]
Y . Wang, Z. Wang, C.-W. Fu, H. Schmauder, O. Deussen, and D. Weiskopf. Image-based aspect ratio selection.IEEE Trans- actions on Visualization and Computer Graphics, 25(1):840–849,
-
[46]
Y . Wang, Z. Wang, L. Zhu, J. Zhang, C.-W. Fu, Z. Cheng et al. Is there a robust technique for selecting aspect ratios in line charts?IEEE Transactions on Visualization and Computer Graph- ics, 24(12):3096–3110, 2017. doi: 10.1109/TVCG.2017.2787113 3, 8
2017
-
[47]
Wilkinson.The Grammar of Graphics
L. Wilkinson.The Grammar of Graphics. Springer Science & Business Media, 2006. 1, 2
2006
-
[48]
Wongsuphasawat, D
K. Wongsuphasawat, D. Moritz, A. Anand, J. Mackinlay, B. Howe, and J. Heer. Towards a general-purpose query language for vi- sualization recommendation. InProceedings of the workshop on human-in-the-loop data analytics, pp. 1–6, 2016. doi: 10.1145/ 2939502.293950 9
2016
-
[49]
J. Yang, P. F. Gyarmati, Z. Zeng, and D. Moritz. Draco 2: An extensible platform to model visualization design. In2023 IEEE Visualization and Visual Analytics (VIS), pp. 166–170. IEEE, 2023. doi: 10.1109/VIS54172.2023.00042 9
2023
-
[50]
near-misses
D. Zhang, Y . Suhara, J. Li, M. Hulsebos, C. Demiralp, and W.-C. Tan. Sato: Contextual semantic type detection in tables.Proceed- ings of the VLDB Endowment, 13(11). doi: 10.14778/3407790. 3407793 3 A SEMANTIC TYPE REGISTRY In Flint, we currently organize semantic types into 4...
2025 doi
-
[54]
What are the key trends in this data?
**Ambiguous/High-level**: Open-ended questions that allow for interpretation (e.g., "What are the key trends in this data?"),→
-
[55]
How does sales vary by region?
**Concrete/Low-level**: Specific questions about particular aspects (e.g., "How does sales vary by region?"),→
-
[56]
Show me a bar chart of revenue by category
**Chart-specific**: Questions that directly request a specific chart type (e.g., "Show me a bar chart of revenue by category").,→ Do not ask for multi-layered or annotated charts. Chart types can be selected from "Scatter Plot", "Bar Chart", "Line Chart", "Area Chart", "Histog...
2020
-
[57]
Transform the data using a standalone Python script
-
[58]
Generate VegaLite visualization code directly The recommendation and transformation should be based on the [CONTEXT] and [GOAL] provided by the user.,→ The [CONTEXT] shows what the current dataset is, and the [GOAL] describes what visualization the user wants.,→ Your output sh...
-
[59]
recap":
A JSON object with metadata about the visualization: ```json { "recap": "...", "display_instruction": "...", "recommendation": "...", "output_fields": [...], "output_variable": "..." } ``` - "output_variable": descriptive snake_case name (e.g. "sales_by_region"), not "result_df",→
-
[60]
output_variable
A standalone Python script that reads data from files and produces a DataFrame:,→ ```python import pandas as pd import numpy as np # Read data from workspace files (use exact filenames from [CONTEXT]) df = pd.read_parquet('table_name.parquet') # Transform as needed # ... # Ass...
-
[61]
$schema":
VegaLite visualization code in JSON format: ```json { "$schema": "https://vega.github.io/schema/vega-lite/v5.json", "data": {"name": "data"}, "mark": "...", "encoding": { "x": {"field": "...", "type": "..."}, "y": {"field": "...", "type": "..."}, ... }, ... } ``` Important not...
-
[62]
One JSON object with metadata
-
[63]
One Python code block (standalone script)
-
[64]
D.4 Grading agent The grading agent uses a checklist-based evaluation protocol to assess each agent response
One JSON code block with VegaLite spec Do not add any extra text explanation outside these three blocks. D.4 Grading agent The grading agent uses a checklist-based evaluation protocol to assess each agent response. It is implemented as a vision- language model that receives th...
-
[65]
**Data Summary**: Information about the input dataset
-
[66]
**Task Description**: What the user asked for
-
[67]
**Chart Image**: The generated visualization
-
[68]
**Chart Caption**: A short text explaining what the chart shows
-
[69]
**Rubric**: Evaluation criteria with scoring guidelines Evaluate the chart based on the rubric and provide:
-
[70]
A score for each rubric criterion
-
[71]
Brief justification for each score
-
[72]
criteria_scores
An overall score Output your evaluation as JSON: ```json { "criteria_scores": { "<criterion_name>": { "score": <number>, "max_score": <number>, "justification": "<brief explanation>" }, ... }, "overall_score": <number>, "overall_max_score": <number>, "summary": "<brief overall...
-
[73]
**Relevance** (0-5): Does the visualization address the task/question?,→ - 5: Perfectly addresses the task - 3: Partially addresses the task - 0: Does not address the task at all
-
[74]
**Chart Errors** (0-5): Are there any errors in the chart? E.g., skewed axis, missing data, unreadable content, etc.,→ - 5: No errors in the chart - 3: Minor errors in the chart - 0: Major errors in the chart
-
[75]
**Clarity** (0-5): Is the visualization clear and easy to understand?,→ - 5: Very clear representation of the data that is easy to understand.,→ - 3: Somewhat clear but could be improved (e.g., requires some efforts to read the patterns and details to answer the question) ,→ ,...
-
[76]
A clear, accurate, and well-designed scatter plot that fully satisfies the specified task
**Design Quality** (0-5): Is the visualization well-designed and visually effective?,→ - 5: Excellent use of colors, scales, and visual encoding, clear and effective.,→ - 3: Acceptable design with some suboptimal choices, could be improved.,→ - 0: Poor design choices that hind...
2000
-
[2018]
doi: 10.1109/TVCG.2018.2865266 3, 8
2018
-
[2022]
doi: 10.1109/TVCG.2022.3209490 2
2022
-
[2025]
doi: 10.1145/3706598.3713296 1, 3
Reviewed August 1, 2026 · model on record in the stance chip above.
Discussion (0). Continue with ORCID to comment.