REVIEW 3 major objections 5 minor 30 references
Performance analysis of an optically pumped magnetometer in Earth's magnetic field
T0 review · 3 major / 5 minor · reviewed 2026-08-14 · deepseek-v4-flash
Pith's one-line read Two balanced laser beams with opposite helicities suppress the heading error of a cesium-vapor magnetometer at Earth's field strength, keeping shot-noise-limited resolution near 20 fT/√Hz over a wide angular range.
desk verdict Useful experimental study of LSD-Mz heading behavior, but the central heading-error claim rests on an unverified identification of the mean line center with the actual zero-crossing readout. read the letter →
The pith
A machine-rendered reading of the paper's core claim, the machinery that carries it, and where it could break.
The reading
What carries the argument
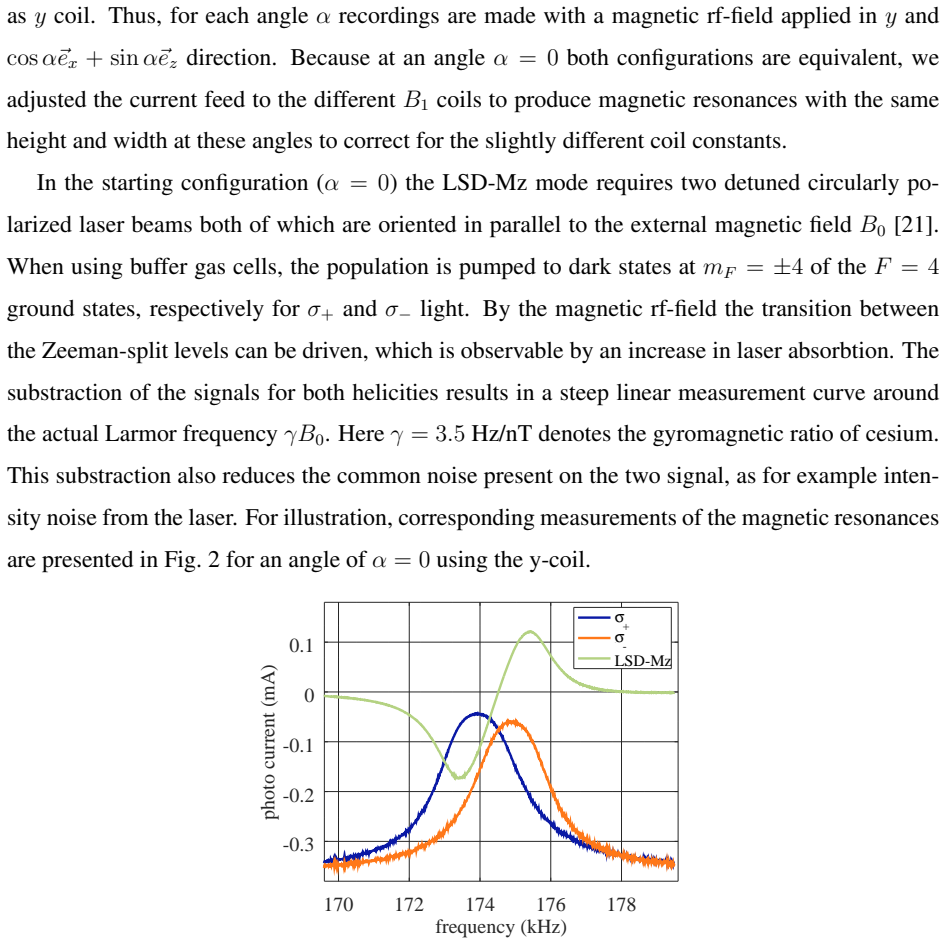
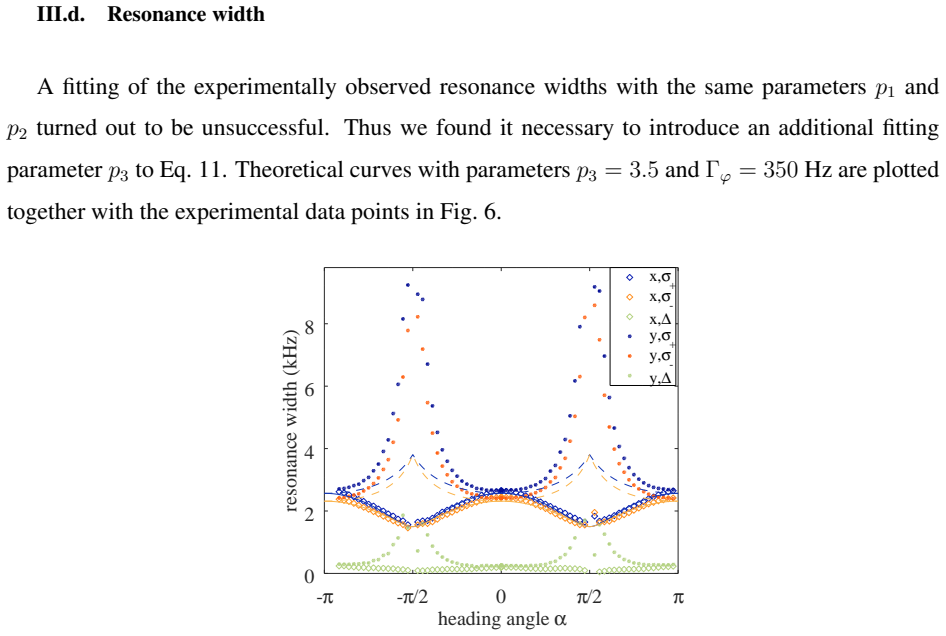
The mechanism is the differential readout of two circularly polarized pump beams of opposite helicity: the subtraction of the $\sigma^+$ and $\sigma^-$ photocurrents gives a steep, linear dispersion curve centered at the Larmor frequency, while the vector light shift—interpreted as a virtual magnetic field along the beam's angular momentum—moves the two resonance centers in opposite directions, so the mean of the measured centers is nearly heading-independent. The quantitative model is a two-level Bloch description in which optical pumping enters through modified excitation and relaxation rates, $\Gamma_e = \gamma_r/2 + (\Omega_p|\cos\alpha|/2)(1+\cos\alpha)$ and $\Gamma_r = \gamma_r/2 + (\Omega_p|\cos\alpha|/2)(1-\cos\alpha)$, where $\alpha$ is the angle between the beam direction and the magnetic field. These rates, together with a fitted broadening term $p_3$ attributed to laser power broadening, reproduce the measured angular dependence of the photocurrent, resonance amplitude, and width, and feed the closed-form sensitivity expression used to predict the orientation tolerance. The model is explicitly restricted to two levels and omits linearly polarized pumping, which the authors identify as the reason it fails near $\alpha = \pm\pi/2$.
What would settle it
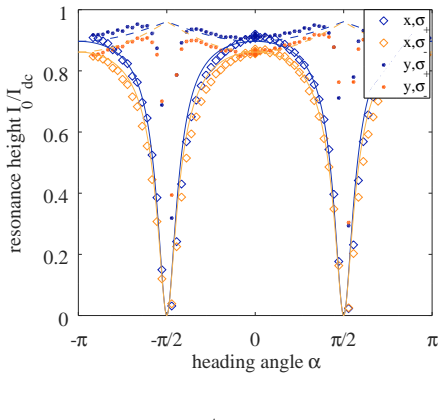
Take the same dual-beam setup and intentionally unbalance the two beam intensities by a controlled amount, for example 5%, then rotate through the heading range while recording the reconstructed Larmor frequency and the shot-noise-limited resolution. If the heading error and sensitivity variation scale with the imbalance, the cancellation mechanism is confirmed as balance-dependent; if they do not, the balancing explanation is insufficient. A second decisive check is to measure the normalized resonance amplitude near $\alpha = \pm 90^\circ$ with the y-coil, where the model predicts a rise toward unity but the experiment shows a drop to zero; reproducing that discrepancy with a model that includes linear pumping would settle whether the two-level description is the limiting factor.
Extended reading notes
Core claim
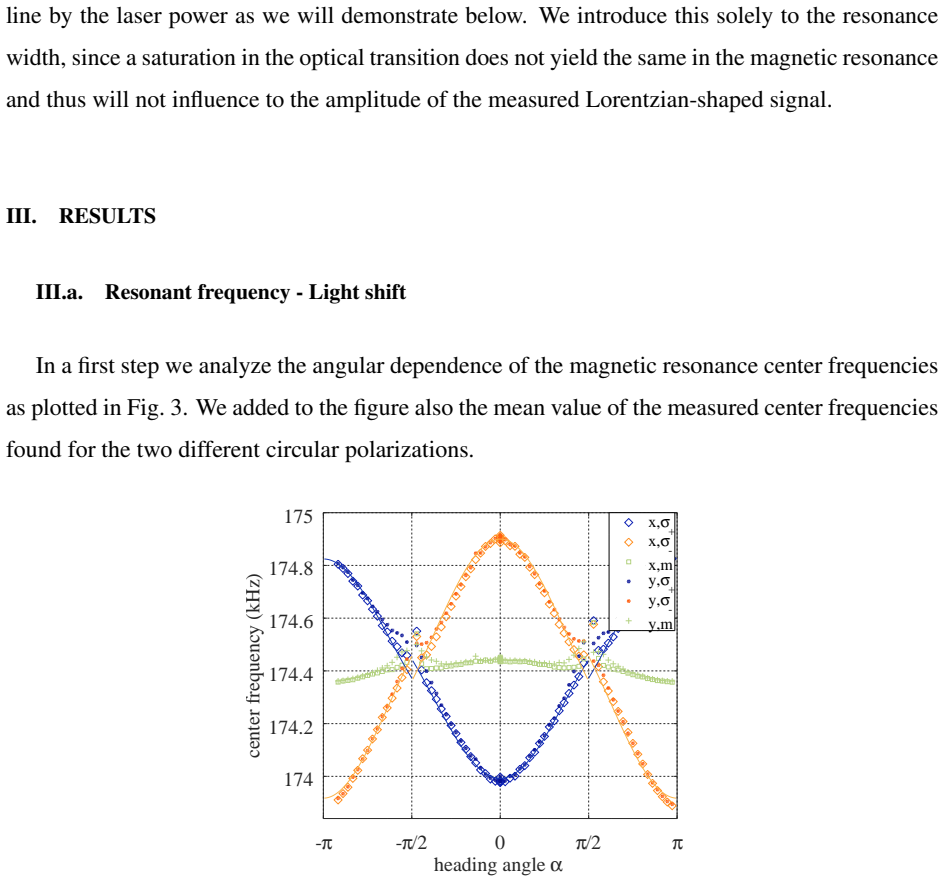
The central claim is that a balanced twin-beam configuration makes the LSD-Mz magnetometer nearly orientation-insensitive: because the $\sigma^+$ and $\sigma^-$ resonances experience opposite vector light shifts, their mean frequency tracks the Larmor frequency $\gamma B_0$ even while each individual resonance shifts strongly with heading. The paper demonstrates this experimentally in a $49.664\,\mu\mathrm{T}$ field over headings from $-\pi$ to $+\pi$, extracting resonance centers, dc photocurrents, amplitudes, and widths for two orientations of the applied rf field. A two-level Bloch model modified by heading-dependent optical pumping rates reproduces the data away from perpendicular orientation, and the fitted model predicts a shot-noise-limited sensitivity that stays near $\approx 20\,\mathrm{fT}/\sqrt{\mathrm{Hz}}$ over about $\pm 20^\circ$ around alignment. The authors conclude that a sensor operated in this regime needs only rough alignment to the local field direction, and that with well-balanced beams the light-shift-induced error in the reconstructed field is cancelled by the helicity subtraction.
Load-bearing premise
The load-bearing premise is that the two-level Bloch model with heading-dependent pumping rates and an extra constant broadening term correctly describes the resonances in the operating range of interest, even though the authors state it neglects linear pumping and fails near perpendicular orientation.
Editorial extensions
If this is right
- An LSD-Mz magnetometer with balanced beams can be mounted on a moving platform in Earth's field and still reconstruct the absolute field to high accuracy without active heading compensation, as long as the heading stays within roughly $\pm 20^\circ$ of the local field vector.
- The same design should be able to reach about 20 fT/$\sqrt{\mathrm{Hz}}$ shot-noise-limited resolution in a ~50 $\mu$T field, putting femtotesla scalar magnetometry within reach of cryogen-free instruments.
- The fitted model gives a quantitative prescription for choosing laser power, detuning, and rf drive strength: the orientation width of the sensitivity plateau can be traded against absolute sensitivity by adjusting the optical pumping rate.
- Because the heading dependence of the resonance amplitude and width is well described for one rf-coil orientation but only qualitatively for the other, the choice of rf-coil orientation matters for applications that need constant drive efficiency as the sensor rotates.
Reading between the lines
- A testable prediction that follows from the balancing argument but is not directly measured here: the residual heading error should scale with the intensity imbalance between the $\sigma^+$ and $\sigma^-$ beams, so deliberately detuning one beam by a few percent should produce a proportionate Larmor-frequency error.
- The model's failure near $\alpha = \pm\pi/2$ is attributed by the authors to linearly polarized pumping and multi-level Zeeman redistribution; extending the two-level rates to include a $\pi$-polarized pumping term should reproduce the observed drop in resonance amplitude and the y-coil width increase, turning the qualitative agreement into quantitative coverage of the dead zones.
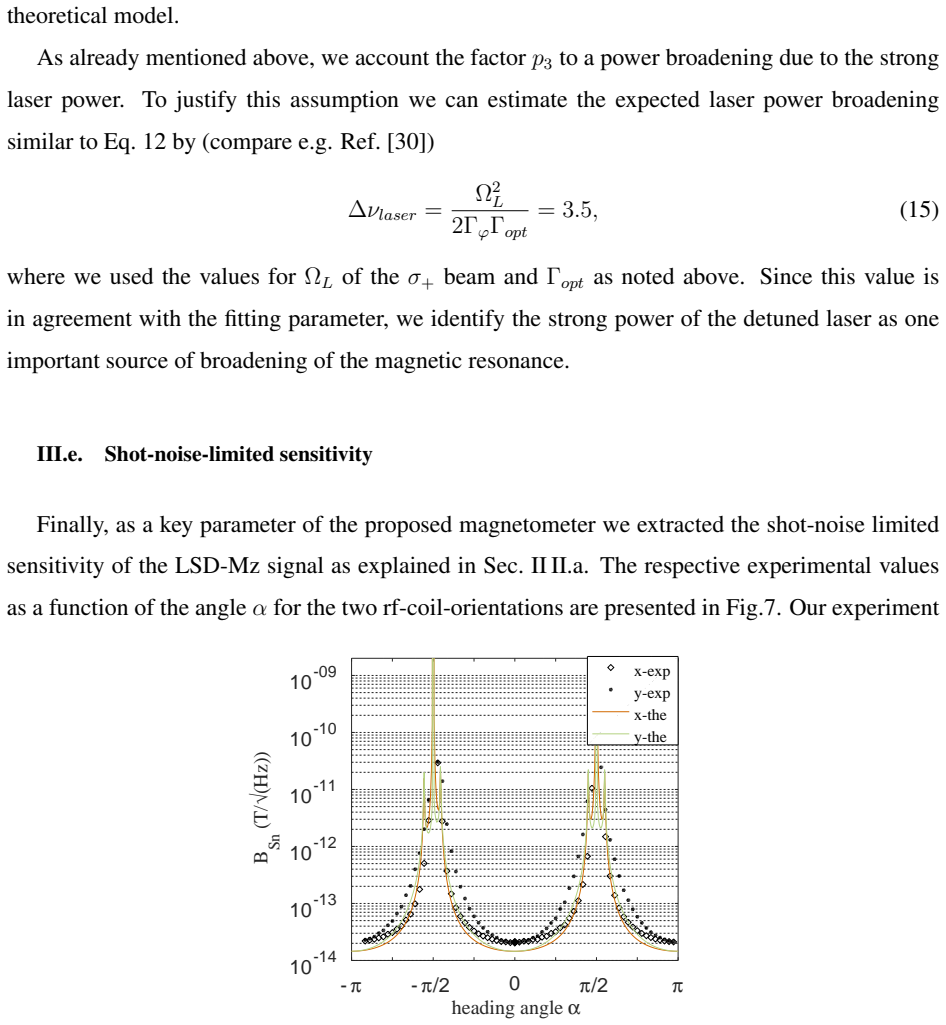
- The theoretical sensitivity spikes near $\pm\pi/2$ arise from the overlap of the two resonance curves (the difference signal goes to zero); the authors note this is invisible experimentally because the resonance contrast vanishes, so users should not expect useful sensitivity at perpendicular orientation even though the model curves show structure there.
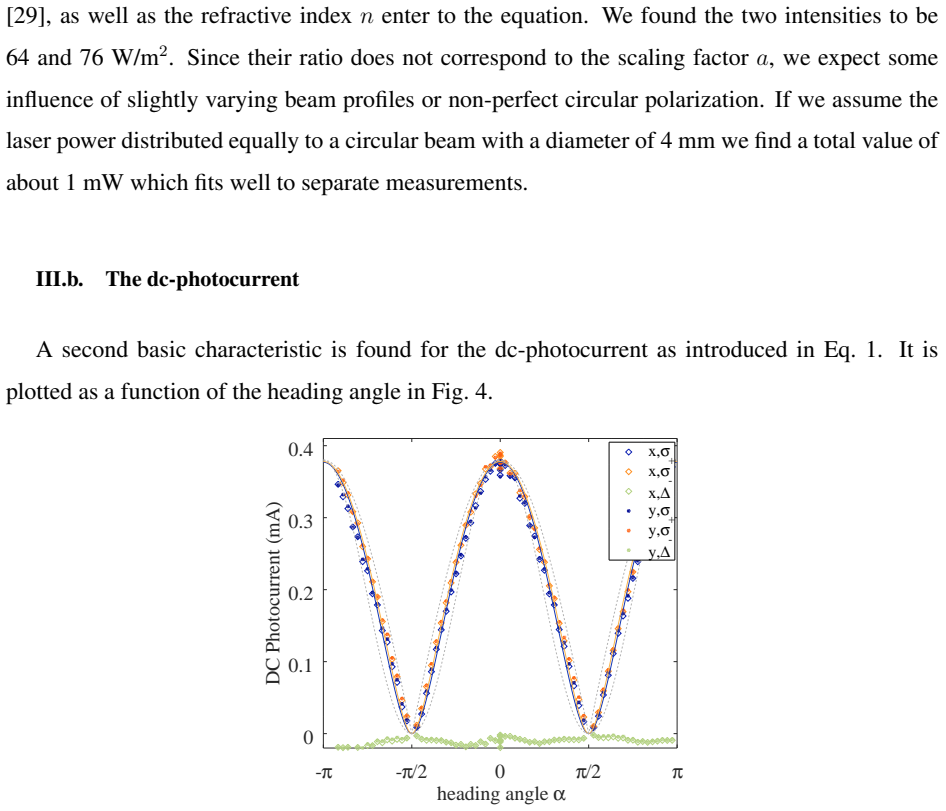
- The requirement of 'well-balanced' beams is seen in practice to involve more than equal incident power: the electronic gain factor of 1.61 and the residual ~2% photocurrent difference suggest that beam profiles and polarization ellipticity also enter the effective pumping rates, so practical deployments would need per-channel pumping-rate monitoring, not just power balancing.
Signed reviews
Editorial analysis
A structured set of objections, weighed in public.
Referee Report
Summary. The paper reports an experimental and theoretical study of the heading-angle dependence of an optically pumped magnetometer operated in the light-shift-dispersed Mz (LSD-Mz) mode at Earth-field strengths. For a cesium vapor cell pumped by two counter-propagating, oppositely circularly polarized beams, the authors measure the resonance frequencies, dc photocurrents, resonance amplitudes, and linewidths as functions of the angle between the laser propagation direction and the static field, for two different rf-coil orientations. A two-level Bloch model with heading-dependent optical pumping rates is introduced and fitted to the data, and the fit parameters are used to compute a theoretical shot-noise-limited sensitivity curve. The central claim is that balanced dual-helicity pumping makes both the heading error and the field sensitivity only weakly dependent on heading over a large angular range.
Significance. If the central claim is fully established, the paper would be a valuable practical demonstration for deploying OPMs in unshielded, Earth-field environments, where heading errors are a known limitation. The strengths of the manuscript include a detailed experimental dataset over a full heading rotation, a transparent account of the fitting parameters, and a measured shot-noise-limited resolution near 20 fT/sqrt(Hz), which is a useful reference value. The authors also openly identify places where their model fails, particularly near perpendicular orientation. However, as argued in the major comments, the heading-error cancellation claim is not yet quantitatively connected to the actual LSD-Mz readout, and the theoretical sensitivity curves in Fig. 7 are consistency checks rather than independent predictions because they use parameters fitted to the same data. These issues are load-bearing for the abstract's central assertion.
major comments (3)
- [II.a, III.a, Fig. 3] The heading-error cancellation claim is supported by the flatness of the arithmetic mean of the sigma+ and sigma- resonance center frequencies in Fig. 3, but the operational LSD-Mz readout is the zero crossing of the difference signal I(sigma+) - I(sigma-), not the mean of the two line centers. For two Lorentzians with centers nu0 +/- delta, a common width Delta, and an amplitude ratio r different from 1, the zero crossing is displaced from the mean by approximately ((r-1)/(r+1)) (4 delta^2 + Delta^2)/(8 delta). Section II.a reports that, despite <1% intensity balancing, a significant dc-current and resonance-amplitude imbalance required electronic gain a = 1.61, and Fig. 4 shows a residual dc asymmetry of about 2%. The paper does not quantify the residual amplitude or width imbalance after electronic balancing, nor how this residual varies with heading. Without that quantification, the flat mean-frequency curve demonstrates cancellation of the ac-Stark shifts of the two line centers but does not by itself establish cancellation of the sensor's actual heading error. Please provide a quantitative estimate of the zero-crossing shift using the measured widths, splittings, and residual imbalance, or directly plot the zero-crossing frequency versus alpha.
- [III.e, Eq. (17), Fig. 7] The theoretical sensitivity curves labeled 'x-the' and 'y-the' in Fig. 7 are computed from Eq. (17) using the parameters p1 = 0.3, p2 = 0.12, p3 = 3.5, and Gamma_phi = 350 Hz, which were obtained by fitting the same datasets that the curves are compared against. The agreement in Fig. 7 is therefore a consistency check of the model, not an independent prediction of the heading dependence of the sensitivity. This should be stated explicitly in Section III.e and in the Fig. 7 caption; otherwise the phrase 'expected dependencies' overstates the evidential weight. The experimental sensitivity data alone do show a stable resolution near 20 fT/sqrt(Hz) for roughly +/-20 degrees, so the main qualitative conclusion survives, but the quantitative model validation needs to be framed correctly.
- [II.b, Eq. (6), III.c, III.d] The two-level model uses heading-dependent optical pumping rates in Eq. (6) that include an ad hoc factor |cos alpha| and explicitly neglect the linearly polarized pumping component proportional to sin alpha. The authors acknowledge in Section III.c that the model fails to reproduce the resonance amplitude drop near alpha = +/- pi/2, and in Section III.d that it fails to capture the width increase for the y-coil at those angles. Since Eq. (17), used for the theoretical sensitivity curves, is built from this model, the predicted sensitivity near perpendicular orientation is not reliable; indeed the spurious peaks near +/- pi/2 in Fig. 7 are a symptom of this limitation. The abstract's phrase 'large orientation angle range' should therefore be qualified to the angular interval over which the model and data are actually validated, for example the roughly +/-20 degrees around alignment, or the validity range should be demonstrated by a more complete model that includes linear polarization.
minor comments (5)
- [Abstract] The sentence 'That are the reconstructed Larmor frequency...' should read 'These are the reconstructed Larmor frequency...'.
- [III.a, Fig. 3] The caption states that the mean frequency 'roughly corresponds' to the Larmor frequency measured by the LSD-Mz mode; since the heading-error claim depends on this correspondence, please quantify the deviation rather than using the word 'roughly'.
- [III.a] The light-shift calculation uses Omega_L = 3.15 MHz and 3.45 MHz for the two beams; please state explicitly that these values are chosen to match the measured frequency shifts, and note that their ratio does not match the electronic balancing factor a = 1.61.
- [II.a] There is a typo in the sentence describing the reason for the observed deviation: 'The reason for the observed deviation, that is dependent on the applied magnetic field requires further investigations' should have a comma or be rephrased.
- [Fig. 1] In the caption, 'rotating angles of alpha = 0' should be 'a rotation angle of alpha = 0'.
Circularity Check
Theoretical sensitivity and light-shift curves are recalculations from parameters fitted to the same datasets, so the model 'predictions' are partly forced; the central heading-error robustness claim remains experimental.
-
fitted input called prediction
[Section III.e, Eqs. (10), (11), (17) and Fig. 7]
"Substituting into the equation for the shot-noise-limited resolution (2) results in Bsn = sqrt(e/Idc) 1/(8γ i0) ((4ν2LS + Δν2)^2)/(Δν2 νLS), with the parameters Idc, i0, and Δν defined by the respective equations (8), (10), and (11). The theoretical estimated sensitivity is added to Fig. 7. In the calculation we used the experimental parameters of the starting angle and for σ+ light and assumed perfect channel balancing."
The theoretical Bsn(α) curve in Fig. 7 is computed from Eqs. (8), (10), and (11) using p1≈0.3, p2=0.12, and p3=3.5 that were fitted to the very same experimental resonance amplitude, width, and dc-photocurrent datasets (Sections III.b–III.d) from which the experimental sensitivity markers in Fig. 7 are obtained via the measured slope in Eq. (2). Thus the 'expected dependence' is not an independent prediction; it is a remapping of fitted Lorentzian parameters into the sensitivity formula, so agreement with the experimental curve is largely forced by construction.
-
fitted input called prediction
[Section III.a, Fig. 3]
"For the curves we used a magnetic field strength of B0 = 49.664 μT, detunings of δF′=4 = −8 GHz and δF′=3 = −9.2 GHz from the respective optical transitions F = 4 → F′ = 4 and F = 4 → F′ = 3, a linewidth of the optical transitions Γopt ≈ 4 GHz, and optical driving amplitudes in frequency units ΩL = 3.15 MHz and 3.45 MHz for σ+ and σ− polarized beam, respectively."
The solid 'theoretical curves describing the expected light shift' in Fig. 3 are generated by choosing the Rabi frequencies ΩL = 3.15/3.45 MHz for the two helicities so that the calculated light shifts match the measured center frequencies. The same measured frequencies are then presented as being reproduced by the model. No independent prediction is made, since the model amplitudes are tuned to the data points being explained.
full rationale
The paper's headline claim—that dual-helicity balanced pumping makes the heading error and sensitivity weakly dependent on heading in a large angular range—rests primarily on direct measurements: the mean of the σ+/σ− resonance centers in Fig. 3 is flat across the heading range, and the measured shot-noise-limited resolution in Fig. 7 stays near 20 fT/√Hz for ±20° around the optimum. These data are not generated by the theoretical model. The circularity is confined to the model validation sections: the 'expected light shift' curves (Fig. 3) and the 'theoretical estimated sensitivity' curves (Fig. 7) are computed from parameters (ΩL; p1, p2, p3) fitted to the same datasets they are compared against. This makes the theoretical curves retrodictions rather than predictions, but it does not undermine the experimental heading-error and sensitivity claims. The self-citation to Ref. [6] for the light-shift method is present but not load-bearing, because the cancellation of the vector light shift is observed directly in the measured mean frequencies. One correctness concern (not circularity): identifying the LSD-Mz readout with the arithmetic mean of the two fitted line centers is not exact, since the sensor output is the zero crossing of the difference signal, and the electronic balancing factor a=1.61 implies amplitude imbalance that can shift the effective zero crossing; however this is a validity issue, not a circular-reasoning issue.
Assumptions & free parameters
free parameters (5)
- p1 = gamma_r / Omega_p =
0.3
- p2 = Gamma_phi Omega_p / Omega^2 =
0.12
- p3 =
3.5
- Gamma_phi =
350 Hz
- Omega_L (sigma+ and sigma- optical Rabi frequencies) =
3.15 MHz, 3.45 MHz
assumptions (5)
- standard math Rotating wave approximation and two-level reduction for the rf-driven magnetic resonance
- domain assumption Dipole interaction matrix element (Eq. 13) from Ref [6] governs the angle-dependent atom-light coupling
- ad hoc to paper Heading-dependent optical pumping rates (Eq. 6) with factor |cos alpha| model the two-level system
- domain assumption Shot noise dominates the sensor noise floor
- domain assumption The mean of sigma+ and sigma- resonance frequencies equals the unshifted Larmor frequency
Cite this review
Pith. "Pith review of Performance analysis of an optically pumped magnetometer in Earth's magnetic field." pith.science (2026). https://pith.science/paper/FS65AKU4
@misc{pith2026190806639,
  author       = {Pith},
  title        = {Pith review of: Performance analysis of an optically pumped magnetometer in Earth's magnetic field},
  year         = {2026},
  howpublished = {\url{https://pith.science/paper/FS65AKU4}},
  note         = {Machine review of arXiv:1908.06639}
}
read the original abstract
We experimentally investigate the influence of the orientation of optically pumped magnetometers in Earth's magnetic field. We focus our analysis to an operational mode that promises femtotesla field resolu-tions at such field strengths. For this so-called light-shift dispersed Mz(LSD-Mz) regime, we focus on the key parameters defining its performance. That are the reconstructed Larmor frequency, the transfer function between output signal and magnetic field amplitude as well as the shot noise limited field resolution. We demonstrate that due to the use of two well balanced laser beams for optical pumping with different helicities the heading error as well as the field sensitivity of a detector both are only weakly influenced by the heading in a large orientation angle range.
Figures

Figures from the paper (4 more)
Reference graph
Works this paper leans on
-
[1]
C. Cohen-Tannoudji, B. Diu, and F. Laloe, Quantum mechanics. V olume I(Wiley, New York, 1977)
work page 1977
- [2]
-
[3]
M. N. Nabighian, V . J. S. Grauch, R. O. Hansen, T. R. LaFehr, Y . Li, J. W. Peirce, J. D. Phillips, and M. E. Ruder, in Geophysics Today (Society of Exploration Geophysicists, Tulsa, OK, 2010) pp. 183–213
work page 2010
- [4]
-
[5]
D. Budker and D. F. J. Kimball, eds., Optical Magnetometry (Cambridge University Press, New York, 2013)
work page 2013
-
[6]
G. Oelsner, V . Schultze, R. IJsselsteijn, F. Wittk¨amper, and R. Stolz, Physical Review A 99, 013420 (2019). 19
work page 2019
- [7]
-
[8]
G. Bao, A. Wickenbrock, S. Rochester, W. Zhang, and D. Budker, Physical Review Letters 120, 033202 (2018)
work page 2018
Show all 30 references
-
[9]
Q.-Q. Hu, C. Freier, Y . Sun, B. Leykauf, V . Schkolnik, J. Yang, M. Krutzik, and A. Peters, Physical Review A 97, 013424 (2018)
2018
-
[10]
Colombo, V
S. Colombo, V . Dolgovskiy, T. Scholtes, Z. D. Gruji ´c, V . Lebedev, and A. Weis, Applied Physics B 123, 35 (2016)
2016
-
[11]
Magnetic resonance based atomic magnetometers,
A. Weis, G. Bison, and Z. D. Gruji ´c, “Magnetic resonance based atomic magnetometers,” in High Sensitivity Magnetometers (Smart Sensors, Measurement and Instrumentation) , edited by A. Grosz, M. J. Haji-Sheikh, and S. C. Mukhopadhyay (Springer, Cham, 2017) pp. 361–424
2017
-
[12]
Clarke and A
J. Clarke and A. I. Braginski, eds., The SQUID Handbook: Fundamentals and Technology of SQUIDs and SQUID Systems (Wiley-VCH, Weinheim, 2004)
2004
-
[13]
Superconducting Quantum Interference Devices (SQUID) Magnetome- ters,
M. Schmelz and R. Stolz, “Superconducting Quantum Interference Devices (SQUID) Magnetome- ters,” in High Sensitivity Magnetometers (Smart Sensors, Measurement and Instrumentation) , edited by A. Grosz, M. J. Haji-Sheikh, and S. C. Mukhopadhyay (Springer, Cham, 2017) pp. 279–311
2017
-
[14]
Stolz, V
R. Stolz, V . Zakosarenko, L. Fritzsch, N. Oukhanski, and H.-G. Meyer, IEEE Transactions on Appiled Superconductivity 11, 1257 (2001)
2001
-
[15]
Chwala, R
A. Chwala, R. Stolz, R. IJsselsteijn, V . Schultze, N. Ukhansky, H.-G. Meyer, and T. Sch ¨uler, Super- conductor Science and Technology 14, 1111 (2001)
2001
-
[16]
SQUID System Issues,
C. P. Foley, “SQUID System Issues,” in The SQUID Handbook: Fundamentals and Technology of SQUIDs and SQUID Systems , edited by J. Clarke and A. I. Braginski (Wiley-VCH, Weinheim, 2004) Chap. 7, p. 251
2004
-
[17]
Geophysical Exploration,
R. Stolz, “Geophysical Exploration,” in Applied Superconductivity: Handbook on Devices and Appli- cations, edited by P. Seidel (Wiley-VCH, Weinheim, 2015) Chap. 9.3.4, p. 1020
2015
-
[18]
Scholtes, V
T. Scholtes, V . Schultze, R. IJsselsteijn, S. Woetzel, and H.-G. Meyer, Physical Review A84, 043416 (2011)
2011
-
[19]
Y . Guo, S. Wan, X. Sun, and J. Qin, Applied Optics 58, 734 (2019)
2019
-
[20]
Y . Fu, Y . Liu, and J. Yuan, AIP Advances9, 015304 (2019)
2019
-
[21]
Schultze, B
V . Schultze, B. Schillig, R. IJsselsteijn, T. Scholtes, S. Woetzel, and R. Stolz, Sensors17, 561 (2017). 20
2017
-
[22]
Woetzel, V
S. Woetzel, V . Schultze, R. IJsselsteijn, T. Schulz, S. Anders, R. Stolz, and H.-G. Meyer, Review of Scientific Instruments 82, 033111 (2011)
2011
-
[23]
Schultze, R
V . Schultze, R. IJsselsteijn, and H.-G. Meyer, Applied Physics B 100, 717 (2010)
2010
-
[24]
B. S. Mathur, H. Tang, and W. Happer, Physical Review 171, 11 (1968)
1968
-
[25]
S. N. Shevchenko, G. Oelsner, Y . S. Greenberg, P. Macha, D. S. Karpov, M. Grajcar, U. H¨ubner, A. N. Omelyanchouk, and E. Il’ichev, Phys. Rev. B 89, 184504 (2014)
2014
-
[26]
Dr ´eau, M
A. Dr ´eau, M. Lesik, L. Rondin, P. Spinicelli, O. Arcizet, J.-F. Roch, and V . Jacques, Physical Review B 84, 195204 (2011)
2011
-
[27]
Y . Shi, T. Scholtes, Z. D. Gruji ´c, V . Lebedev, V . Dolgovskiy, and A. Weis, Physical Review A 97 (2018), 10.1103/physreva.97.013419
2018 doi
-
[28]
Oelsner, P
G. Oelsner, P. Macha, O. V . Astafiev, E. Il’ichev, M. Grajcar, U. H ¨ubner, B. I. Ivanov, P. Neilinger, and H.-G. Meyer, Physical Review Letters 110, 053602 (2013)
2013
-
[29]
Cesium D line data,
D. A. Steck, “Cesium D line data,” online (2010)
2010
-
[30]
Loudon, The Quantum Theory of Light (Oxford Science Publications) (Oxford University Press, New York, 2000) pp
R. Loudon, The Quantum Theory of Light (Oxford Science Publications) (Oxford University Press, New York, 2000) pp. 72–79. 21
2000
Reviewed August 14, 2026 · model on record in the stance chip above.
Discussion (0). Continue with ORCID to comment.