REVIEW 2 major objections 5 minor 148 references
The Hot Gas Exhaust of Starburst Engines in Mergers: Testing Models of Stellar Feedback and Star Formation Regulation
T0 review · 2 major / 5 minor · reviewed 2026-08-14 · deepseek-v4-flash
Pith's one-line read In merging galaxies, hot gas mass tracks star formation rate linearly.
desk verdict New hot-gas volume and mass measurements for 49 mergers; the M_X-SFR slope is real but only conditional because the mass estimate implicitly sets the filling factor to unity. read the letter →
The pith
A machine-rendered reading of the paper's core claim, the machinery that carries it, and where it could break.
The reading
What carries the argument
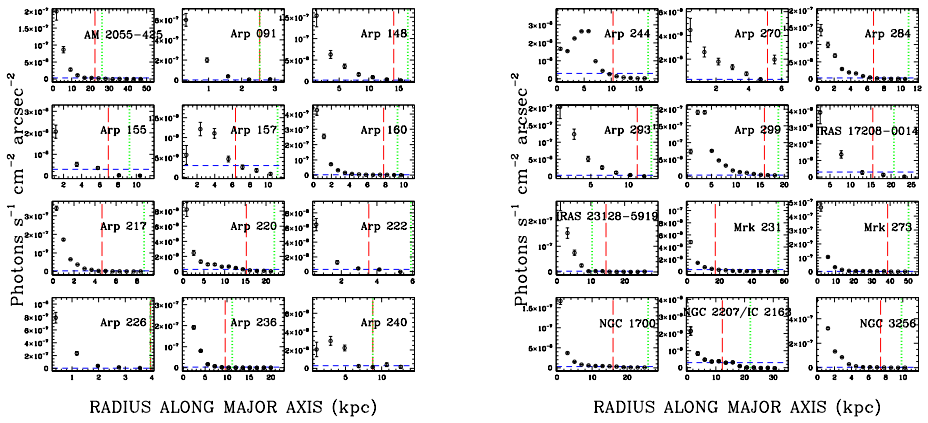
The load-bearing identity is the X-ray emission relation $L_X(\mathrm{gas}) = \Lambda n_e^2 f V$, relating the measured thermal luminosity to the cooling function $\Lambda$, the electron density $n_e$, the volume filling factor $f$, and the hot-gas volume $V$. Since only the product $n_e\sqrt{f}$ is determined, the paper sets the hot-gas mass to $M_X(\mathrm{gas}) = m_p n_e V$, effectively assuming $f=1$ and overestimating the mass by $1/\sqrt{f}$ if the gas is clumpy. Volumes come from ellipses fitted to 0.3–1.0 keV maps at a common surface-brightness cutoff of $3\times10^{-9}$ photons s$^{-1}$ cm$^{-2}$ arcsec$^{-2}$, chosen so that the enclosed counts match those inside the optical isophote within about 10 percent. This machinery converts the X-ray images plus spectra into the correlated quantities — hot gas volume, hot gas mass, and the hot-to-cold gas ratio — that are then compared with SFR, the stellar mass proxy $L_K$, dust temperature, and star-formation efficiency.
What would settle it
Measure electron densities independently of the filling factor for a subsample of these systems — for example, from X-ray line ratios, absorption measurements, or dispersion toward background sources — and recompute M_X(gas) using the measured f values; if f varies systematically with SFR, the claimed unity-slope M_X-SFR relation should either survive with f included or flatten, which would show that the linear relation was an artifact of the constant-f assumption.
Extended reading notes
Core claim
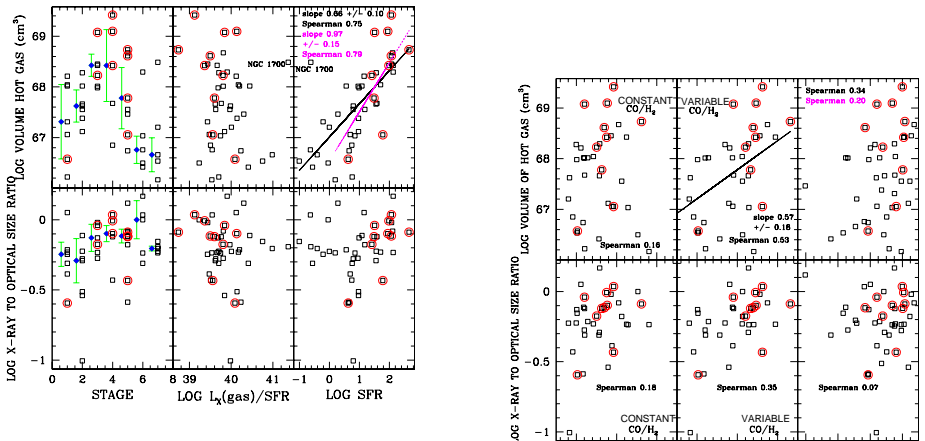
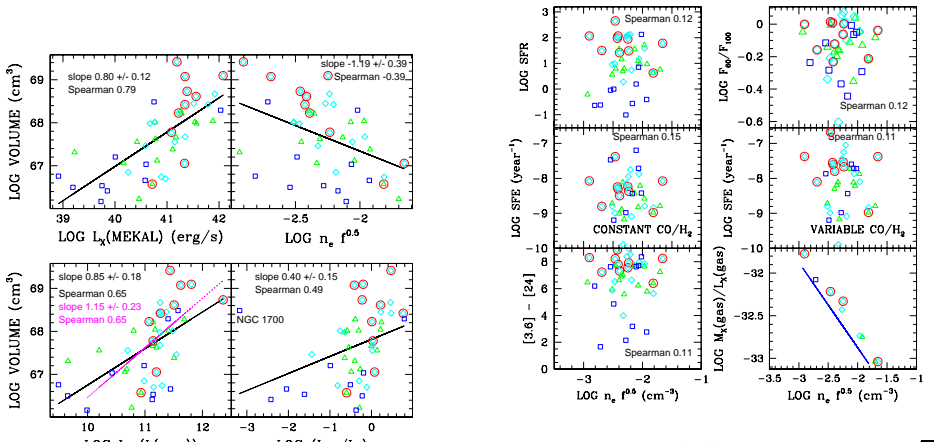
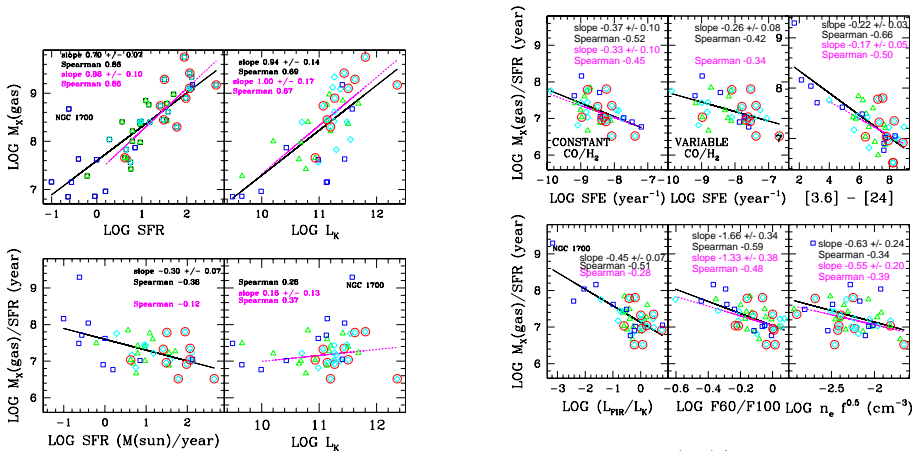
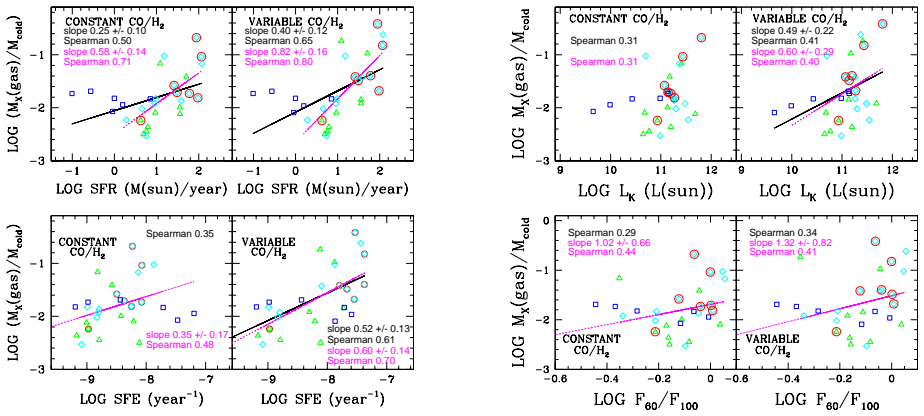
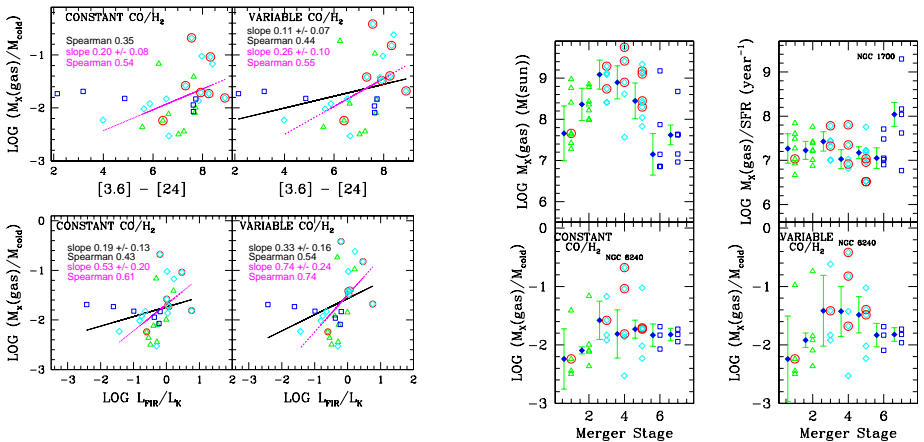
The central discovery claim is that in these 49 merging systems the hot X-ray-emitting gas behaves like a direct exhaust product of the current starburst: for SFR $> 1\,M_\odot\,\mathrm{yr}^{-1}$, $\log M_X(\mathrm{gas})$ versus $\log\,\mathrm{SFR}$ has slope $0.88 \pm 0.10$, and the hot gas volume versus SFR has slope $0.97 \pm 0.15$, both consistent with proportionality. The mass is computed from $L_X = \Lambda n_e^2 f V$ under an assumed temperature of 0.3 keV where no spectral temperature is available, and the hot-to-cold ratio $M_X(\mathrm{gas})/(M_{\mathrm{H}_2}+M_{\mathrm{HI}})$ increases with SFR, with a slope consistent with unity when a variable CO-to-H$_2$ ratio is used and low-SFR systems are excluded. This is presented as support for stellar and supernova feedback as the dominant hot-gas source in starbursting mergers, and as an observational match to hydrodynamic simulation predictions. Additional correlations, including an excess of hot gas in low-SFR, high-stellar-mass remnants and a possible deficit in low-mass systems, are flagged as uncertain because the sample contains few such galaxies.
Load-bearing premise
The hot-gas mass is calculated as if the emitting gas fills the entire fitted volume; only the product of the electron density and the square root of the filling factor is actually measured, so the quoted masses and all correlations built on them assume that the filling factor is either unity or does not vary systematically with star formation rate.
Editorial extensions
If this is right
- For high-SFR systems, the near-unity slopes imply that every unit of star formation produces roughly a fixed amount and volume of hot gas, so a merger boosts the hot-gas reservoir simply by boosting the star formation rate.
- The rising hot-to-cold gas mass ratio with SFR, consistent with hydrodynamic merger simulations, means the starburst redistributes interstellar mass toward the hot phase without destroying the cold reservoir that sustains the burst.
- The constancy of $M_X(\mathrm{gas})/\mathrm{SFR}$ at high SFR, with scatter near the measurement uncertainty of about 0.34–0.37 dex, argues for a near-steady-state feedback loop operating on a timescale comparable to the radiative cooling time and the roughly 100 Myr averaging time of the SFR indicator.
- Low-SFR, high-stellar-mass merger remnants deviate upward from the $M_X$ – SFR relation, identifying a separate hot-gas channel — likely virialized mass loss from old stars — that dominates when star formation is weak.
- The mild anti-correlation of $M_X(\mathrm{gas})/\mathrm{SFR}$ with the 60/100 micron flux ratio and with the 3.6–24 micron color points to the spatial concentration of young stars or the efficiency of early feedback, not the total SFR, as a second driver of hot-gas yield per unit star formation.
Reading between the lines
- If the linear $M_X$ – SFR relation is real, it supplies a direct conversion from an easily measured SFR to the size of the hot reservoir that regulates future star formation; one consequence is that the hot-gas mass could serve as a feedback calibrator for galaxy simulations without needing to resolve individual supernovae.
- The filling-factor degeneracy means the published masses are upper limits; if $f$ varies systematically with SFR, as simulations suggest for higher-density star formation, the reported slope could steepen or flatten once real filling factors are included, so an independent electron-density measurement is the decisive test.
- Applying the same surface-brightness-cutoff method to isolated starbursts and post-starbursts, not just mergers, would separate merger-specific effects such as tidal compression and triggered bursts from the universal feedback relation claimed here.
- If the low-SFR excess is indeed old-stellar mass loss, then the hot-gas mass of a post-merger elliptical may act as a clock: comparing $M_X/\mathrm{SFR}$ across remnants of different ages could map how the virialized hot halo accumulates after the starburst fades.
Signed reviews
Editorial analysis
A structured set of objections, weighed in public.
Referee Report
Summary. The paper uses archival Chandra observations of 49 nearby interacting galaxy pairs, mergers, and merger remnants to measure the spatial extent of diffuse hot gas. From the X-ray extent and the thermal luminosity taken from Paper I, the authors derive hot-gas volumes, electron-density estimates, and hot-gas masses, and correlate these with star formation rates, molecular and atomic gas masses, and other galaxy properties. The main claims are that for systems with SFR > 1 Msun/yr the hot-gas volume and mass correlate strongly and near-linearly with SFR, that the ratio of hot gas mass to cold gas mass increases with SFR, and that these trends are consistent with the Moreno et al. (2019) merger simulations. The paper also reports weak anti-correlations between M_X(gas)/SFR and dust temperature tracers and identifies possible excess hot gas in low-SFR, high-stellar-mass systems such as NGC 1700.
Significance. If the derived masses are reliable, the paper provides a valuable observational constraint on stellar feedback in merging systems using independent X-ray, CO, and HI data. Its strengths include a well-documented procedure for measuring X-ray extents, explicit checks against an alternative extraction method, tests of the assumed gas temperature, and comparisons using two CO-to-H2 conversion schemes. The comparison to an external simulation (Moreno et al. 2019) is a genuine test rather than a fit. The central correlation between hot-gas volume and SFR does not depend on the filling factor and appears robust. However, the hot-gas mass scale and all mass-based slopes depend on the unknown filling factor, as discussed below, so the headline mass-SFR slope and the hot-to-cold mass ratio comparison should be interpreted with caution until that degeneracy is addressed.
major comments (2)
- [Section 5 and Section 7.1] The derivation of M_X(gas) implicitly sets the filling factor f = 1. In Section 5 the paper correctly states that L_X(gas) = Lambda n_e^2 f V and that only the product n_e sqrt(f) can be determined, but then computes M_X(gas) = m_p n_e V by substituting the measured quantity n_e sqrt(f) for n_e. The resulting quantity is m_p V sqrt(L_X/(Lambda V)) = M_true/sqrt(f). For the range f ~ 0.1-0.9 quoted in Section 7.2, the masses are overestimated by factors of 1.05-3.2. More importantly, if f varies with SFR, then the derived slope d log M_X(derived)/d log SFR equals d log M_true/d log SFR - 0.5 d log f/d log SFR. Since Section 7.2 explicitly notes that simulations predict f to increase with the density of star formation and hence potentially with SFR, the headline slope of 0.88 +/- 0.10 in Section 7.1 is not a measurement of the true M_X-SFR relation unless f is constant or its SFR dependence is known. The authors should re-run the correlation analysis with a parameterized f(SFR) (e.g., using the Li et al. 2015 range) or otherwise quantify how the slope shifts.
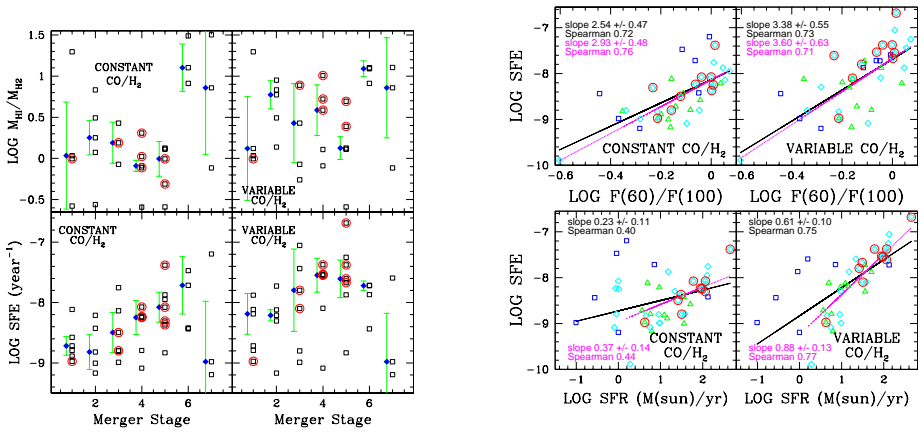
- [Sections 6.3 and 7.1] The same filling-factor degeneracy propagates into the hot-to-cold gas mass ratio M_X(gas)/(M_H2 + M_HI) and the comparison with the Moreno et al. (2019) simulations. If f increases with SFR while the true M_X-SFR slope is shallower than the derived slope, the reported increase of M_X(gas)/(M_H2 + M_HI) with SFR (slope 0.82 +/- 0.16 for the variable CO/H2 ratio and SFR > 1 Msun/yr, Table 5) could be partly an artifact of the 1/sqrt(f) factor. The paper acknowledges the degeneracy in Section 7.2 but does not propagate it into the correlation analysis or the simulation comparison. A quantitative test with an assumed filling-factor model is needed before the agreement with Moreno et al. can be considered established.
minor comments (5)
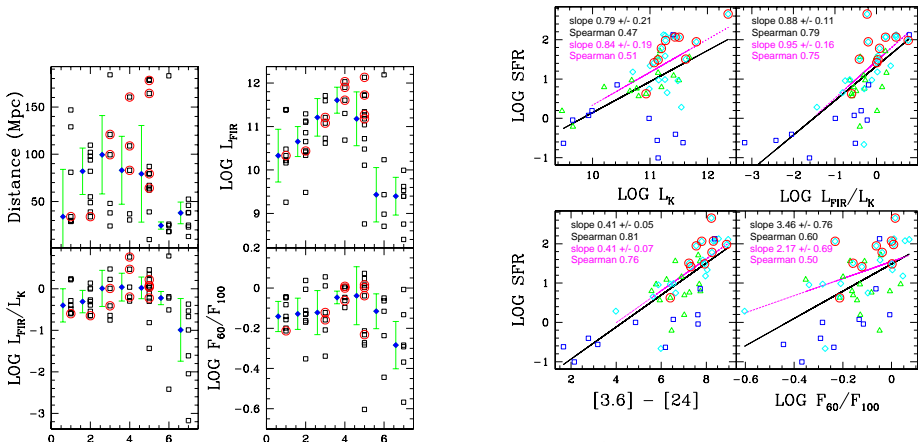
- [Figures 9-19] The figures showing the key correlations omit error bars entirely, despite the paper quoting a factor-of-two uncertainty in M_X(gas) and comparable uncertainties in volume. At minimum, representative error bars should be shown on the most load-bearing plots (Figures 13 and 15) so readers can judge the scatter against the uncertainties.
- [Table 5] Several rows in Table 5 refer to 'LOG n_e' (e.g., in the comparisons with volume and with M_X(gas)/SFR), but the paper only measures n_e sqrt(f), not n_e alone. The column headers and entries should be relabeled as log(n_e sqrt(f)) to avoid implying an independent determination of n_e.
- [Section 6.2] In the paragraph beginning 'As with NGC 1700', the text reads 'separating out this additional component to the hot gas is is uncertain'; the duplicated 'is' should be removed.
- [Section 8] The summary states 'we see a possible deficient of hot gas in low mass systems'; 'deficient' should be 'deficiency'.
- [Section 7.2] In the list of parameters that are not correlated, the sentence 'M X(gas)/SFR is not correlated with for a variable CO/H 2 ratio' is missing its subject; it should presumably read 'not correlated with SFE for a variable CO/H2 ratio'.
Circularity Check
The claimed M_X(gas) ∝ SFR relation is built into the definition of M_X(gas) from L_X(gas) and V, both of which already scale linearly with SFR.
-
self definitional
[Section 5 (L_X = Λ n_e^2 f V; M_X = m_p n_e V) combined with Section 6.1 (V–SFR slope) and Section 7.1 (M_X–SFR slope)]
"we used the relation L X(gas) = Λn e2fV ... From the X-ray luminosity, the volume, and the temperature we derive n e √ f ... We then calculated the mass of the hot X-ray-emitting gas M X(gas) = m pneV."
By the paper's own equations, log M_X = const + 0.5 log L_X + 0.5 log V (for fixed filling factor and cooling function). The paper states in the Introduction that L_X(gas) is proportional to SFR for star-forming galaxies (citing Paper I), and in Section 7.1 it reports that the V–SFR slope is 0.97 ± 0.15 for SFR > 1 M_sun/yr. Therefore log M_X = 0.5 log SFR + 0.5 log SFR = log SFR by construction. The headline slope 0.88 ± 0.10 in Section 7.1 is not an independent empirical confirmation of stellar feedback; it is the arithmetic mean of two input proportionalities already known to hold. The M_X/(M_H2+M_HI) vs. SFR correlation inherits the same constructed numerator.
full rationale
The paper is largely a legitimate observational study: it measures new X-ray spatial extents, uses external published CO and HI data, and compares with the independent Moreno et al. (2019) simulations. Paper I is a legitimate prior measurement of L_X(gas), not a fit to the target relation, so self-citation is not itself the problem. The central circularity is narrower: the derived quantity M_X(gas) is defined via M_X = m_p V sqrt(L_X/(Λ V)), so M_X ∝ sqrt(L_X V). Once the paper adopts L_X ∝ SFR (from Paper I) and measures V ∝ SFR, the M_X ∝ SFR result is forced by the definition rather than being a new physical constraint. The paper presents this as supporting feedback models, but the correlation is a derived identity from its inputs. The filling factor degeneracy (only n_e sqrt(f) is measured) is disclosed and discussed, and the temperature assumptions are tested; these are robustness caveats, not circularity. Because the central M_X–SFR 'prediction' reduces by construction, a score of 6 is appropriate; the rest of the analysis retains independent content.
Assumptions & free parameters
free parameters (6)
- Implicit filling factor f =
1 (assumed, not stated)
- Assumed gas temperature kT =
0.3 keV for 34 galaxies without spectral fits
- CO-to-H2 conversion factor =
2e20, 4e19, 5e20 cm^-2/(K km/s)
- Surface brightness cutoff for X-ray radius =
3e-9 photons s^-1 cm^-2 arcsec^-2
- Line-of-sight depth of hot gas ellipsoid =
average of major and minor axes
- Power-law photon index in spectral decomposition =
1.8
assumptions (6)
- domain assumption The thermal MEKAL component of the diffuse X-ray spectrum is entirely hot gas in the target galaxy, with the power-law component fully attributed to unresolved point sources.
- domain assumption The X-ray plasma is in collisional ionization equilibrium and emits according to a standard cooling function Lambda(T).
- domain assumption SFR estimates from UV and IR photometry trace star formation over about 100 Myr and are not strongly affected by AGN activity.
- standard math Distances assume H0 = 73 km/s/Mpc with peculiar velocity corrections.
- domain assumption K-band luminosity is a reliable stellar mass proxy.
- domain assumption The archival sample selection biases described by the authors do not drive the main correlations.
Cite this review
Pith. "Pith review of The Hot Gas Exhaust of Starburst Engines in Mergers: Testing Models of Stellar Feedback and Star Formation Regulation." pith.science (2026). https://pith.science/paper/FU4NNFFG
@misc{pith2026190809402,
  author       = {Pith},
  title        = {Pith review of: The Hot Gas Exhaust of Starburst Engines in Mergers: Testing Models of Stellar Feedback and Star Formation Regulation},
  year         = {2026},
  howpublished = {\url{https://pith.science/paper/FU4NNFFG}},
  note         = {Machine review of arXiv:1908.09402}
}
read the original abstract
Using archival data from the Chandra X-ray telescope, we have measured the spatial extent of the hot interstellar gas in a sample of 49 nearby interacting galaxy pairs, mergers, and merger remnants. For systems with SFR > 1 M(sun)/yr, the volume and mass of hot gas are strongly and linearly correlated with the star formation rate (SFR). This supports the idea that stellar/supernovae feedback dominates the production of hot gas in these galaxies. We compared the mass of X-ray-emitting hot gas Mx(gas) with the molecular and atomic hydrogen interstellar gas masses in these galaxies (M(H2) and M(HI), respectively), using published carbon monoxide and 21 cm HI measurements. Systems with higher SFRs have larger Mx(gas)/(M(H2) + M(HI)) ratios on average, in agreement with recent numerical simulations of star formation and feedback in merging galaxies. The Mx(gas)/(M(H2) + M(HI)) ratio also increases with dust temperature on average. The ratio Mx(gas)/SFR is anti-correlated with the IRAS 60 micron to 100 micron flux ratio and with the Spitzer 3.6 micron to 24 micron. These trends may be due to variations in the spatial density of young stars, the stellar age, the ratio of young to old stars, the initial mass function, and/or the efficiency of stellar feedback. Galaxies with low SFR (<1 M(sun)/yr) and high K band luminosities may have an excess of hot gas relative to the relation for higher SFR galaxies, while galaxies with low K band luminosities (and therefore low stellar masses) may have a deficiency in hot gas, but our sample is not large enough for strong statistical significance.
Figures
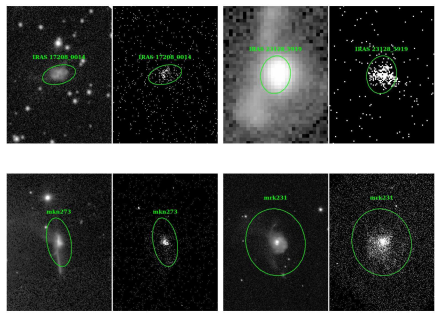
Figures from the paper (12 more)



Reference graph
Works this paper leans on
-
[1]
& Kravtsov, A
Agertz, O. & Kravtsov, A. V. 2015, ApJ, 804, 18
2015
-
[2]
& Kravtsov, A
Agertz, O. & Kravtsov, A. V. 2016, ApJ, 824, 79
2016
-
[3]
V., Leitner, S
Agertz, O., Kravtsov, A. V., Leitner, S. N., & Gnedin, N. Y. 2013, ApJ, 770, 25
2013
-
[4]
2018, A&A, 617, 33
Andreani, P., Boselli, A., Ciesla, L., Vio, R., Cortese, L., Buat, V., & Miyamoto, Y. 2018, A&A, 617, 33
2018
-
[5]
Arp, H. C. 1966, Atlas of Peculiar Galaxies (Pasadena, CA: Caltech)
1966
-
[6]
& Heckman, T
Balick, B. & Heckman, T. 1981, A&A, 96, 271
1981
-
[7]
Bell, E. F. & de Jong, R. S. 2000, ApJ, 550, 212
2000
-
[8]
D., Wolfire, M., & Leroy, A
Bolatto, A. D., Wolfire, M., & Leroy, A. K. 2013, ARAA, 51, 207
2013
Show all 148 references
-
[9]
2011, ApJ, 729, 12
Boroson, B., Kim, D.-W., & Fabbiano, G. 2011, ApJ, 729, 12
2011
-
[10]
et al.\ 2011, ApJ, 730, 4
Bournaud, F., Chapon, D., Teyssier, R. et al.\ 2011, ApJ, 730, 4
2011
-
[11]
J., Ponman, T
Brassington, N. J., Ponman, T. J., & Read, A. M. 2007, , 337, 1439
2007
-
[12]
A., Feige, J., & Dettbarn, C
Breitschwerdt, D., de Avillez, M. A., Feige, J., & Dettbarn, C. 2012, AN, 333, 486
2012
-
[13]
Brinchmann, J., Charlot, S., White, S. D. M., et al.\ 2004, MNRAS, 351, 1151
2004
-
[14]
B., Stinson, G., Gibson, B
Brook, C. B., Stinson, G., Gibson, B. K., Wadsley, J., & Quinn, T. 2012, MNRAS, 424, 1275
2012
-
[15]
Brown, R. J. N., Forbes, D. A., Kissler-Patig, M., & Brodie, J. P. 2000, MNRAS, 317, 406
2000
-
[16]
& Wilson, C, 2019, ApJ, in press (arXiv: 1905.06950)
Brown, T. & Wilson, C, 2019, ApJ, in press (arXiv: 1905.06950)
2019 arXiv
-
[17]
Bushouse, H. A. 1987, ApJ, 320, 49
1987
-
[18]
A., Lord, S
Bushouse, H. A., Lord, S. D., Lamb, S. A., Werner, M. W., & Lo, K. Y. 1999, astro-ph/9911186
1999 arXiv
-
[19]
G., & D'Onghia, E
Bustard, C., Zweibel, E. G., & D'Onghia, E. 2016, ApJ, 819, 29
2016
-
[20]
1991 A&A, 251, 1
Casoli, F., Dupraz, C., Combes, F., & Kazes, I. 1991 A&A, 251, 1
1991
-
[21]
Chevalier, R. A. & Clegg, A. W. 1985, Nature, 317, 44
1985
-
[22]
1991, ApJ, 376, 380
Ciotti, L., D'Ecole, A., Pellegrini, S., & Renzini, A. 1991, ApJ, 376, 380
1991
-
[23]
Ciotti, L., Pellegrini, S., Negri, A., & Ostriker, J. P. 2017, ApJ, 835, 15
2017
-
[24]
C\^ot\'e, S., Carignan, C., & Freeman, K. C. 2000, AJ, 120, 3027
2000
-
[25]
Cox, A. L. & Sparke, L. S. 2004, AJ, 128, 2013
2004
-
[26]
J., Dutta, S
Cox, T. J., Dutta, S. N., Di Matteo, T., et al.\ 2006a, ApJ, 650, 791
-
[27]
J., Di Matteo, T, Hernquist, L, et al.\ 2006b, ApJ, 643, 692
Cox, T. J., Di Matteo, T, Hernquist, L, et al.\ 2006b, ApJ, 643, 692
-
[28]
J., Jonsson, P., Primack, J
Cox, T. J., Jonsson, P., Primack, J. R., & Somerville, R. 2006c, MNRAS, 373, 1013
-
[29]
Daddi, E., Elbaz, D., Walter, F., et al.\ 2010, ApJ, 714, 418
2010
-
[30]
M., Hartmann, D., & Thaddeus, P
Dame, T. M., Hartmann, D., & Thaddeus, P. 2001, ApJ, 547, 792
2001
-
[31]
Desert, F.-X., Boulanger, F., & Puget, J. L. 1990, A&A, 237, 215
1990
-
[32]
-L., & Semelin, B
Di Matteo, P., Bournaud, F., Martig, M., Combes, F., Melchior, A. -L., & Semelin, B. 2008, A&A, 492, 31
2008
-
[33]
& Solomon, P
Downes, D. & Solomon, P. M. 1998, ApJ, 507, 615
1998
-
[34]
T., Drinkwater, M
Doyle, M. T., Drinkwater, M. J., Rohde, D. J., et al.\ 2005, MNRAS, 361, 34
2005
-
[35]
1995, A&A, 303, 345
Elbaz, D., Arnaud, M., & Vangioni-Flam, E. 1995, A&A, 303, 345
1995
-
[36]
L., Patton, D
Ellison, S. L., Patton, D. R., Simard, L., & McConnachie, A. W. 2008, ApJ, 672, L107
2008
-
[37]
G., Kaufman, M., Bournaud, F., et al.\ 2016, ApJ, 823, 26
Elmegreen, B. G., Kaufman, M., Bournaud, F., et al.\ 2016, ApJ, 823, 26
2016
-
[38]
P., Freeman, K
English, J., Norris, R. P., Freeman, K. C., & Booth, R. S. 2003, AJ, 125, 1134
2003
-
[39]
Fensch, J., Renaud, F., Bournaud, F., et al.\ 2017, MNRAS, 465, 1934
2017
-
[40]
O., Schweizer, F., & van Gorkom, J
Fern\'andez, X., Petric, A. O., Schweizer, F., & van Gorkom, J. H. 2014, AJ, 147, 74
2014
-
[41]
& Dav\'e, R
Finlator, K. & Dav\'e, R. 2008, MNRAS, 385, 2181
2008
-
[42]
E., Ma, C.-P., et al.\ 2016, ApJ, 826, 167
Goulding, A., Greene, J. E., Ma, C.-P., et al.\ 2016, ApJ, 826, 167
2016
-
[43]
& Solomon, P
Gao, Y. & Solomon, P. M. 2004, ApJS, 152, 63
2004
-
[44]
Gaspari, M., Eckert, D., Ettori, S., et al.\ 2019, astro-ph/1904.10972
2019 arXiv
-
[45]
A., & Norris, R
Georgakakis, A., Forbes, D. A., & Norris, R. P. 2000, , 318, 124
2000
-
[46]
M., Caulton, A., Wiklind, T., Terlevich, A
Georgakakis, A., Hopkins, A. M., Caulton, A., Wiklind, T., Terlevich, A. I., & Forbes, D. A. 2001, MNRAS, 326, 1431
2001
-
[47]
2001, MNRAS, 326, 578
Gordon, S., Koribalski, B., & Jones, K. 2001, MNRAS, 326, 578
2001
-
[48]
P., Heckman, T., Strickland, D., & Ptak, A
Grimes, J. P., Heckman, T., Strickland, D., & Ptak, A. 2005, ApJ, 628, 187
2005
-
[49]
C., Torrey, P., Springel, V., Hernquist, L., & Vogelsberger, M
Hayward, C. C., Torrey, P., Springel, V., Hernquist, L., & Vogelsberger, M. 2014, MNRAS, 442, 1992
2014
-
[50]
M., Alexandroff, R
Heckman, T. M., Alexandroff, R. M., Borthakur, S., Overzier, R., & Leitherer, C. 2015, ApJ, 809, 147
2015
-
[51]
Hibbard, J. E. & van Gorkom, J., 1996, , 111, 655
1996
-
[52]
S., Salzer, J
Hirschauer, A. S., Salzer, J. J., Janowiecki, S., & Wegner, G. A. 2018, AJ, 155, 82
2018
-
[53]
F., Quataert, E., & Murray, N
Hopkins, P. F., Quataert, E., & Murray, N. 2011, MNRAS, 417, 950
2011
-
[54]
F., Quataert, E., & Murray, N
Hopkins, P. F., Quataert, E., & Murray, N. 2012b, MNRAS, 421, 3488
-
[55]
F., Quataert, E., & Murray, N
Hopkins, P. F., Quataert, E., & Murray, N. 2012a, MNRAS, 421, 3522
-
[56]
F., Kere s , D., Norman, M., Hernquist, L., Narayanan, D., & Hayward, C
Hopkins, P. F., Kere s , D., Norman, M., Hernquist, L., Narayanan, D., & Hayward, C. C. 2013, MNRAS, 433, 78
2013
-
[57]
2014, MNRAS, 445, 581
Hopkins, P., Kere s , D., \"Onorbe, J. 2014, MNRAS, 445, 581
2014
-
[58]
F., Narayanan, D., Murray, N., & Quataert, E
Hopkins, P. F., Narayanan, D., Murray, N., & Quataert, E. 2013b, MNRAS, 433, 69
-
[59]
1995, A&A, 298, 743
Horellou, C., Casoli, F., Combes, F., & Dupraz, C. 1995, A&A, 298, 743
1995
-
[60]
Houck, J. C. & Denicola, L. A. 2000, Astronomical Data Analysis Software and Systems IX, ASP Conference Proceedings, Vol. 216, ed. N. Manset, C. Veillet, & D. Crabtree, Astronomical Society of the Pacific, p. 591
2000
-
[61]
Huchtmeier, W. K. & Richter, O.-G. 1989, A General Catalog of HI Observations of Galaxies (New York: Springer-Verlag)
1989
-
[62]
& Portinari, L
Into, T. & Portinari, L. 2013, MNRAS, 430, 2715
2013
-
[63]
Inami, H., Armus, L., Charmandaris, V., et al.\ 2013, ApJ, 777, 156
2013
-
[64]
Israel, F. P. 2005, A&A, 438, 8551
2005
-
[65]
I., Guseva, N
Izotov, Y. I., Guseva, N. G., Fricke, K. J., & Henkel, C. 2014, A&A, 561, A33
2014
-
[66]
I., Guseva, N
Izotov, Y. I., Guseva, N. G., Fricke, K. J., & Henkel, C. 2015, MNRAS, 451, 2251
2015
-
[67]
P., Richards, G
Jester, S., Schneider, D. P., Richards, G. T., et al.\ 2005, AJ, 130, 873
2005
-
[68]
2019, ApJS, arXiv:1905.07823
Jo, Y.-S., Seon, K., Min, K.-W., Edelstein, J., & Han, W. 2019, ApJS, arXiv:1905.07823
2019 arXiv
-
[69]
T., Moustakas, J., Shirley, Y
Juneau, S., Narayanan, D. T., Moustakas, J., Shirley, Y. L., Bussmann, R. S., Kennicutt, R. C., Jr., & Vander Bout, P. A. 2009, ApJ, 707, 1217
2009
-
[70]
Kennicutt, R. C., Jr. 1998, ARAA, 36, 189
1998
-
[71]
Kennicutt, R. C. & Evans, N. J. 2012, ARAA, 50, 531
2012
-
[72]
C., Jr., Hao, C.-N., Calzetti, D., et al.\ 2009, ApJ, 703, 1672
Kennicutt, R. C., Jr., Hao, C.-N., Calzetti, D., et al.\ 2009, ApJ, 703, 1672
2009
-
[73]
Kere s , D., Katz, N., Dav\'e, R., Fardal, M., & Weinberg, D. H. 2009, MNRAS, 396, 2332
2009
-
[74]
& Fabbiano, G
Kim, D.-W. & Fabbiano, G. 2013, ApJ, 776, 116
2013
-
[75]
& Ostriker, E
Kim, C.-G. & Ostriker, E. C. 2017, ApJ, 846, 133
2017
-
[76]
2011, ApJ, 732, 33
Kleineberg, K., S\'anchez-Bl\' a zquez, P., & Vazdekis, A. 2011, ApJ, 732, 33
2011
-
[77]
2007, MNRAS, 375, 673
K\"oppen, J., Weidner, C., & Kroupa, P. 2007, MNRAS, 375, 673
2007
-
[78]
Koski, A. T. 1978, ApJ, 223, 56
1978
-
[79]
K., Moorwood, A
Kotilainen, J. K., Moorwood, A. F. M., Ward, M. J., & Forbes, D. A. 1996, A&A, 305, 107
1996
-
[80]
M., Sirk, M., Sankrit, R., et al.\ 2006, AAS, 209, 1702
Kregenow, J. M., Sirk, M., Sankrit, R., et al.\ 2006, AAS, 209, 1702
2006
-
[81]
A., Cepa, J., Bongiovanni, A., et al.\ 2010, A&A, 521, 53
Lara-L\'opez, M. A., Cepa, J., Bongiovanni, A., et al.\ 2010, A&A, 521, 53
2010
-
[82]
B., Barnes, J
Larson, K., Sanders, D. B., Barnes, J. E., et al.\ 2016, ApJ, 825, 128
2016
-
[83]
& Wang, Q
Li, J.-T. & Wang, Q. D. 2013, MNRAS, 435, 3071
2013
-
[84]
P., Cen, R., Bryan, G
Li, M., Ostriker, J. P., Cen, R., Bryan, G. L., & Naab, T. 2015, ApJ, 814, 4
2015
-
[85]
M., Jonsson, P., Cox, T
Lotz, J. M., Jonsson, P., Cox, T. J., & Primack, J. R. 2000, MNRAS, 391, 1137
2000
-
[86]
F., Faucher-Giguere, C.-A., et al.\ 2016, MNRAS, 456, 2140
Ma, X., Hopkins, P. F., Faucher-Giguere, C.-A., et al.\ 2016, MNRAS, 456, 2140
2016
-
[87]
2010, MNRAS, 408, 2115
Mannucci, F., Cresci, G., Maiolini, R., Marconi, A., & Gnerucci, A. 2010, MNRAS, 408, 2115
2010
-
[88]
M., Bottinelli, L., Dennefeld, M., & Gouguenheim, L
Martin, J. M., Bottinelli, L., Dennefeld, M., & Gouguenheim, L. 1991, A&A, 245, 393
1991
-
[89]
1998, MNRAS, 300, 872
Maraston, C. 1998, MNRAS, 300, 872
1998
-
[90]
Mathews, W. G. & Brighenti, F. 2003, ARA&A, 41, 191
2003
-
[91]
1987, in Spectroscopy of Astrophysical Plasmas, ed
McCray, R. 1987, in Spectroscopy of Astrophysical Plasmas, ed. A. Dalgarno & D. Layzer (Cambridge: Cambridge Univ. Press), 260
1987
-
[92]
McKee, C. F. & Cowie, L. L. 1977, ApJ, 215, 213
1977
-
[93]
McQuinn, K. B. W., Skillman, E. D., Heilman, T. N., Mitchell, N. P., & Kelley, T. 2018, 477, 3164
2018
-
[94]
2016, MNRAS, 461, 2762
Meiksin, A. 2016, MNRAS, 461, 2762
2016
-
[95]
2012b, , 426, 1870
Mineo, S., Gilfanov, M., & Sunyaev, R. 2012b, , 426, 1870
-
[96]
F., Booth, R
Mirabel, I. F., Booth, R. S., Garay, G., Johansson, L. E. B., & Sanders, D. B. 1990, A&A, 236, 327
1990
-
[97]
L., et al.\ 2019, MNRAS, 485, 1320
Moreno, J., Torrey, P., Ellison, S. L., et al.\ 2019, MNRAS, 485, 1320
2019
-
[98]
L., Kere s , D., Faucher-Gigu\`ere, C.-A., et al.\ 2015, MNRAS, 454, 2691
Muratov, A. L., Kere s , D., Faucher-Gigu\`ere, C.-A., et al.\ 2015, MNRAS, 454, 2691
2015
-
[99]
G., Weiner, B
Noeske, K. G., Weiner, B. J., Faber, S. M., et al.\ 2007, ApJ, 660, L43
2007
-
[100]
& Rawlings, S
Obreschkow, D. & Rawlings, S. 2009, MNRAS, 394, 1857
2009
-
[101]
Owen, R. A. & Warwick, R. S. 2009, , 394, 1741
2009
-
[102]
E., Hayward, C
Orr, M. E., Hayward, C. C., Hopkins, P. F., et al.\ 2018, MNRAS, 478, 3653
2018
-
[103]
A., & Ponman, T
O'Sullivan, E., Forbes, D. A., & Ponman, T. J. 2001, MNRAS, 328, 461
2001
-
[104]
P., van der Werf, P
Papadopoulos, P. P., van der Werf, P. P., Xilouris, E. M., et al.\ 2012, MNRAS, 426, 2601
2012
-
[105]
& Ciotti, L
Pellegrini, S. & Ciotti, L. 1998, A&A, 333, 433
1998
-
[106]
Renaud, F., Bournaud, F., Agertz, O., et al.\ 2019, A&A, 625, 65
2019
-
[107]
Bournaud, F., Emsellem, E., et al.\ 2013, MNRAS, 436, 1836
Renaud, F. Bournaud, F., Emsellem, E., et al.\ 2013, MNRAS, 436, 1836
2013
-
[108]
et al.\ 2015, MNRAS, 454, 3299
Renaud, F., Bournaud, F., Emsellem, E. et al.\ 2015, MNRAS, 454, 3299
2015
-
[109]
2014, MNRAS, 442, L33
Renaud, F., Bournaud, F., Kraljic, K., & Duc, P.-A. 2014, MNRAS, 442, L33
2014
-
[110]
H., Lebofsky, M
Rieke, G. H., Lebofsky, M. J., Thompson, R. I., Low, F. J., & Tokunaga, A. T. 1980, ApJ, 238, 24
1980
-
[111]
J., Salzer, J
Sage, L. J., Salzer, J. J., Loose, H.-H., & Henkel, C. 1992, A&A, 265, 19
1992
-
[112]
V., Navarro, J
Sales, L. V., Navarro, J. F., Oman, K., et al.\ 2017, MNRAS, 464, 2419
2017
-
[113]
M., Charlot, S., et al.\ 2007, ApJS, 173, 267
Salim, S., Rich, R. M., Charlot, S., et al.\ 2007, ApJS, 173, 267
2007
-
[114]
Sanders, D. B. & Mirabel, I. F. 1996, ARAA, 34, 749
1996
-
[115]
B., Scoville, N
Sanders, D. B., Scoville, N. Z., & Soifer, B. T. 1991, ApJ, 370, 158
1991
-
[116]
& Seitzer, P
Schweizer, F. & Seitzer, P. 1992, AJ, 104, 1039
1992
-
[117]
1959, ApJ, 129, 243
Schmidt, M. 1959, ApJ, 129, 243
1959
-
[118]
J., Kleinmann, S
Smith, B. J., Kleinmann, S. G., Huchra, J. P., & Low, F. J. 1987, ApJ, 318, 161
1987
-
[119]
J., Campbell, K., Struck, C., et al.\ 2018, AJ, 155, 81
Smith, B. J., Campbell, K., Struck, C., et al.\ 2018, AJ, 155, 81
2018
-
[120]
J., Struck, C., Hancock, M., Appleton, P
Smith, B. J., Struck, C., Hancock, M., Appleton, P. N., Charmandaris, V., & Reach, W. T. 2007, AJ, 133, 791
2007
-
[121]
J., Swartz, D
Smith, B. J., Swartz, D. A., Miller, O., et al. 2012, , 142, 144
2012
-
[122]
A., Herter, T., Haynes, M
Smith, D. A., Herter, T., Haynes, M. P., Beichman, C. A., & Gautier, T. N. 1996, ApJS, 104, 217
1996
-
[123]
T., Sanders, D
Soifer, B. T., Sanders, D. B., Madore, B. F., et al.\ 1987, ApJ, 320, 238
1987
-
[124]
M., Downes, D., & Radford, S
Solomon, P. M., Downes, D., & Radford, S. J. E. 1992, ApJ, 387, L55
1992
-
[125]
M., Downes, D., Radford, S
Solomon, P. M., Downes, D., Radford, S. J. E., & Barrett, J. W. 1997, ApJ, 478, 144
1997
-
[126]
& Springel, V
Sparre, M. & Springel, V. 2016a, MNRAS, 462, 2418
-
[127]
2000, MNRAS, 312, 859
Springel, V. 2000, MNRAS, 312, 859
2000
-
[128]
S., Smecker-Hane, T., & Cecil, G
Statler, T. S., Smecker-Hane, T., & Cecil, G. N. 1996, AJ, 111, 1512
1996
-
[129]
K., Heckman, T
Strickland, D. K., Heckman, T. M., Weaver, K. A., & Dahlem, M. 2000, AJ, 120, 2965
2000
-
[130]
K., Heckman, T
Strickland, D. K., Heckman, T. M., Colbert, E. J. M., Hoopes, C. G., & Weaver, K. A. 2004a, ApJS, 151, 193
-
[131]
K., Heckman, T
Strickland, D. K., Heckman, T. M., Colbert, E. J. M., Hoopes, C. G., & Weaver, K. A. 2004b, ApJ, 606, 829
-
[132]
Strickland, D. K. & Stevens, I. R. 2000, MNRAS, 314, 511
2000
-
[133]
A., White, R
Su, Y., Irwin, J. A., White, R. E., & Cooper, M. C. 2015, ApJ, 806, 156
2015
-
[134]
2010, ApJ, 720, L149
Teyssier, R., Chapon, D., & Bournaud, F. 2010, ApJ, 720, L149
2010
-
[135]
2011, MNRAS, 416, 1936
Torres-Flores, S., Epinat, B., Amram, P., Plana, H., & Mendes de Olivera, C. 2011, MNRAS, 416, 1936
2011
-
[136]
Torrey, P., Vogelberger, M., Marinacci, F., et al.\ 2019, MNRAS, 484, 5587
2019
-
[137]
S., & Primack, J
Trujillo-Gomez, S., Klypin, A., Col\'in, P., Ceverino, D., Arraki, K. S., & Primack, J. 2015, MNRAS, 446, 1140
2015
-
[138]
S., et al.\ 2014, ApJS, 214, 29
Ueda, J., Iono, D., Yun, M. S., et al.\ 2014, ApJS, 214, 29
2014
-
[139]
F., et al.\ 2016, MNRAS, 463, 4533
van de Voort, F., Quataert, E., Hopkins, P. F., et al.\ 2016, MNRAS, 463, 4533
2016
-
[140]
van den Bosch, F. C. 2000, ApJ, 530, 177
2000
-
[141]
van Driel, W., Arnaboldi, M., Combes, F., & Sparke, L. S. 2000, A&AS, 141, 385
2000
-
[142]
2013, MNRAS, 435, 2274
Weider, C., Ferraras, I., Vazdekis, A., & La Barbera, F. 2013, MNRAS, 435, 2274
2013
-
[143]
1995, A&A, 297, 643
Wiklind, T., Combes, F., & Henkel, C. 1995, A&A, 297, 643
1995
-
[144]
J., II., Shirley, Y
Wu, J., Evans, N. J., II., Shirley, Y. L., & Knez, C. 2010, ApJS, 188, 313
2010
-
[145]
S., Allen, L., Kenney, J
Young, J. S., Allen, L., Kenney, J. D. P., Lesser, A., & Rownd, B. 1996, AJ, 112, 1903
1996
-
[146]
S., Kenney, J
Young, J. S., Kenney, J. D., Tacconi, L., Claussen, M. J., Huang, Y.-L., & Tacconi-Garman, L. 1986, ApJ, 311, L17
1986
-
[147]
A., Murray, N., & Quataert, E
Zhang, D., Thompson, T. A., Murray, N., & Quataert, E. 2014, ApJ, 784, 93
2014
-
[148]
R., Davoust, E., Frayer, D
Zhu, M., Seaquist, E. R., Davoust, E., Frayer, D. T., & Bushouse, H. A. 1999, AJ, 118, 145
1999
Reviewed August 14, 2026 · model on record in the stance chip above.
Discussion (0). Continue with ORCID to comment.