REVIEW 3 major objections 3 minor 5 references
Using a 3D printer for 2D beam profile measurements in proton radiotherapy
T0 review · 3 major / 3 minor · reviewed 2026-08-14 · deepseek-v4-flash
Pith's one-line read A 3D printer and diode measure 2D proton beam profiles
desk verdict A genuinely practical, honestly limited instrumentation note: a $250 printer and a $0.46 diode do produce usable 2D proton beam profiles, but the missing beam monitor and the self-referential Eq. 5 check mean the results stay preliminary. read the letter →
The pith
A machine-rendered reading of the paper's core claim, the machinery that carries it, and where it could break.
The reading
What carries the argument
The mechanism carrying the argument is the pair of calibrated conversions: the 3D printer's z step pulses imply a constant scan speed of 7.28 mm/s, so oscilloscope time becomes distance; and the pre-irradiated diode's measured sensitivity (0.107 nC per cGy to water) together with the amplifier gain (0.103 V/nA) converts current to dose rate. The Gaussian smoothing kernel (sigma = 5 raw intervals, 100 ms) reduces Poisson noise from the small active volume, and the Fortran contour algorithm turns the smoothed scans into a 2D dose map.
What would settle it
Set up the same 3D-printer scanner with an ionization chamber recording the beam current during the scan, then deliberately vary the current by ±10% and compare the resulting contour with the nominal one; if the contour changes by more than the 4% peak discrepancy, the no-monitor assumption is the cause and the claim of a 20-minute 2D map without normalization fails.
Extended reading notes
Core claim
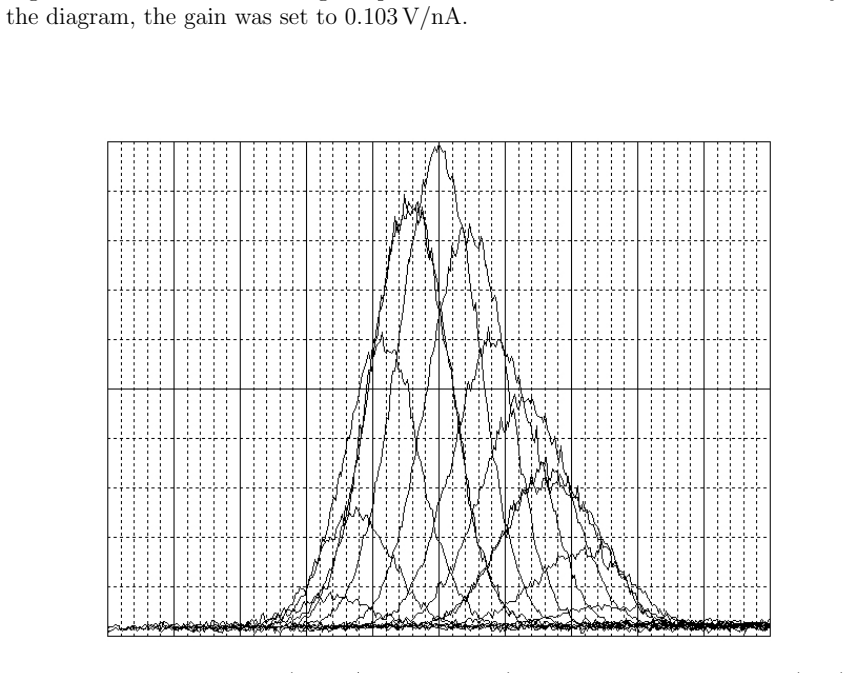
On the paper's own terms, the central claim is that a $250-class 3D printer, whose z-axis moves at a constant known speed of 7.28 mm/s, can serve as a precision scanner for proton dose mapping. A surface-mount rectifier diode with known calibration (0.107 nC per cGy to water) is mounted edge-on to the beam and its current is integrated in software via an amplifier. The stepmotor pulses trigger an oscilloscope sweep, so the time axis converts directly to z position. The resulting 14 scans, smoothed with a Gaussian with sigma = 100 ms, yield a 2D contour with 90% to 10% contours; the peak voltage (5.67 V) agrees with the predicted 5.88 V from the dose-rate formula. No diode sensitivity loss was observed at ~530 cGy/s peak dose. The paper concludes that this combination is a viable option for rapid characterization of small beams.
Load-bearing premise
The beam current stayed constant throughout the 20-minute run, because there was no beam monitor; any drift would distort the relative heights of the z-scans and therefore the 2D contour.
Editorial extensions
If this is right
- A 3D printer plus diode can replace overqualified x-y tables for small-field proton beam characterization at a fraction of the cost.
- With G-code control and a beam monitor, the full 2D measurement time can drop from 20 minutes to about 1 minute.
- The same approach can be extended to 3D dose mapping by mounting a small water tank on the printer table and scanning depth as well as transverse position.
- The measured contour correctly shows the expected beam asymmetry (smaller spread in the bend plane and a tail in x), indicating the method resolves features at the millimeter level.
Reading between the lines
- A natural extension of the same setup, not tested in the paper, is to replace the hand-jogged x positioning with G-code-driven raster motion; if the printer's x and z axes are both logged, absolute 2D dose maps could be produced in about a minute without any manual steps.
- The paper's implied comparison to commercial x-y tables suggests a testable cost-performance frontier: a printer with claimed ±0.1 mm repeatability could be validated against a calibrated film measurement on a 10 mm beam, quantifying the tradeoff between resolution and scan time.
- Because the diode is edge-on, the effective width in z is tiny; this geometry could be pushed toward a true 1D line probe for depth-dose scans, with the same printer moving a small water tank in depth as the authors propose.
Signed reviews
Editorial analysis
A structured set of objections, weighed in public.
Referee Report
Summary. The paper reports a proof-of-concept measurement in which a consumer 3D printer (da Vinci MiniMaker) is used to translate a small pre-irradiated silicon diode (DFLR1600) through a 228 MeV proton beam, acquiring 12 z-scans at x positions spaced by 2 mm plus two repeat scans, all within 20 minutes. The diode is mounted edge-on, giving sub-millimeter resolution in z, and the z-motor step pulses are used to trigger a 10 s oscilloscope sweep. After Gaussian smoothing of the raw current signal, the authors present 1D profiles along z for each x, a 2D contour plot with contours from 90% to 10%, and a rough absolute check of the peak voltage using a cylindrical Gaussian model for the beam. The abstract and discussion claim that a 3D printer plus diode is a viable option for rapid small-beam characterization, and they propose improvements such as a G-code-capable printer, a beam monitor, and step-pulse recording for future work.
Significance. If the measurement is valid, the paper demonstrates a remarkably low-cost alternative to dedicated scanning systems for 2D proton beam profiling, with fine z-resolution, modest x-resolution, and a total measurement time of about 20 minutes. The use of a $0.46 diode and a sub-$250 printer is novel for this application, and the authors are explicit about the setup's limitations and needed improvements. The paper also provides a useful practical data point on the diode's stability at high dose rates (~530 cGy/s peak). However, the significance is limited by the absence of an independent validation detector and by the lack of a quantitative uncertainty budget; the stated 'viability' claim therefore requires additional evidence.
major comments (3)
- [Sec. 3 (Procedure) and Sec. 5, Discussion item 5] The absence of a beam monitor is load-bearing for the 2D contour shown in Fig. 6. The paper states in Sec. 3 that the cyclotron current is trimmed to 1 nA before each z-scan, and in Sec. 5 item 5 it is acknowledged that there was no beam monitor. Because each z-scan takes 10 s and the 12 x positions are acquired sequentially over ~20 minutes, any drift in beam current between or during scans directly corrupts the relative intensities that define the 2D contour. The two repeat scans show overall reproducibility but cannot detect within-scan drift or slow monotonic drift that affects all scans similarly. The claim that the measured 2D distribution is correct therefore requires either beam-monitor normalization or an independent comparison against a reference detector.
- [Sec. 4, Eq. (5)] The 'predicted' peak voltage is not an independent check of the measurement. Equation (5) uses an effective beam area derived from r60 = 3.5 mm, which the text states is inferred from the fourth contour of the very same measured data (Fig. 6). The agreement between 5.88 V and 5.67 V therefore only demonstrates internal consistency; it cannot validate the absolute scale or shape of the measured profile. If the profile is systematically distorted by beam-current drift or scan-speed error, both the effective area and the predicted peak would change in a self-consistent manner. A meaningful check requires a comparison with film, a diode array, or an independent beam-size measurement.
- [Sec. 4 (Analysis) and Fig. 6] The manuscript provides no uncertainty analysis for any reported quantity: the beam width (r60), the effective area, the peak voltage, or the contour positions. The smoothing parameter sigma is set to 100 ms (5 raw intervals) and is described as 'tunable,' but no sensitivity study is shown. For a detector-characterization paper in an instrumentation journal, a quantitative statement of uncertainty—including the contribution of the diode calibration, amplifier gain, scan-speed assumption, and beam-current instability—is necessary to support the claim that the method is 'viable' for quantitative beam profiling.
minor comments (3)
- [Sec. 2 (Equipment)] The sentence 'The active area is 1× 1× mm2' appears to contain a typographical error; the units should likely be '1 × 1 mm2'.
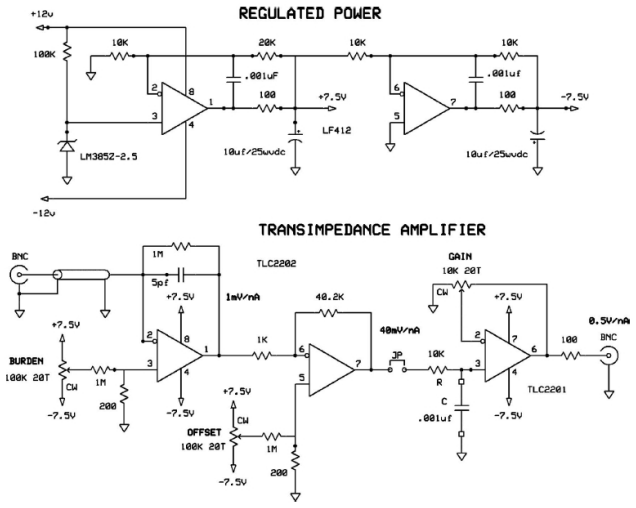
- [Sec. 2 and Fig. 3] The amplifier gain is given as 0.103 V/nA, but the diagram in Fig. 3 is stated to show a different gain. Please clarify the actual gain in the figure caption or update the schematic to match the text.
- [Sec. 4, Fig. 5 and Fig. 6] The figure captions indicate '1 mm per minor division' but the scale bars are not explicitly labeled. Adding visible axis ticks with numerical values in mm would improve interpretability.
Circularity Check
The 'predicted' peak in Eq. (5) uses the same measured data's fourth-contour radius as input, so the agreement is a self-consistency check, not an independent prediction.
-
fitted input called prediction
[Section 4 (Analysis), Eq. (5) and preceding paragraph]
"Assume the fluence in the measuring plane is approximated by a cylindrical 2D Gaussian ... whose effective area is πσ_r^2 with σ_r = √2 r60 where r60 is the radius at the 60% point, the fourth contour. The beam is obviously not circular but we compensate for that by using r60 = 3.5 mm, the mean between x and z ignoring the x tail. That yields a beam effective area of 0.77 cm^2. ... Vpeak, predicted = 4.105/0.77 Gy/s × 10.7 nC/Gy × 0.103 V/nA = 5.88 V (5) in satisfactory agreement with Vpeak, measured = 5.67 V."
The 'predicted' peak voltage is calculated from an effective beam area A=0.77 cm^2, which is derived from r60=3.5 mm, read off the fourth contour of the same measured 2D distribution that also gives Vpeak,measured=5.67 V. The prediction is therefore not independent: the same dataset supplies both the shape parameter that fixes the area and the target value it is compared with. If the measured distribution were distorted by beam-current drift or scan-speed error, r60 would change and the 'predicted' peak would change with it, so the agreement cannot independently validate the beam width, absolute dose rate, or 2D shape. It is a consistency check, not an external verification.
full rationale
The measured beam profiles and the repeat-scan agreement are direct experimental data and are not circular. The one circular step is the quantitative cross-check in Eq. (5): the predicted peak uses r60 taken from the fourth contour of the same measured data, so the 'prediction' reduces by construction to a self-consistency check with an input extracted from the target data. The paper's other inputs (diode sensitivity, amplifier gain, stopping power) are independently calibrated or non-load-bearing. The absence of a beam monitor is a separate validation weakness, not a circularity. Because one stated prediction is not independent, but the central demonstration does not rest entirely on it, the appropriate score is 6 (partial circularity).
Assumptions & free parameters
free parameters (2)
- r60 =
3.5 mm
- Gaussian smoothing sigma =
5 raw data intervals (100 ms)
assumptions (4)
- domain assumption The proton beam current is constant during the 20-minute measurement despite the absence of a beam monitor.
- domain assumption The diode's sensitivity remains constant throughout the scans because it was pre-irradiated to 1 kGy.
- domain assumption The z scan speed is a constant 7.28 mm/s after a negligibly short acceleration.
- domain assumption The beam fluence is approximated by a cylindrical 2D Gaussian for the consistency check in Eq. (3)-(5).
Cite this review
Pith. "Pith review of Using a 3D printer for 2D beam profile measurements in proton radiotherapy." pith.science (2026). https://pith.science/paper/FUEUKKEI
@misc{pith2026190803763,
  author       = {Pith},
  title        = {Pith review of: Using a 3D printer for 2D beam profile measurements in proton radiotherapy},
  year         = {2026},
  howpublished = {\url{https://pith.science/paper/FUEUKKEI}},
  note         = {Machine review of arXiv:1908.03763}
}
read the original abstract
We have used an inexpensive 3D printer mounting an inexpensive pre-irradiated silicon diode to measure the 2D dose distribution of a small (approximately 10mm FWHM) proton beam. z was measured with high resolution whereas x was changed on a 2mm grid for a total of 12 scans and 2 repeats in 20 minutes. The peak dose to the diode was approximately 530 cGy/s, and no degradation in diode sensitivity was observed. We present beam profiles and a 2D beam contour derived from these data. Most of the scan time was spent changing x by hand, and a more appropriate 3D printer along with an improved setup and printer control software would reduce that to about 1 minute for an end-to-end absolute 2D dose measurement. We propose extending this to 3D (2D transverse plus depth) for appropriate small beams by adding a small water tank.
Figures


Figures from the paper (3 more)


Reference graph
Works this paper leans on
-
[1]
Ethan W. Cascio and E.H. Bentefour, ‘The use of diodes as dose and fluence probes in the experimental beamline at the Francis H. Burr Proton Therapy Center,’ IEEE 978-1-4577-1283-8/11 (2011)
work page 2011
-
[2]
Illinois at Urbana-Champaign (1981)
Michael Joseph Aramini, ‘Implementation of an improved contour plotting algo- rithm,’ Master’s Thesis, Univ. Illinois at Urbana-Champaign (1981)
work page 1981
-
[3]
Gottschalk, ‘Radiotherapy Proton Interactions in Matter,’ arXiv:1804.00022v1 (2018)
B. Gottschalk, ‘Radiotherapy Proton Interactions in Matter,’ arXiv:1804.00022v1 (2018)
arXiv 2018
-
[4]
J.F. Janni, ‘Proton Range-Energy Tables, 1KeV - 10 GeV,’ Atomic Data and Nuclear Data Tables 27 parts 1 (compounds) and 2 (elements) (Academic Press, 1982)
work page 1982
-
[5]
LOOKUP, a proton desk calculator for IBM compatible PCs available for free download at http://users.physics.harvard.edu/˜gottschalk. 5 Figure 1: Block diagram. Figure 2: 3D printer with diode mounted at bottom of plastic bar to the right. The wires visible on the left carried the z motor step pulses. 6 Figure 3: Fast current-to-voltage amplifier used for t...
Reviewed August 14, 2026 · model on record in the stance chip above.
Discussion (0). Continue with ORCID to comment.