REVIEW 2 major objections 5 minor 73 references
Living with Neighbors. I. Observational Clues to Hydrodynamic Impact of Neighboring Galaxies on Star Formation
T0 review · 2 major / 5 minor · reviewed 2026-08-14 · deepseek-v4-flash
Pith's one-line read A neighbor's star formation controls whether galaxy pairs ignite or quench.
desk verdict A careful SDSS pair study showing that the neighbor's own star-forming state predicts whether interactions enhance or quench SF; the empirical pattern is solid, but the hydrodynamic mechanism attribution is not uniquely identified. read the letter →
The pith
A machine-rendered reading of the paper's core claim, the machinery that carries it, and where it could break.
The reading
What carries the argument
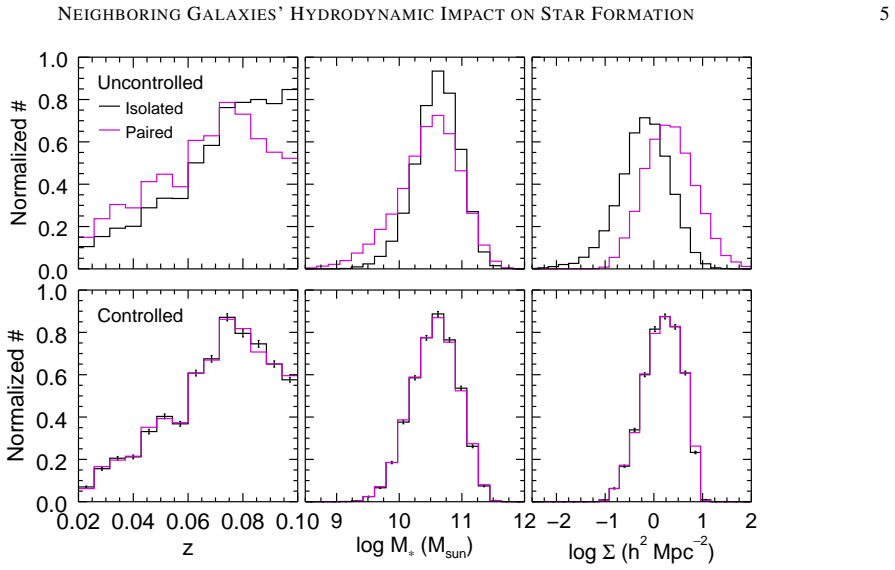
The central machinery is a four-way classification of galaxy pairs by the specific star formation rate (sSFR, star formation rate per unit stellar mass measured within the SDSS fiber) of both members. The boundary $\log(\mathrm{sSFR}) = -11.5\,\mathrm{yr}^{-1}$ sits in the valley of the sample's sSFR distribution and yields four groups: Qq, Qs, Sq, and Ss. Every group is compared with a control sample of isolated galaxies matched in redshift, stellar mass, and local density, and the interaction-induced change is defined as the difference in star-forming fraction or in mean SFR between the pair and control samples. The trends of these differences against projected separation and against the neighbor's sSFR carry the argument.
What would settle it
Observe the cold-gas content (H I and CO) of the target galaxies in close pairs with quiescent versus star-forming neighbors. The paper's mechanism predicts that targets with quiescent companions should have reduced gas reservoirs or reduced gas inflow (stripping and starvation), while targets with star-forming companions should retain gas but show elevated star-formation efficiency (ISM collision); seeing the opposite pattern would undercut the claim that the neighbor's star-forming status drives the response.
Extended reading notes
Core claim
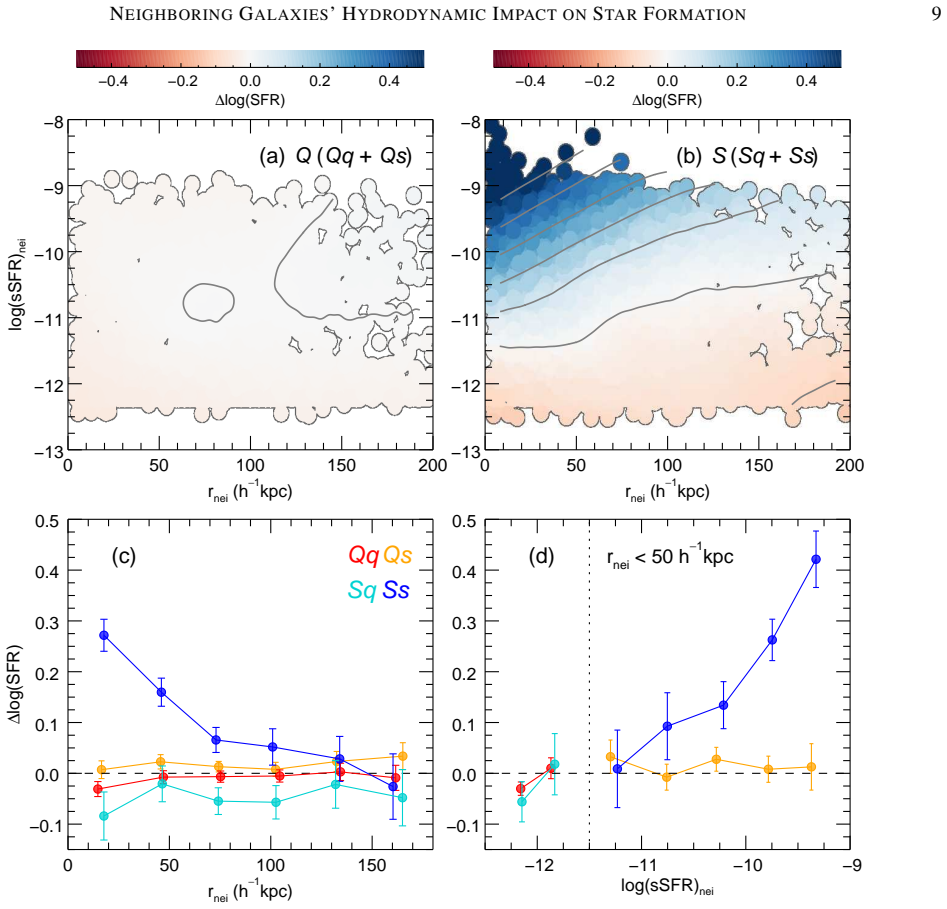
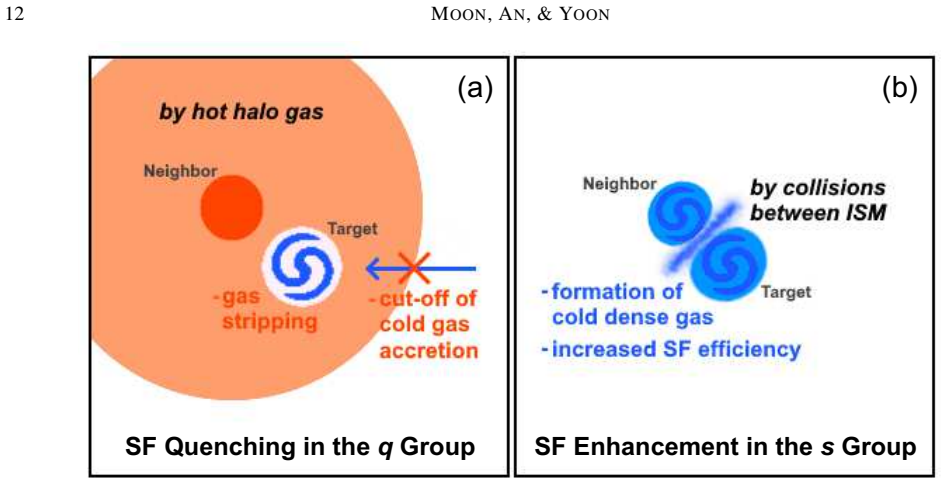
The paper's central claim is that the star-forming status of a galaxy's nearest neighbor determines whether the interaction enhances or quenches star formation in the target. Using 10,142 SDSS pairs with a matched isolated control sample, the authors divide pairs by whether the neighbor (and the target) lies above or below the sSFR boundary $\log(\mathrm{sSFR}) = -11.5\,\mathrm{yr}^{-1}$. They find that star-forming targets with a star-forming neighbor (the Ss group) have a mean SFR up to about three times that of isolated star-forming galaxies at separations below $30\,h^{-1}\,\mathrm{kpc}$, with the boost growing as the neighbor gets closer and more star-forming. In contrast, targets with a quiescent neighbor (the q group) show a reduced star-forming fraction, and fully quenched neighbors suppress the SFR of star-forming targets slightly; this reduction persists out to about $150\,h^{-1}\,\mathrm{kpc}$ and strengthens for closer, more massive, and more quiescent neighbors. The authors interpret the contrast as evidence that hydrodynamic effects, namely collisions of interstellar media in the s group and hot-halo ram-pressure stripping or gas-accretion cutoff in the q group, operate alongside tidal forces during the early phase of interaction.
Load-bearing premise
The paper treats the neighbor's star-forming status, measured at the same epoch as the target's, as an independent cause or marker of the target's response; if the same interaction simultaneously changes the star formation of both galaxies, then the distinction between the q and s groups partly encodes the very effect being measured.
Editorial extensions
If this is right
- In close pairs, star-forming galaxies with a star-forming neighbor reach a mean SFR about three times that of matched isolated galaxies, while no such boost appears when the neighbor is quiescent.
- The quenching effect of a quiescent neighbor extends to separations of roughly $150\,h^{-1}\,\mathrm{kpc}$, near the virial radius of a Milky-Way-sized galaxy, and strengthens for more massive, more quiescent, and closer neighbors.
- The total sSFR distribution of all pairs is broadened on both ends: more quiescent galaxies appear in pairs with quiescent neighbors and more active star formers in pairs with star-forming neighbors.
- Tidal forces alone cannot explain the asymmetry, because quiescent neighbors are on average more massive yet produce quenching rather than enhancement, so hydrodynamics must operate alongside tides during the early phase of interactions.
- The existence of an Sq group with no measurable enhancement implies that tidal encounters cannot revive a fully quenched target galaxy before coalescence.
Reading between the lines
- This suggests that morphology-based splits in earlier work were standing in for gas content; interaction models should track the companion's cold-gas state rather than its Hubble type.
- The same logic may extend to minor interactions and flybys in group environments, where a gas-rich companion could briefly ignite a galaxy and a hot-halo-bearing companion could prematurely quench it, with consequences for the environmental dependence of the star-forming main sequence.
- A testable extension is that q-group quenching should appear with a delay of a few gigayears after first infall, matching starvation timescales, while s-group enhancement should be prompt and centrally concentrated; separating these timescales observationally would sharpen the interpretation.
- Because the paper uses fiber-based SFRs, its quantitative enhancement factors apply to galaxy centers; full-aperture or spatially resolved measurements could reveal whether the total SFR boost is smaller or larger than the central one.
Signed reviews
Editorial analysis
A structured set of objections, weighed in public.
Referee Report
Summary. The manuscript uses SDSS DR7 spectroscopy and MPA-JHU fiber SFRs to compare 14,432 paired galaxies with 33,182 isolated galaxies, asking whether the star-forming status of a galaxy's nearest neighbor determines the sign and strength of the interaction-induced change in star formation. Pairs are selected with projected separation <200 h^-1 kpc, relative velocity <300 km s^-1, mass ratio 0.1-10, and a single dominant neighbor, with additional cleaning using photometric redshifts. The control sample is drawn from isolated galaxies matched in redshift, stellar mass, and local density, with 1000 random resamplings. Splitting the pair sample by the neighbor's sSFR at log(sSFR) = -11.5, the authors report that quiescent neighbors reduce the star-forming fraction, increasingly for closer and more quiescent neighbors, while star-forming neighbors leave the star-forming fraction unchanged but raise the mean SFR, especially in star-forming targets (the Ss group). They interpret the first trend as hot-halo ram-pressure stripping and gas-accretion cutoff, and the second as ISM collisions in gas-rich pairs.
Significance. If the observed q/s contrast is real, this is a significant observational result: it goes beyond the conventional tidal-torque picture and provides large-sample evidence that the neighbor's own gas/star-forming state is correlated with whether interactions enhance or suppress star formation. The paper has clear strengths: a strict and well-documented pair-selection procedure, explicit removal of galaxies with additional photometric neighbors, control samples matched in redshift, stellar mass, and local density with 1000 resamplings, and robustness checks against redshift, relative velocity, local density, stellar mass, and mass ratio. The empirical claim that the sign of the interaction-induced change depends on the neighbor's sSFR is likely robust; the main vulnerability is the causal interpretation, because the neighbor's sSFR is measured at the same epoch as the target's and may be a co-product of the same interaction rather than an independent cause.
major comments (2)
- [Section 2.3 and Section 4.2] The classification of the q and s groups uses the neighbor's fiber sSFR measured at the same epoch as the target's SFR. During a close interaction, both galaxies can be simultaneously enhanced or quenched by mutual tidal or hydrodynamic effects, and paired galaxies also share large-scale gas supply and assembly histories. The q/s split may therefore partly select on the interaction outcome or on pre-existing correlated properties rather than on an independent neighbor attribute. Section 4.2 acknowledges that the Ss excess could be a consequence of mutual interaction, but the counterargument only rules out a purely tidal, single-sided effect; it does not rule out simultaneity or common-cause selection. Section 5.1's statement that the neighbor's SFR is the most important parameter rests on controls for redshift, mass, density, and mass ratio, not on a control for pre-interaction neighbor gas content or shared environment. Because the hot-halo stripping (q) and ISM collision (s) mechanisms in Section 5.2 are inferred from this classification, the causal identification is not fully established. I recommend adding a test that classifies neighbors using a property less contemporaneous with the interaction (for example, morphology or stellar population age), or explicitly constraining the simultaneity scenario before claiming a unique hydrodynamic mechanism.
- [Section 2.1 and Section 4.2] The neighbor's sSFR used for classification is measured within the SDSS 3-arcsecond fiber, which covers only the central few kiloparsecs. Interaction-induced star formation is known to be concentrated in galactic centers, so a high fiber sSFR in the neighbor could itself be a signature of the ongoing interaction rather than a pre-existing property. Since the paper's main conclusion in Section 5.1 asserts that the neighbor's SFR is the most important distinguishing parameter, the analysis needs to address this directly: for example, by checking whether the q/s contrast persists when the neighbor classification uses an aperture-corrected SFR, a gas-phase metallicity or gas fraction indicator, or another proxy that is less affected by the current central starburst. Without such a check, the interpretation of the q/s contrast as evidence for ISM collisions (and its contrast with the Sq case) remains vulnerable to the objection that both the target and the neighbor are responding to the same event.
minor comments (5)
- [Section 5.1] The paragraph beginning 'Figure 8 shows the effect of various parameters on the interaction-induced SF' contains an exact duplicated sentence: 'Figure 8 shows the effect of various parameters on the interaction-induced SF.' This should be removed.
- [Figure 4] The bottom-panel y-axis label 'NPair − N Control' is missing subscripts and should read 'N_pair − N_control' or equivalent; the caption would also benefit from a sentence stating that the bottom panels show the same distributions as the top panels after subtracting the control histogram.
- [Figures 5 and 8] The figures would be easier to read if the error bars in Figure 5 were defined in the caption as standard errors of the mean from the 1000 resamplings; Figure 8 does not state the binning rule, and it would help to note that each bin contains an equal number of galaxies, as in Figure 7.
- [Section 2.3] The choice of log(sSFR) = -11.5 as the demarcation between quiescent and star-forming galaxies is stated to be the valley of the sSFR distribution, but no figure or quantitative support is shown for this valley; a brief justification or reference would strengthen the reproducibility of the classification.
- [Section 5.2] The phrase 'CAPLOESS 2D routine' in the caption of Figure 6 should be 'CAP LOESS 2D routine,' and the text in Section 4.2 would benefit from a proper citation of the Cappellari et al. (2013) software rather than only the paper.
Circularity Check
No significant circularity: the analysis is a direct matched-control comparison, with no fitted prediction or load-bearing self-citation.
full rationale
This paper is a measurement paper rather than a derivation. The central result, that interaction-induced changes in target sSFR depend on the neighbor's contemporaneous sSFR, is obtained by splitting the SDSS pair sample in Section 2.3 into the q and s groups and comparing each group's sSFR distribution against an isolated control sample matched in redshift, stellar mass, and local density (Section 3). No parameter is fitted and then renamed a prediction; the quantities Delta(SF Fraction) and Delta log(SFR) are direct contrasts between the pair and control samples. The only self-citation (Moon & Yoon 2015) appears in a footnote and is used only to explain why morphology was not chosen as the SF indicator; it is not load-bearing for any conclusion. The acknowledged concern that the neighbor's sSFR may be co-induced by the same interaction (Section 4.2) is a causal-identification caveat, not a circular reduction: the empirical correlations would remain even if the causal interpretation were wrong. Thus there is no step in which an equation, fitted parameter, or self-citation forces the predicted result by construction.
Assumptions & free parameters
free parameters (1)
- sSFR demarcation between quiescent and star-forming galaxies =
log(sSFR) = -11.5 yr^-1
assumptions (4)
- domain assumption sSFR measured within the SDSS 3 arcsecond fiber represents the hydrodynamic gas state relevant to interaction-induced star formation
- domain assumption The control sample matching on redshift, stellar mass, and local density removes selection biases
- domain assumption AGN exclusion via the Kauffmann et al. (2003) BPT diagram removes AGN contamination from SFR estimates
- domain assumption A nearest neighbor within 200 h^-1 kpc, with relative radial velocity less than 300 km/s and mass ratio between 0.1 and 10, defines the relevant interacting pair
Cite this review
Pith. "Pith review of Living with Neighbors. I. Observational Clues to Hydrodynamic Impact of Neighboring Galaxies on Star Formation." pith.science (2026). https://pith.science/paper/FVENDKD4
@misc{pith2026190805278,
  author       = {Pith},
  title        = {Pith review of: Living with Neighbors. I. Observational Clues to Hydrodynamic Impact of Neighboring Galaxies on Star Formation},
  year         = {2026},
  howpublished = {\url{https://pith.science/paper/FVENDKD4}},
  note         = {Machine review of arXiv:1908.05278}
}
read the original abstract
Galaxies in pairs show enhanced star formation (SF) compared to their counterparts in isolation, which is often explained by the tidal effect of neighboring galaxies. Recent observations, however, reported that galaxies paired with early-type neighbors do not undergo the SF enhancement. Here we revisit the influence of neighbors using a large sample of paired galaxies from the Sloan Digital Sky Survey and a carefully constructed control sample of isolated counterparts. We find that star-forming neighbors enhance SF, and even more so for more star-forming (and closer) neighbors, which can be attributed to collisions of interstellar medium (ISM) leading to SF. We further find that, contrary to the anticipated tidal effect, quiescent neighbors quench SF, and even more so for more quiescent (and closer) neighbors. This seems to be due to removal of gas reservoirs via ram pressure stripping and gas accretion cutoff by hot gas halos of quiescent neighbors, on top of their paucity of ISM to collide to form stars. Our findings, especially the intimate connection of SF to the status and strength of neighbors' SF, imply that the hydrodynamic mechanisms, along with the tidal effect, play a crucial role during the early phase of galactic interactions.
Figures


Figures from the paper (6 more)




Reference graph
Works this paper leans on
-
[1]
Abazajian, K. N., Adelman-McCarthy, J. K., Ag¨ ueros, M. A.,et al. 2009, ApJS, 182, 543
work page 2009
-
[2]
Adelman-McCarthy, J. K., Ag¨ ueros, M. A., Allam, S. S., et al. 2007, ApJS, 172, 634
work page 2007
-
[3]
Alonso, M. S., Lambas, D. G., Tissera, P ., & Coldwell, G. 2007 , MNRAS, 375, 1017
work page 2007
-
[4]
Alonso, M. S., Tissera, P . B., Coldwell, G., et al. 2004, MNRA S, 352, 1081
work page 2004
-
[5]
K., Balogh, M
Baldry, I. K., Balogh, M. L., Bower, R. G., et al. 2006, MNRAS, 373, 469
2006
- [6]
-
[7]
Barrera-Ballesteros, J. K., S´ anchez, S. F., Garc´ ıa-Lorenzo, B., et al. 2015, A&A, 579, A45
work page 2015
-
[8]
Wechsler, R. H. 2007, ApJ, 671, 1538
work page 2007
Show all 73 references
-
[9]
J., Geller, M
Barton, E. J., Geller, M. J., & Kenyon, S. J. 2000, ApJ, 530, 66 0
2000
-
[10]
S., Zhu, G., Ferguson, H
Behroozi, P . S., Zhu, G., Ferguson, H. C., et al. 2015, MNRAS, 450, 1546
2015
-
[11]
F., McIntosh, D
Bell, E. F., McIntosh, D. H., Katz, N., & Weinberg, M. D. 2003, ApJS, 149, 289
2003
-
[12]
Brinchmann, J., Charlot, S., White, S. D. M., et al. 2004, MNR AS, 351, 1151
2004
-
[13]
K., Domingue, D., et al
Cao, C., Xu, C. K., Domingue, D., et al. 2016, ApJS, 222, 16
2016
-
[14]
M., Alatalo, K., et al
Cappellari, M., McDermid, R. M., Alatalo, K., et al. 2013, MNRAS, 432, 1862
2013
-
[15]
S., & Devlin, S
Cleveland, W. S., & Devlin, S. J. 1988, J. Am. Stat. Assoc., 83 , 596
1988
-
[16]
A., Schaye, J., Wyithe, J
Correa, C. A., Schaye, J., Wyithe, J. S. B., et al. 2018, MNRAS , 473, 538
2018
-
[17]
J., Jonsson, P ., Somerville, R
Cox, T. J., Jonsson, P ., Somerville, R. S., Primack, J. R., & D ekel, A. 2008, MNRAS, 384, 386
2008
-
[18]
J., et al
Csabai, I., Budav´ ari, T., Connolly, A. J., et al. 2003, AJ, 125, 580
2003
-
[19]
2015, ApJ, 805, 121
Aragon-Calvo, M. 2015, ApJ, 805, 121
2015
-
[20]
Davies, L. J. M., Robotham, A. S. G., Driver, S. P ., et al. 2015 , MNRAS, 452, 616 Di Matteo, P ., Bournaud, F., Martig, M., et al. 2008, A&A, 492 , 31 Di Matteo, P ., Combes, F., Melchior, A.-L., & Semelin, B. 2007, A&A, 468, 61
2015
-
[21]
L., Cao, C., Xu, C
Domingue, D. L., Cao, C., Xu, C. K., et al. 2016, ApJ, 829, 78
2016
-
[22]
L., Mendel, J
Ellison, S. L., Mendel, J. T., Patton, D. R., et al. 2013, MNRA S, 435, 3627
2013
-
[23]
L., Patton, D
Ellison, S. L., Patton, D. R., Mendel, J. T., & Scudder, J. M. 2 011, MNRAS, 418, 2043
-
[24]
L., Patton, D
Ellison, S. L., Patton, D. R., Simard, L., et al. 2010, MNRAS, 407, 1514
2010
-
[25]
L., Patton, D
Ellison, S. L., Patton, D. R., Simard, L., & McConnachie, A. W . 2008, AJ, 135, 1877
2008
-
[26]
J., Buddelmeijer, H., Trager, S
Ferdosi, B. J., Buddelmeijer, H., Trager, S. C., Wilkinson, M. H. F., & Roerdink, J. B. T. M. 2011, A&A, 531, A114
2011
-
[27]
M., & Dav´ e, R
Gabor, J. M., & Dav´ e, R. 2015, MNRAS, 447, 374
2015
-
[28]
H., Sparre, M., Ellison, S
Hani, M. H., Sparre, M., Ellison, S. L., Torrey, P ., & V ogelsberger, M. 2018, MNRAS, 475, 1160
2018
-
[29]
S., Elbaz, D., Dickinson, M., et al
Hwang, H. S., Elbaz, D., Dickinson, M., et al. 2011, A&A, 535, A60
2011
-
[30]
S., Elbaz, D., Lee, J
Hwang, H. S., Elbaz, D., Lee, J. C., et al. 2010, A&A, 522, A33
2010
-
[31]
S., Park, C., Elbaz, D., & Choi, Y .-Y
Hwang, H. S., Park, C., Elbaz, D., & Choi, Y .-Y . 2012, A&A, 538, A15
2012
-
[32]
2015, ApJ, 805, 131
Hwang, J.-S., & Park, C. 2015, ApJ, 805, 131
2015
-
[33]
M., Tremonti, C., et al
Kauffmann, G., Heckman, T. M., Tremonti, C., et al. 2003, MNRAS, 346, 1055 NEIGHBORING GALAXIES ’ H YDRODYNAMIC IMPACT ON STAR FORMATION 15
2003
-
[34]
Kauffmann, G., White, S. D. M., Heckman, T. M., et al. 2004, MNRAS, 353, 713
2004
-
[35]
2014, MNRAS, 440, 2944
Kaviraj, S. 2014, MNRAS, 440, 2944
2014
-
[36]
2015, MNRAS, 4 52, 2845
Kaviraj, S., Devriendt, J., Dubois, Y ., et al. 2015, MNRAS, 4 52, 2845
2015
-
[37]
G., Alonso, S., Mesa, V ., et al
Lambas, D. G., Alonso, S., Mesa, V ., et al. 2012, A&A, 539, A45
2012
-
[38]
G., Tissera, P
Lambas, D. G., Tissera, P . B., Alonso, M. S., et al. 2003, MNRA S, 346, 1189
2003
-
[39]
M., et al
Li, C., Kauffmann, G., Heckman, T. M., et al. 2008, MNRAS, 385 , 1903
2008
-
[40]
R., Koo, D
Lin, L., Patton, D. R., Koo, D. C., et al. 2008, ApJ, 681, 232 L´ opez-Sanjuan, C., Cenarro, A. J., V arela, J., et al. 2015,A&A, 576, A53
2008
-
[41]
M., Jonsson, P ., Cox, T
Lotz, J. M., Jonsson, P ., Cox, T. J., et al. 2011, ApJ, 742, 103
2011
-
[42]
Man, A. W. S., Zirm, A. W., & Toft, S. 2016, ApJ, 830, 89
2016
-
[43]
Martin, G., Kaviraj, S., Devriendt, J. E. G., Dubois, Y ., & Pi chon, C. 2018, MNRAS, 480, 2266
2018
-
[44]
T., Simard, L., Palmer, M., Ellison, S
Mendel, J. T., Simard, L., Palmer, M., Ellison, S. L., & Patto n, D. R. 2014, ApJS, 210, 3
2014
-
[45]
2018, A&A, 619, A2 4
Mesa, V ., Duplancic, F., Alonso, S., et al. 2018, A&A, 619, A2 4
2018
-
[46]
2015, Publication of Korean Astronomical Society, 30, 469
Moon, J.-S., & Y oon, S.-J. 2015, Publication of Korean Astronomical Society, 30, 469
2015
-
[47]
L., et al
Moreno, J., Torrey, P ., Ellison, S. L., et al. 2015, MNRAS, 448, 1107
2015
-
[48]
L., et al
Moreno, J., Torrey, P ., Ellison, S. L., et al. 2019, MNRAS, 485, 1320
2019
-
[49]
P ., Macci` o, A
Moster, B. P ., Macci` o, A. V ., Somerville, R. S., Naab, T., & Cox, T. J. 2011, MNRAS, 415, 3750
2011
-
[50]
P ., Macci` o, A
Moster, B. P ., Macci` o, A. V ., Somerville, R. S., Naab, T., & Cox, T. J. 2012, MNRAS, 423, 2045
2012
-
[51]
2004, MNRAS, 355, 87 4
Nikolic, B., Cullen, H., & Alexander, P . 2004, MNRAS, 355, 87 4
2004
-
[52]
2018, ApJ, 868, 132
Pan, H.-A., Lin, L., Hsieh, B.-C., et al. 2018, ApJ, 868, 132
2018
-
[53]
2009, ApJ, 691, 1828
Park, C., & Choi, Y .-Y . 2009, ApJ, 691, 1828
2009
-
[54]
R., & Atfield, J
Patton, D. R., & Atfield, J. E. 2008, ApJ, 685, 235
2008
-
[55]
Mendel, J. T. 2011, MNRAS, 412, 591
2011
-
[56]
R., Qamar, F
Patton, D. R., Qamar, F. D., Ellison, S. L., et al. 2016, MNRAS , 461, 2589
2016
-
[57]
R., Torrey, P ., Ellison, S
Patton, D. R., Torrey, P ., Ellison, S. L., Mendel, J. T., & Scudder, J. M. 2013, MNRAS, 433, L59
2013
-
[58]
S., & Lambas, D
Perez, J., Tissera, P ., Padilla, N., Alonso, M. S., & Lambas, D. G. 2009b, MNRAS, 399, 1157 Rafieferantsoa, M., Dav´ e, R., & Naab, T. 2019, MNRAS, 486, 5184
2019
-
[59]
2015, MNRAS, 446, 2038
Renaud, F., Bournaud, F., & Duc, P .-A. 2015, MNRAS, 446, 2038
2015
-
[60]
2014, MNRAS, 437, 2137
Scott, C., & Kaviraj, S. 2014, MNRAS, 437, 2137
2014
-
[61]
Silverman, B. W. 1986, Density Estimation for Statistics an d Data Analysis (London: Chapman and Hall)
1986
-
[62]
McConnachie, A. W. 2011, ApJS, 196, 11
2011
-
[63]
2016, MNRAS, 462, 2418
Sparre, M., & Springel, V . 2016, MNRAS, 462, 2418
2016
-
[64]
Springel, V ., White, S. D. M., Jenkins, A., et al. 2005, Natur e, 435, 629
2005
-
[65]
A., Weinberg, D
Strauss, M. A., Weinberg, D. H., Lupton, R. H., et al. 2002, AJ , 124, 1810 V entou, E., Contini, T., Bouch´ e, N., et al. 2017, A&A, 608, A9
2002
-
[66]
R., Tinker, J
Wetzel, A. R., Tinker, J. L., Conroy, C., et al. 2013, MNRAS, 4 32, 336
2013
-
[67]
C., Blanton, M
Wong, K. C., Blanton, M. R., Burles, S. M., et al. 2011, ApJ, 72 8, 119
2011
-
[68]
F., Geller, M
Woods, D. F., Geller, M. J., & Barton, E. J. 2006, AJ, 132, 197
2006
-
[69]
F., & Geller, M
Woods, D. F., & Geller, M. J. 2007, AJ, 134, 527
2007
-
[70]
F., Geller, M
Woods, D. F., Geller, M. J., Kurtz, M. J., et al. 2010, AJ, 139, 1857
2010
-
[71]
K., Domingue, D., Cheng, Y .-W., et al
Xu, C. K., Domingue, D., Cheng, Y .-W., et al. 2010, ApJ, 713, 3 30
2010
-
[72]
K., Zhao, Y ., Scoville, N., et al
Xu, C. K., Zhao, Y ., Scoville, N., et al. 2012, ApJ, 747, 85 Y ork, D. G., Adelman, J., Anderson, J. E., Jr., et al. 2000, AJ , 120, 1579
2012
-
[73]
K., Y un, M
Zuo, P ., Xu, C. K., Y un, M. S., et al. 2018, ApJS, 237, 2
2018
Reviewed August 14, 2026 · model on record in the stance chip above.
Discussion (0). Continue with ORCID to comment.