REVIEW 4 major objections 6 minor 56 references
Solid and Gaseous Methane in IRAS 23385+6053 as seen with Open JWST Data
T0 review · 4 major / 6 minor · reviewed 2026-08-11 · deepseek-v4-flash
Pith's one-line read The 7.7 µm band toward IRAS 23385+6053 is a superposition of solid methane absorption and warm gaseous methane emission, fit simultaneously with open JWST MIRI/MRS data.
desk verdict A careful and honest lab-plus-JWST analysis worth refereeing, but the gas-phase CH4 column rests on an unquantified 2.3σ detection and a threshold-defined emitting area. read the letter →
The pith
A machine-rendered reading of the paper's core claim, the machinery that carries it, and where it could break.
The reading
What carries the argument
The band decomposition rests on a two-step fitting procedure. First, an LTE slab emission model built from the TheoReTS methane line list and partition function is fit to the flux spectrum after masking the ice continuum; the emitting area is fixed from the flux map using a S/N = 3 aperture, and temperature and column density come from χ² minimization with confidence regions from Δχ² maps. Then the solid-state part is fit in optical depth space with a linear combination of laboratory spectra of CH4-bearing ices made on the ISEAge setup — CH4:CO2 = 1:5 and CH4:H2O = 1:10 deposited at 6.7 K and warmed at 0.5 K per minute — together with OCN⁻, CH3CH2OH:H2O, and SO2:CH3OH reference spectra. The laboratory CH4:CO2 mixture uniquely reproduces the doublet width and both wings, and that match carries the CO2-rich conclusion.
What would settle it
Take a JWST MIRI/MRS spectrum of the 3.3 µm ν3 methane band toward the same 1.2 arcsec aperture: the gas-phase interpretation predicts an emission feature at the same temperature and column density, while a solid-state origin for the 1306 $cm^{-1}$ feature would show a different or absent 3.3 µm feature.
Extended reading notes
Core claim
The central claim is that the resolved doublet structure of the 7.58–7.8 µm methane ν4 deformation band in IRAS 23385+6053 is not a single ice feature. The sharp component at 1306 $cm^{-1}$ coincides with a ν4 gaseous methane transition and is modeled with an LTE slab emission model, while the broad wings are solid methane in a CO2-dominated matrix with a smaller water-rich component. The best-fit gas parameters are R = 2940 au, T = 103(+13/-11) K, and N = 0.78(+6.18/-0.64) × $10^{17}$ $cm^{-2}$; the solid methane column densities are 2.97 × $10^{17}$ $cm^{-2}$ in CH4:CO2 = 1:5 at 27.4 K and 1.02 × $10^{17}$ $cm^{-2}$ in CH4:H2O = 1:10 at 8.4 K, for a total solid column of 3.99 × $10^{17}$ $cm^{-2}$. The authors conclude that methane ice is mostly surrounded by CO2 rather than H2O, contrasting with the water-methane mixtures commonly used in previous literature.
Load-bearing premise
The whole gas-ice decomposition hangs on the sharp feature near 1306 $cm^{-1}$ being real gaseous methane emission; if it is instead a solid-state band, a noise fluctuation, or a residual continuum artifact, the gas parameters and the phase split collapse.
Editorial extensions
If this is right
- With the gas-phase contribution removed, the residual 7.7 µm band is a single broad ice absorption that can be described by CH4:CO2 = 1:5 at 27.4 K plus CH4:H2O = 1:10 at 8.4 K, so solid methane toward this source is predominantly in a CO2-rich rather than water-rich environment.
- The total solid CH4 column density of 3.99 × 10^17 cm^-2 gives Nice(CH4)/Nice(H2O) ≈ 2.44%, consistent with the earlier estimate of 2.72%, meaning the new decomposition preserves the overall methane abundance while changing its phase split.
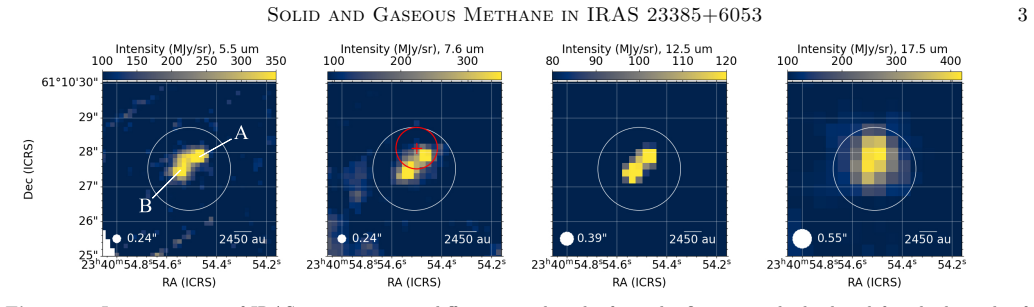
- Gaseous methane is spatially offset from the continuum peak and is present only near the most massive source, implying the emitting gas sits at the edge of the accretion disk or in the envelope rather than in the cold core.
- If this doublet structure appears in other JWST spectra, the same two-step procedure offers a way to separate gas and ice methane columns without assuming the whole ν4 feature is solid-state.
- The unassigned 1283–1297 cm^-1 residual is tentatively attributed to N2O in various ice matrices, making IRAS 23385+6053 a new candidate for interstellar nitrous oxide.
Reading between the lines
- If the decomposition holds, the same doublet morphology in other protostellar MIRI/MRS spectra could serve as a general diagnostic for separating warm methane gas from methane ice, and the CO2-dominated environment would point to methane formation or processing in CO2-rich mantles rather than water-rich ones.
- The laboratory result that a N2O:CO2 = 1:20 mixture shifts the N2O feature by 14.4 cm^-1 provides a diagnostic for identifying N2O in CO2-rich ices; future JWST observations of the stronger 4.5 µm N2O band would turn the tentative 7.7 µm detection into a secure one.
- Because the gas-phase column density has very asymmetric error bars (0.78 +6.18/-0.64 × 10^17 cm^-2), the gas-to-ice methane ratio is not yet tightly constrained; a higher-S/N observation of the same source would make that ratio a useful probe of methane desorption and warm carbon-chain chemistry.
Editorial analysis
A structured set of objections, weighed in public.
Referee Report
Summary. The paper analyzes the 7.7 μm region of the JWST MIRI/MRS spectrum of the high-mass star-forming region IRAS 23385+6053. The authors interpret the 7.58–7.8 μm band as a superposition of broad solid methane absorption and sharp gaseous methane emission. Using an LTE slab model with an external line list (TheoReTS) they derive gas parameters R = 2940 au, T = 103(+13/-11) K, N = 0.78(+6.18/-0.64) × 10^17 cm^-2, and using new laboratory ice spectra (ISEAge) plus literature data they derive solid methane column densities for CH4:CO2 = 1:5 at 27.4 K and CH4:H2O = 1:10 at 8.4 K, with a total ice column of 3.99 × 10^17 cm^-2. The paper also tentatively assigns a residual to N2O in various ice environments.
Significance. If the gas-phase detection and the gas–ice decomposition are secure, this would be the first simultaneous quantification of gaseous and solid methane toward IRAS 23385+6053, with implications for methane partitioning and for methane ice environments (favoring CO2-rich rather than water-rich mantles). The paper has clear strengths: it uses publicly available JWST data, combines an external spectroscopic line list with new laboratory measurements, and makes an explicit effort to treat residuals statistically with Anderson–Darling tests. However, the central gas detection is statistically fragile, and the current presentation does not provide an integrated detection significance or a robustness analysis of the continuum subtraction, so the central claim is not yet fully supported.
major comments (4)
- [Section 5] The gaseous methane detection rests on single-pixel S/N values ≤ 2.3, and the emitting area is defined by adopting an S/N threshold of 3, but no integrated detection significance is reported for the 1306 cm^-1 feature or for the full multi-line fit. Because the subsequent gas–ice decomposition depends on the reality of this emission, please compute and report the S/N after aperture integration over the chosen region, and the detection significance from the full spectral fit. If the integrated feature is not significant at the adopted threshold, the gas detection and the derived R, T, and N values are not secure.
- [Equation (1) and Section 6] Equation (1) constrains only the product S·N, and the paper separates S from N by thresholding the single-pixel S/N map. The uncertainty in S is not propagated into the reported N = 0.78(+6.18/-0.64) × 10^17 cm^-2, whose upper error bar is almost an order of magnitude larger than the central value. Please quantify the uncertainty on S, propagate it properly into N and T, and show confidence contours for the parameters (e.g., Δχ² maps in the S–N plane).
- [Section 5, continuum subtraction] The ice continuum is estimated by LOESS smoothing with a 20-point window after masking 'prominent gaseous features and heavy outliers of unknown origin'. This procedure can in principle introduce or suppress narrow residuals at the gas line positions. Please test the robustness of the 1306 cm^-1 feature and the derived gas parameters against the choice of smoothing window and mask selection, or alternatively fit the gas, ice, and continuum simultaneously. Without such a test, the sharp 1306 cm^-1 feature may be a continuum artifact rather than methane emission.
- [Section 6 and Table 1] The conclusion that solid methane is predominantly in a CO2-rich environment (CH4:CO2 = 1:5) rather than a water-rich environment rests on a restricted library of laboratory mixtures: only CH4:CO2 = 1:5 and CH4:H2O = 1:10, deposited at 6.7 K and warmed at 0.5 K/min, plus literature spectra. Please justify the choice of these specific ratios and temperatures, or test additional compositions (e.g., CH4:CO2 at other ratios, CH4:NH3, or different warm-up rates) to show that the CO2 dominance is not an artifact of the limited library.
minor comments (6)
- [Table 1] The band strengths for CH4:CO2 and CH4:H2O are listed as 'This work', but the derivation of these band strengths is not described in the main text; please add a brief description or a reference to the follow-up paper.
- [Figure 1 caption] The red circle and red cross in Figure 1 are not defined in the caption; please explain that they indicate the methane-emitting area and the gas emission peak, respectively.
- [Abstract and Introduction] The phrase 'for the first time gaseous and solid methane were analyzed simultaneously' should be qualified relative to Rocha et al. (2024), who already modeled the ice component toward this source; please clarify that the new contribution is the simultaneous treatment and the gas-phase detection.
- [Section 5] The text uses the symbol S both for the emitting area in Equation (1) and for signal-to-noise ratio in the S/N discussion; please use a distinct symbol (e.g., A) for the area to avoid ambiguity.
- [Section 5] The phrase 'Plank’s law' should be corrected to 'Planck’s law'.
- [Appendix A] The Anderson–Darling filtering uses α = 12% and 10% for the best fit and confidence regions, respectively; please state whether these thresholds are fixed a priori or chosen to obtain the reported fit, and how the results change with modest variations of α.
Circularity Check
No significant circularity: the gas-phase model uses the external TheoReTS line list and the ice decomposition uses external ISEAge laboratory spectra, so the central claims are not defined into existence by the fitting procedure.
full rationale
The derivation chain is self-contained against external inputs. The gaseous methane parameters are obtained from an LTE slab model (Eq. 1) using the TheoReTS methane line list (Rey et al. 2013) and a chi-square fit (Eq. 2) to the observed spectrum, with the emitting area S estimated independently from flux intensity maps rather than from the spectral fit. The solid methane decomposition uses ISEAge laboratory spectra of CH4:CO2 and CH4:H2O mixtures with known column densities, and the derived ice column densities come from scaling these laboratory templates and measured band strengths to the observation. The iterative gas/ice separation, in which the ice continuum is estimated after masking gas features and the gas fit is subtracted before the ice fit, is a standard two-step spectral decomposition rather than a logical loop, because each component is anchored to independent data: an external line list for the gas and external laboratory ice spectra for the solid. Self-citations (Ozhiganov et al. 2024 for the ISEAge setup, and Karteyeva in prep. for future data release) are not load-bearing for the central result. The low single-pixel S/N of 2.3 for the 1306 cm^-1 feature and the S/N=3 aperture threshold are legitimate detection-significance concerns, but they are statistical weaknesses, not circular reductions; no equation in the paper makes a prediction equivalent to its input by construction.
Assumptions & free parameters
free parameters (7)
- Gaseous methane emitting area radius R =
2940 au (S = 2.7e7 au^2)
- Gaseous methane temperature T =
103(+13/-11) K
- Gaseous methane column density N =
0.78(+6.18/-0.64) x 10^17 cm^-2
- Ice scale coefficients for CH4:CO2 and CH4:H2O =
not individually quoted
- Ice temperatures for each mixture =
T_CO2 = 27.4 K, T_H2O = 8.4 K
- Scale coefficients for OCN-, CH3CH2OH, and SO2 components =
not quoted
- Anderson-Darling p-value thresholds =
alpha = 12% for best fit, 10% for confidence regions
assumptions (6)
- domain assumption The 7.7 micron doublet is a sum of solid methane absorption and gaseous methane emission.
- domain assumption Gaseous methane emission is described by an LTE slab model in the optically thin limit (Eq. 1), with linearization adding only 5% error.
- domain assumption The TheoReTS 80 K methane line list and partition function are accurate at the fitted temperature of 103 K.
- standard math Residuals after subtraction follow a normal distribution, and the Anderson-Darling test is an appropriate filter.
- domain assumption The laboratory spectra of CH4:CO2 and CH4:H2O mixtures, plus the Leiden Ice Database spectra for OCN-, ethanol, and SO2, are representative of the interstellar ice components along this line of sight.
- domain assumption Grain shape effects on the methane band are negligible because the band is more sensitive to molecular environment than to grain morphology.
Cite this review
Pith. "Pith review of Solid and Gaseous Methane in IRAS 23385+6053 as seen with Open JWST Data." pith.science (2026). https://pith.science/paper/FXPA7EKB
@misc{pith2026241217028,
  author       = {Pith},
  title        = {Pith review of: Solid and Gaseous Methane in IRAS 23385+6053 as seen with Open JWST Data},
  year         = {2026},
  howpublished = {\url{https://pith.science/paper/FXPA7EKB}},
  note         = {Machine review of arXiv:2412.17028}
}
abstract
We present a new description of the 7.7~$\mu$m region towards the high-mass star-forming region IRAS 23385+6053 taken from open James Webb Space Telescope Mid-Infrared Instrument Medium Resolution Spectrometer (JWST MIRI/MRS) data. This area is commonly attributed to the $\nu_4$ deformation mode of methane ice. For the first time gaseous and solid methane were analyzed simultaneously in IRAS 23385+6053. The band at 7.58--7.8 $\mu$m (1320--1280 cm$^{-1}$) is interpreted as a wide solid absorption methane feature overlapped by the sharp features of the methane emission. We report the detection of gaseous methane and estimate its emitting area radius~$R$, temperature~$T$ and column density~$N$ as $R=2940$~au, $T=103^{+13}_{-11}$~K, and $N=0.78_{+6.18}^{-0.64}\times10^{17}$~cm$^{-2}$, correspondingly. The ice content was analyzed with the laboratory spectra dataset of methane in different molecular environments obtained on the Ice Spectroscopy Experimental Aggregate (ISEAge). We were able to describe the wide feature of solid methane with the following laboratory spectra: CH$_4$~:~CO$_2$~=~1~:~5 (at $27.4^{+6.0}_{-10.8}$~K) and CH$_4$~:~H$_2$O~=~1~:~10 (at $8.4^{+16.4}_{-1.7}$~K) deposited at 6.7~K and warmed up at a rate of 0.5 K per minute. The derived column densities are $N_{\text{CH}_4}$(CO$_2$)~=~$2.97^{+0.37}_{-0.57}\times10^{17}$~cm$^{-2}$ and $N_{\text{CH}_4}$(H$_2$O)~=~$1.02^{+0.46}_{-0.27}\times10^{17}$~cm$^{-2}$. According to the best fit solid methane is mostly surrounded by CO$_2$ rather than H$_2$O. The residuals analysis reveals the unassigned region at 1283--1297~cm$^{-1}$ (7.71--7.79~$\mu$m) which is tentatively assigned to nitrous oxide (N$_2$O) in various environments.
Figures


Figures from the paper (3 more)


Reference graph
Works this paper leans on
-
[1]
, " * write output.state after.block = add.period write newline
ENTRY address archivePrefix author booktitle chapter doi edition editor eprint howpublished institution journal key month number organization pages publisher school series title misctitle type volume year version url label extra.label sort.label short.list INTEGERS output.state before.all mid.sentence after.sentence after.block FUNCTION init.state.consts ...
-
[2]
write newline
" write newline "" before.all 'output.state := FUNCTION format.url url empty "" new.block "" url * "" * if FUNCTION format.eprint eprint empty "" archivePrefix empty "" archivePrefix "arXiv" = new.block " " eprint * " " * new.block " " eprint * " " * if if if FUNCTION format.doi doi empty "" " " doi * " " * if FUNCTION format.pid doi empty eprint empty ur...
-
[3]
".R늈Զ b YvY@ [x m ci1ƴ1 3H c1x 5=Yw 3o y `8 y 5;÷ BC 90TO (, lsoן 韅
thebibliography [1] 20pt to REFERENCES 6pt =0pt -12pt 10pt plus 3pt =0pt =0pt =1pt plus 1pt =0pt =0pt -12pt =13pt plus 1pt =20pt =13pt plus 1pt \@M =10000 =-1.0em =0pt =0pt 0pt =0pt =1.0em @enumiv\@empty 10000 10000 `\.\@m \@noitemerr \@latex@warning Empty `thebibliography' environment \@ifnextchar \@reference \@latexerr Missing key on reference command E...
-
[4]
Anderson, T. W., & Darling, D. A. 1952, The Annals of Mathematical Statistics, 23, 193 , 10.1214/aoms/1177729437
arXiv 1952
-
[5]
Anscombe, F. J. 1973, The American Statistician, 27, 17, 10.1080/00031305.1973.10478966
work page Pith review arXiv 1973
- [6]
-
[7]
Barman, T. S., Konopacky, Q. M., Macintosh, B., & Marois, C. 2015, ApJ, 804, 61, 10.1088/0004-637X/804/1/61
-
[8]
J., Welbanks , L., Schlawin , E., et al
Bell , T. J., Welbanks , L., Schlawin , E., et al. 2023, , 623, 709, 10.1038/s41586-023-06687-0
Show all 56 references
-
[9]
C., Ahmadi , A., et al
Beuther , H., Mottram , J. C., Ahmadi , A., et al. 2018, , 617, A100, 10.1051/0004-6361/201833021
2018 doi
-
[10]
F., Tychoniec , L., et al
Beuther , H., van Dishoeck , E. F., Tychoniec , L., et al. 2023, , 673, A121, 10.1051/0004-6361/202346167
2023 doi
-
[11]
Boogert, A. C. A., Gerakines, P. A., & Whittet, D. C. 2015, ARA&A, 53, 541, 10.1146/annurev-astro-082214-122348
2015 doi
-
[12]
Boogert , A. C. A., Helmich , F. P., van Dishoeck , E. F., et al. 1998, A&A, 336, 352. https://ui.adsabs.harvard.edu/abs/1998A&A...336..352B
1998
-
[13]
Boogert , A. C. A., Schutte , W. A., Helmich , F. P., Tielens , A. G. G. M., & Wooden , D. H. 1997 a , , 317, 929. https://ui.adsabs.harvard.edu/abs/1997A&A...317..929B
1997
-
[14]
Boogert , A. C. A., Schutte , W. A., Helmich , F. P., et al. 1997 b , A&A, 317, 929. https://ui.adsabs.harvard.edu/abs/1997A&A...317..929B
1997
-
[15]
2015, MNRAS, 451, 2145, 10.1093/mnras/stv1021
Bouilloud, M., Fray, N., B \'e nilan, Y., et al. 2015, MNRAS, 451, 2145, 10.1093/mnras/stv1021
2015 doi
-
[16]
2019, , 627, A68, 10.1051/0004-6361/201935506
Cesaroni , R., Beuther , H., Ahmadi , A., et al. 2019, , 627, A68, 10.1051/0004-6361/201935506
2019 doi
-
[17]
Childs, W. H. J., & Bragg, W. H. 1936, Proceedings of the Royal Society of London. Series A - Mathematical and Physical Sciences, 153, 555, 10.1098/rspa.1936.0022
1936
-
[18]
Cleveland, W. S. 1979, Journal of the American Statistical Association, 74, 829, 10.1080/01621459.1979.10481038
1979
-
[19]
A., Caselli , P., et al
Dartois , E., Noble , J. A., Caselli , P., et al. 2024, NatAs, 8, 359, 10.1038/s41550-023-02155-x
2024 doi
-
[20]
2021, Astrophysics Source Code Library, ascl:2104.010
Dominik , C., Min , M., & Tazaki , R. 2021, Astrophysics Source Code Library, ascl:2104.010. 2104.010
2021
-
[21]
P., & Davis , D
Drapatz , S., Larson , H. P., & Davis , D. S. 1987, , 187, 497. https://ui.adsabs.harvard.edu/abs/1987A&A...187..497D
1987
-
[22]
M., Toriello, F., He, J., & Vidali, G
Emtiaz, S. M., Toriello, F., He, J., & Vidali, G. 2020, The Journal of Physical Chemistry A, 124, 552, 10.1021/acs.jpca.9b10643
2020 doi
-
[23]
2004, A&A, 414, 299, 10.1051/0004-6361:20031623
Fontani, F., Cesaroni, R., Testi, L., et al. 2004, A&A, 414, 299, 10.1051/0004-6361:20031623
2004 doi
-
[24]
L., van Dishoeck , E
Francis , L., van Gelder , M. L., van Dishoeck , E. F., et al. 2024, , 683, A249, 10.1051/0004-6361/202348105
2024 doi
-
[25]
A., & Hudson, R
Gerakines, P. A., & Hudson, R. L. 2015, ApJL, 805, L20, 10.1088/2041-8205/805/2/L20
2015 doi
-
[26]
F., et al
Gieser , C., Beuther , H., van Dishoeck , E. F., et al. 2023, , 679, A108, 10.1051/0004-6361/202347060
2023 doi
-
[27]
2008, , 685, 272, 10.1086/590468
Harada , N., & Herbst , E. 2008, , 685, 272, 10.1086/590468
2008 doi
-
[28]
E., Herbst , E., & Garrod , R
Hassel , G. E., Herbst , E., & Garrod , R. T. 2008, , 681, 1385, 10.1086/588185
2008 doi
-
[29]
D., Carrasco , N., et al
Kobayashi , K., Geppert , W. D., Carrasco , N., et al. 2017, AsBio, 17, 786, 10.1089/ast.2016.1492
2017
-
[30]
Krissansen-Totton , J., Garland , R., Irwin , P., & Catling , D. C. 2018, , 156, 114, 10.3847/1538-3881/aad564
2018 doi
-
[31]
, Argyriou, I
Labiano, A. , Argyriou, I. , Álvarez-Márquez, J. , et al. 2021, A&A, 656, A57, 10.1051/0004-6361/202140614
2021 doi
-
[32]
J., et al
Lacy, J., Carr, J., Evans, N. J., et al. 1991, Astrophysical Journal, Part 1 (ISSN 0004-637X), vol. 376, Aug. 1, 1991, p. 556-560. Research supported by Texas Advanced Research Program., 376, 556, 10.1086/170304
1991 doi
-
[33]
2024, The Spatial Distribution of CH_4 and CO_2 Ice around Protostars IRAS 16253-2429 and IRAS 23385+6053
Lei, L., Feng, L., & Fan, Y.-Z. 2024, The Spatial Distribution of CH_4 and CO_2 Ice around Protostars IRAS 16253-2429 and IRAS 23385+6053. 2409.04217
2024 arXiv
-
[34]
2023, NatAs, 7, 431, 10.1038/s41550-022-01875-w
McClure, M., Rocha, W., Pontoppidan, K., et al. 2023, NatAs, 7, 431, 10.1038/s41550-022-01875-w
2023 doi
-
[35]
L., & Lora, J
Mitchell, J. L., & Lora, J. M. 2016, AREPS, 44, 353, 10.1146/annurev-earth-060115-012428
2016 doi
-
[36]
2008, , 487, 1119, 10.1051/0004-6361:200809821
Molinari , S., Faustini , F., Testi , L., et al. 2008, , 487, 1119, 10.1051/0004-6361:200809821
2008 doi
-
[37]
1998, , 505, L39, 10.1086/311591
Molinari , S., Testi , L., Brand , J., Cesaroni , R., & Palla , F. 1998, , 505, L39, 10.1086/311591
1998 doi
-
[38]
F., & Zhang , Q
Molinari , S., Testi , L., Rodr \' guez , L. F., & Zhang , Q. 2002, , 570, 758, 10.1086/339630
2002 doi
-
[39]
J., DiSanti, M
Mumma, M. J., DiSanti, M. A., Russo, N. D., et al. 1996, Science, 272, 1310, 10.1126/science.272.5266.1310
1996
-
[40]
, Rocha, W
Nazari, P. , Rocha, W. R. M. , Rubinstein, A. E. , et al. 2024, A&A, 686, A71, 10.1051/0004-6361/202348695
2024 doi
-
[41]
H., Schutte , W
Novozamsky , J. H., Schutte , W. A., & Keane , J. V. 2001, , 379, 588, 10.1051/0004-6361:20011332
2001 doi
-
[42]
2024, ApJL, 972, L10, 10.3847/2041-8213/ad6d5c
Ozhiganov, M., Medvedev, M., Karteyeva, V., et al. 2024, ApJL, 972, L10, 10.3847/2041-8213/ad6d5c
2024 doi
-
[43]
M., Wah, Y
Razali, N. M., Wah, Y. B., et al. 2011, J. Stat. Model. Analytics, 2, 21
2011
-
[44]
1984, Icarus, 60, 236, 10.1016/0019-1035(84)90187-8
Reid Thompson , W., & Sagan, C. 1984, Icarus, 60, 236, 10.1016/0019-1035(84)90187-8
1984 doi
-
[45]
V., & Tyuterev, V
Rey, M., Nikitin, A. V., & Tyuterev, V. G. 2013, Phys. Chem. Chem. Phys., 15, 10049, 10.1039/C3CP50275A
2013 doi
-
[46]
Rocha, W. R. M., McClure, M. K., Sturm, J. A., et al. 2024, Ice inventory towards the protostar Ced 110 IRS4 observed with the James Webb Space Telescope. Results from the ERS Ice Age program. 2411.19651
2024 arXiv
-
[47]
Rocha, W. R. M. , van Dishoeck, E. F. , Ressler, M. E. , et al. 2024, A&A, 683, A124, 10.1051/0004-6361/202348427
2024 doi
-
[48]
2008, ApJ, 672, 371, 10.1086/523635
Sakai, N., Sakai, T., Hirota, T., & Yamamoto, S. 2008, ApJ, 672, 371, 10.1086/523635
2008 doi
-
[49]
Slavicinska , K., Rachid, M. G. , Rocha, W. R. M. , et al. 2023, A&A, 677, A13, 10.1051/0004-6361/202346996
2023 doi
-
[50]
2011, Icarus, 215, 292, https://doi.org/10.1016/j.icarus.2011.06.024
Sromovsky, L., Fry, P., & Kim, J. 2011, Icarus, 215, 292, https://doi.org/10.1016/j.icarus.2011.06.024
2011 doi
-
[51]
Stephens, M. A. 1974, Journal of the American Statistical Association, 69, 730. http://www.jstor.org/stable/2286009
1974
-
[52]
R., Vasisht , G., & Tinetti , G
Swain , M. R., Vasisht , G., & Tinetti , G. 2008, , 452, 329, 10.1038/nature06823
2008 doi
-
[53]
, Ligterink, N
Terwisscha van Scheltinga, J. , Ligterink, N. F. W. , Boogert, A. C. A. , van Dishoeck, E. F. , & Linnartz, H. 2018, A&A, 611, A35, 10.1051/0004-6361/201731998
2018 doi
-
[54]
A., Krissansen-Totton, J., Wogan, N., Telus, M., & Fortney, J
Thompson, M. A., Krissansen-Totton, J., Wogan, N., Telus, M., & Fortney, J. J. 2022, Proceedings of the National Academy of Sciences, 119, e2117933119, 10.1073/pnas.2117933119
2022 doi
-
[55]
E., et al
Virtanen, P., Gommers, R., Oliphant, T. E., et al. 2020, Nature Methods, 17, 261, 10.1038/s41592-019-0686-2
2020 doi
-
[56]
I., Boogert, A
Öberg, K. I., Boogert, A. C. A., Pontoppidan, K. M., et al. 2008, ApJ, 678, 1032, 10.1086/533432
2008 doi
Reviewed August 11, 2026 · model on record in the stance chip above.
Discussion (0). Continue with ORCID to comment.