REVIEW 2 major objections 4 minor 13 references
Blinded sample size re-estimation in equivalence testing
T0 review · 2 major / 4 minor · reviewed 2026-08-14 · deepseek-v4-flash
Pith's one-line read Blinded sample size re-estimation in equivalence testing can inflate type I error rates above nominal levels, with the mechanism traced to the total variance estimate's dependence on the squared mean difference.
desk verdict Solid mechanism and extensive simulations, but the quantitative guardrails rest on an unverified z/t sample-size equivalence; the qualitative inflation result stands. read the letter →
The pith
A machine-rendered reading of the paper's core claim, the machinery that carries it, and where it could break.
The reading
What carries the argument
The load-bearing object is the blinded total variance estimate $\hat{\sigma}_T^2$, the one-sample variance of all observations pooled across the two treatment groups. Its expectation under the shifted null (Equation (2)) is the identity that carries the argument: it contains a positive term proportional to $\delta^2/\sigma^2$, so the estimator is not unbiased under $H_0$ when the margin $\delta_0$ is positive. This makes small observed variances coincide with data in favor of the alternative. The sample size rule then turns that correlation into error inflation because the planned second-stage size $\hat{N}$ is an increasing function of $\hat{\sigma}_T^2$; the appendix shows that an exact noncentral chi-square decomposition allows the type I error to be computed for a threshold rule.
What would settle it
Rerun the simulation grid using the exact noncentral t-distribution sample size formula instead of Equation (3) and compare the peak inflation values in Table 2; if the exact formula shifts the peaks by more than simulation error for small interim samples, the paper's practical caps on interim size, minimum total, and maximum total would not transfer as stated.
Extended reading notes
Core claim
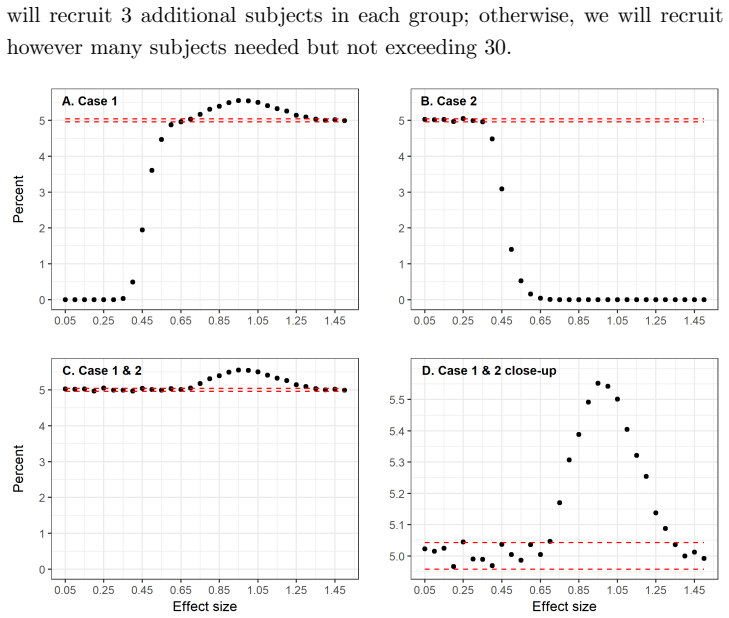
The paper's central claim is that the type I error of TOST equivalence testing is not preserved by blinded SSR, and that the violation is driven by Equation (2): under $H_0$ with $\delta=\delta_0>0$, $$E(\hat{\$\sigma$}$_T^{2}$)=\$sigma^{2}$\left(1+\frac{\tilde{n}_1\tilde{n}_2}{\tilde{n}_*(\tilde{n}_*-1)}\frac{\$delta^{2}$}{\$sigma^{2}$}\right).$$ Because the total variance estimator is an increasing function of the squared true mean difference, small values of $\hat{\sigma}_T^2$ are evidence against $H_0$. A blinded SSR rule whose final sample size is an increasing function of $\hat{\sigma}_T^2$ therefore tends to stop early when the data already favor rejection and to enlarge the study when the data do not, inflating the chance of declaring equivalence. Simulations with one million replications per setting show peak type I error rates of 6.26% at $\tilde{n}=10$ per group and 5.23% at $\tilde{n}=60$, with the worst inflation at standardized equivalence margins near $\delta_0/\sigma \approx 0.55$ to $1.20$. The appendix gives an exact numerical evaluation for a threshold rule, confirming inflation analytically rather than only by simulation.
Load-bearing premise
The quantitative recommendations rest on the assertion that the simpler normal-approximation sample size formula (Equation (3)) produces the same type I error inflation pattern as the exact noncentral t-based formula; the paper states this is essentially irrelevant but does not supply a proof or a direct comparison.
Editorial extensions
If this is right
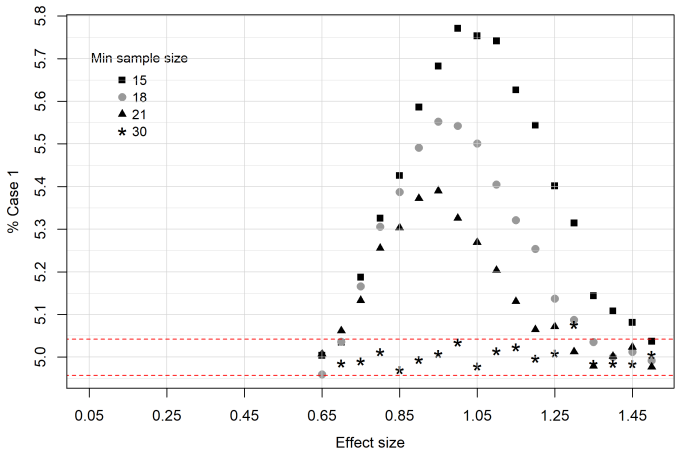
- With an interim sample of at least 15 subjects per group and a minimum total sample size of at least twice that, the maximum type I error in the simulated settings stays within 5.3%.
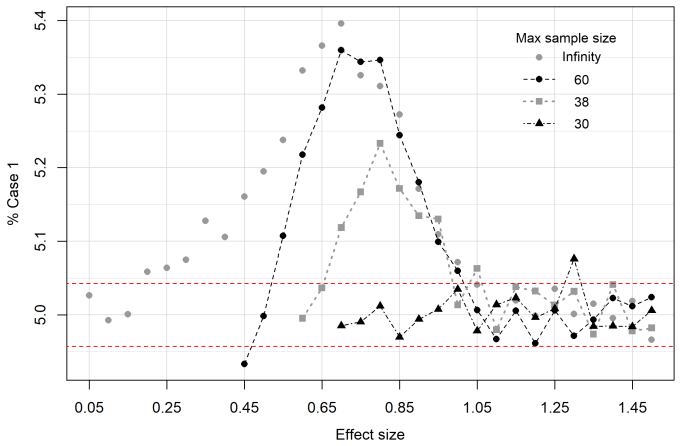
- The lower bound on the final sample size ($n_{\rm Min}$) is the main lever for controlling inflation at practically relevant equivalence margins; the upper bound matters mainly when the margin is much smaller than the standard deviation.
- The inflation persists even at larger interim samples (about 5.2% at $\tilde{n}=80$), so it is not only a small-sample curiosity.
- A design that keeps the second-stage sample size within a narrow range resembles a fixed design and keeps $\alpha$ closer to its nominal level, at the cost of reducing the flexibility that motivates SSR.
Reading between the lines
- The same mechanism would predict $\alpha$ deflation for any blinded SSR rule in which the second-stage sample size is a decreasing function of $\hat{\sigma}_T^2$; this is a direct consequence of Equation (2) and could be tested with the paper's simulation grid.
- The qualitative argument likely extends to other blinded variance estimators that are monotone increasing in the squared mean difference, not just the simple total variance estimate; verifying this would require new simulations.
- A practical implication the paper leaves implicit is that pre-specifying a narrow $n_{\rm Min}$–$n_{\rm Max}$ window is the cheapest fix, but it partially defeats the purpose of an interim reassessment; unblinded SSR is the alternative that restores flexibility while controlling error.
Signed reviews
Editorial analysis
A structured set of objections, weighed in public.
Referee Report
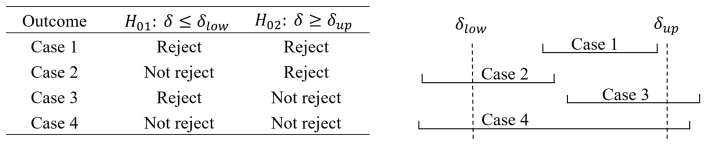
Summary. The manuscript investigates the type I error behavior of blinded sample size re-estimation (SSR) in two-group equivalence trials analyzed by TOST. Under the null hypothesis with a non-zero margin delta0, the interim total variance estimate sigma_hat_T^2 has expectation sigma^2 times a factor that increases with delta0^2/sigma^2, so a small sigma_hat_T^2 tends to occur for stage-1 data that already favor equivalence. An SSR rule that increases the second-stage sample size with sigma_hat_T^2 therefore preserves favorable data and dilutes unfavorable data, inflating the type I error. The paper derives this mechanism analytically, quantifies it by one-million-run simulations over a grid of stage-1 sample sizes, minimum and maximum sample size caps, and effect sizes, and gives practical recommendations: choose stage-1 sample size at least 15, impose nMin >= 2*nTilde for nTilde <= 30, impose nMax <= 3*nTilde, and claim maximum alpha can be limited to within 5.3%. An appendix provides an analytic numerical evaluation for a threshold-based SSR rule.
Significance. If the quantitative conclusions are supported, this is a useful applied paper: it gives a transparent explanation for a known but under-explained phenomenon, confirms non-negligible inflation for small but realistic stage-1 sizes, and offers concrete design constraints. The paper's strengths include a correct distribution-theoretic derivation of E(sigma_hat_T^2), a coherent four-case decomposition of TOST outcomes, very large simulations with tight Monte Carlo error, and an appendix with exact numerical evaluation of type I error for a threshold rule. The qualitative finding of inflation is robust. The main weakness is that the quantitative peak values and recommendations are computed with a normal-approximation sample size formula whose equivalence to the t-based formula used in practice is only asserted.
major comments (2)
- [Section 4.3, Eq. (3), Table 2] The assertion that it is 'essentially irrelevant' whether the z-based formula in Eq. (3) or the noncentral-t-based formula is used is not supported. The t-based sample size formula has degrees of freedom on both sides of the equation, so the mapping from sigma_hat_T^2 to the second-stage size N-hat differs from Eq. (3), and the difference is largest for small nTilde and small sigma_hat_T^2, precisely the regime where the paper's mechanism operates (Section 2 and Figure 4). Because the SSR enters the final test only through N-hat = f(sigma_hat_T^2), a different f can change both the magnitude of the inflation and the location of its peak along delta0/sigma; the claim of 'identical patterns' needs a proof or, more practically, a sensitivity analysis over the same grid using the t-based formula, for example via PowerTOST. Until such a comparison is provided, the numerical values in Table 2 and the practical bound in Section 6 are not established for the t-based calculations used in practice.
- [Section 6] The headline recommendation that 'maximum alpha can be limited to within 5.3%' is stated without a supporting summary. Table 2 reports peaks only for the uncapped case 0 <= m < infinity, and Figure 3 is a collection of heatmaps from which the reader cannot verify the maximum over the entire grid of settings satisfying the proposed rules (nTilde >= 15, nMin >= 2*nTilde for nTilde <= 30, nMax <= 3*nTilde). Please report the maximum observed Case-1 probability and its Monte Carlo standard error across all grid points in the recommended design class, together with the corresponding (nTilde, nMin, nMax, delta0/sigma) configuration. This is needed to make the 5.3% claim reproducible and to assess its sensitivity to the z/t issue raised above.
minor comments (4)
- [Section 5.1, Eq. (4)] The displayed variance formula is dimensionally inconsistent: with sigma not set to 1 it should read Var(sigma_hat_T^2) = 2*sigma^4/(2*nTilde - 1)^2 * [2*nTilde - 1 + nTilde*delta^2/sigma^2], not 2*sigma^2 times the bracket. The simulations set sigma = 1, so this does not affect the numerical results, but the formula should be corrected.
- [Section 4.2] The sentence 'In each simulated sample t-test is conducted between the two groups' should read 'the TOST procedure, i.e., two one-sided t-tests, is conducted', since the type I error rates in Table 2 and Figure 3 are for the equivalence test.
- [Section 2] The phrase 'If the true delta > 0' should be phrased as 'if the null configuration delta = delta0 > 0 holds', because delta is the fixed parameter and the sentence is otherwise easy to misread.
- [Section 5.1, Figure 4] The text describes bars as 'percentage of rejections which occur in intervals' of sigma_hat_T^2; it would help to state explicitly that these are joint proportions (rejection and sigma_hat_T^2 interval), not conditional rejection rates, because the subsequent comparison of gray and black bars depends on this.
Circularity Check
No circular dependency found: the analytic expectation, simulation results, and practical recommendations are derived independently of the target type I error conclusion.
full rationale
The paper's central derivation is self-contained. Equation (2) is a direct calculation of E(sigmaHat_T^2) from Cochran's theorem under the stated null model, and the inflation mechanism follows from the behavior of the SSR rule as a function of sigmaHat_T^2. The simulations generate data from the null distribution and empirically count rejections; no parameter is fitted from the target rejection rates. The self-citation to reference [4] is background support and is not load-bearing for the paper's own derivation or recommendations. The Section 4.3 claim that the z-formula and t-formula produce identical inflation patterns is an unproven assumption and a legitimate robustness concern, but it is not a circular reduction: the claim is not used to define the target result, and the simulations are not constructed to force it. The practical recommendations in Section 6 follow from the simulated pattern and are not assumed in the derivation. No equation or fitted quantity is equivalent to the reported type I error inflation by construction.
Assumptions & free parameters
free parameters (4)
- Assumed effect D in sample size formula =
0
- Nominal error rates alpha and beta =
alpha=0.05, beta=0.10
- Standard deviation sigma =
1
- Design grid (nTilde, nMin, nMax) =
nTilde in 10..80, nMin/nTilde in 1..2, nMax/nTilde in 2..infinity
assumptions (6)
- standard math Cochran's theorem gives Q1 and Q2 independent with Q1 ~ sigma^2 chi^2(nTilde*-2) and Q2 ~ sigma^2 chi^2(1; nTilde1 nTilde2/nTilde* delta^2/sigma^2).
- domain assumption The two groups have independent normal observations with a common variance sigma^2.
- domain assumption After the interim, only the total sample size changes; other design elements remain fixed.
- domain assumption The final analysis is the standard two-sample t-test on the combined stage 1 and stage 2 data, unadjusted for the adaptive design.
- ad hoc to paper The asymptotic normal sample size formula in Equation (3), with D=0, produces the same type I error inflation pattern as the exact noncentral t-based formula.
- domain assumption At the null boundary the true mean difference is delta0, so type I error is evaluated by simulating data with mean difference delta0.
Cite this review
Pith. "Pith review of Blinded sample size re-estimation in equivalence testing." pith.science (2026). https://pith.science/paper/G2MV2JLC
@misc{pith2026190804695,
  author       = {Pith},
  title        = {Pith review of: Blinded sample size re-estimation in equivalence testing},
  year         = {2026},
  howpublished = {\url{https://pith.science/paper/G2MV2JLC}},
  note         = {Machine review of arXiv:1908.04695}
}
read the original abstract
This paper investigates type I error violations that occur when blinded sample size reviews are applied in equivalence testing. We give a derivation which explains why such violations are more pronounced in equivalence testing than in the case of superiority testing. In addition, the amount of type I error inflation is quantified by simulation as well as by some theoretical considerations. Non-negligible type I error violations arise when blinded interim re-assessments of sample sizes are performed particularly if sample sizes are small, but within the range of what is practically relevant.
Figures

Figures from the paper (4 more)


Reference graph
Works this paper leans on
-
[1]
A two-sample test for a linear hypothesis whose power is inde- pendent of the variance
Stein C. A two-sample test for a linear hypothesis whose power is inde- pendent of the variance. The Annals of Mathematical Statistics 1945; 16:243–258
work page 1945
-
[2]
Simple procedures for blinded sample size adjust- ment that do not affect the type I error rate
Kieser M, Friede T. Simple procedures for blinded sample size adjust- ment that do not affect the type I error rate. Statistics in Medicine 2003; 22:3571–3581
work page 2003
-
[3]
Sample size recalculation in internal pilot study designs: a review
Friede T, Kieser M. Sample size recalculation in internal pilot study designs: a review. Biometrical Journal 2006; 48:537–555
work page 2006
-
[4]
Connections between permutation and t-tests: relevance to adaptive methods
Proschan M, Glimm E, and Posch M. Connections between permutation and t-tests: relevance to adaptive methods. Statistics in Medicine 2014; 33:4734–4742
work page 2014
-
[5]
Distribution of the two-sample t-test statistic following blinded sample size re-estimation
Lu K. Distribution of the two-sample t-test statistic following blinded sample size re-estimation. Pharmaceutical Statistics 2016; 15:208–215
work page 2016
-
[6]
Blinded sample size reassessment in non-inferiority and equivalence trials
Friede T, Kieser M. Blinded sample size reassessment in non-inferiority and equivalence trials. Statistics in Medicine 2003; 22:995–1007
work page 2003
-
[7]
Sample size reassessment in non-inferiority trials: internal pilot study designs with ANCOVA
Friede T, Kieser M. Sample size reassessment in non-inferiority trials: internal pilot study designs with ANCOVA. Methods of Information in Medicine 2011; 50:237–243
work page 2011
-
[8]
Friede T, Kieser M. Blinded sample size re-estimation in superiority and noninferiority trials: bias versus variance in variance estimation. Pharmaceutical Statistics 2013; 12:141–146
work page 2013
Show all 13 references
-
[9]
A comparison of the two one-sided tests procedure and the power approach for assessing the equivalence of average bioavailabil- ity
Schuirmann D. A comparison of the two one-sided tests procedure and the power approach for assessing the equivalence of average bioavailabil- ity. Journal of Pharmacokinetics and Biopharmaceutics 1987; 15:657– 680
1987
-
[10]
PASS 11 2011
Hintze J. PASS 11 2011. NCSS, LLC. Kaysville, Utah, USA. www.ncss.com
2011
-
[11]
PowerTOST: Power and sample size based on two one-sided t-tests (TOST) 24 for (bio)equivalence studies 2018
Labes D, Schuetz H, and Lang B. PowerTOST: Power and sample size based on two one-sided t-tests (TOST) 24 for (bio)equivalence studies 2018. R package version 1.4-7. https://CRAN.R-project.org/package=PowerTOST
2018
-
[12]
Davit B, Chen M, Conner D, et. al. Implementation of a reference- scaled average bioequivalence approach for highly variable generic drug products by the US Food and Drug Administration.The AAPS Journal 2012; 14:915–924
2012
-
[13]
Controlling the type I error rate in two-stage sequential adaptive designs when testing for average bioe- quivalence
Maurer W, Jones B, and Chen Y. Controlling the type I error rate in two-stage sequential adaptive designs when testing for average bioe- quivalence. Statistics in Medicine 2018; 37:1587–1607. 25
2018
Reviewed August 14, 2026 · model on record in the stance chip above.
Discussion (0). Continue with ORCID to comment.