REVIEW 1 major objections 4 minor 39 references
Controlling distant contacts to reduce disease spreading on disordered complex networks
T0 review · 1 major / 4 minor · reviewed 2026-08-14 · deepseek-v4-flash
Pith's one-line read This paper shows that in the two-disorder SIR model on locally tree-like networks, shortening distant contacts can move an epidemic to the non-epidemic phase whenever the density $f_1$ of close contacts is below $T_c/\beta$, even if close…
desk verdict The central mitigation threshold f̃1=Tc/β is derived and correct for tr=1, but the abstract and conclusions overgeneralize it to tr>1, where the correct bound is Tc/[1-(1-β)^tr]; the paper needs that correction. read the letter →
The pith
A machine-rendered reading of the paper's core claim, the machinery that carries it, and where it could break.
The reading
What carries the argument
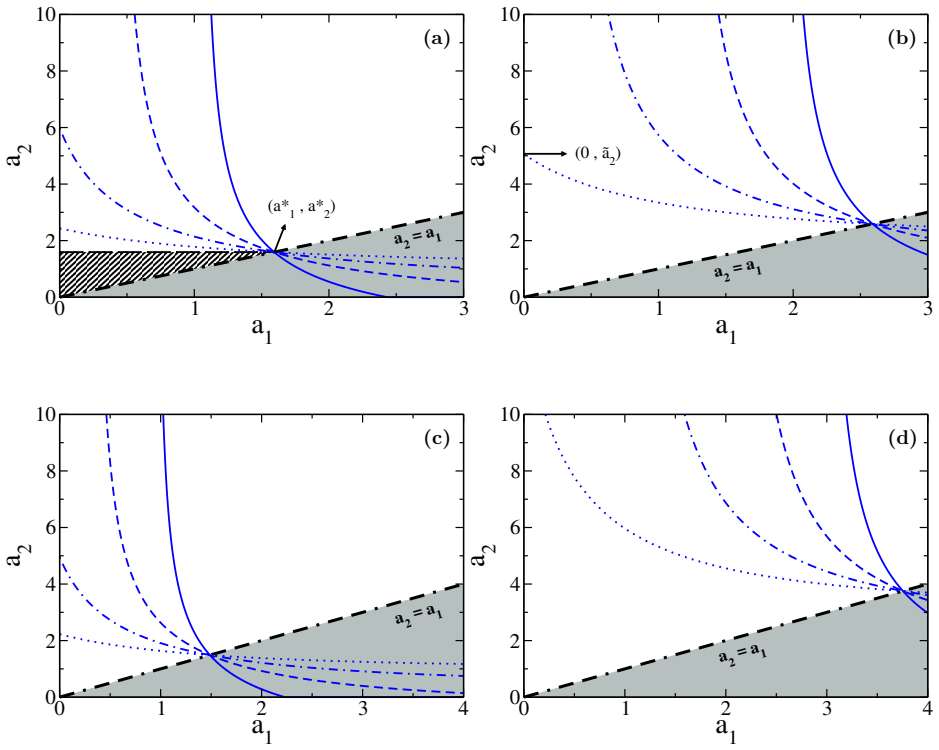
The machinery is the mapping of the SIR model onto link percolation: the average transmissibility of the disordered network is identified with the bond-occupation probability $p$, and the epidemic threshold is the percolation threshold $p_c = T_c = 1/(\kappa-1)$ on locally tree-like networks. The branching-process equations $f_\infty = 1 - G_1(1-p f_\infty)$ and $P_\infty = 1 - G_0(1-p f_\infty)$ then give the final epidemic size. Disorder enters through the weighted average $T = f_1 T_{a_1} + (1-f_1) T_{a_2}$, where $T_{a_i}$ is the single-disorder transmissibility of Eq. (2). Solving the threshold equation (3) for $a_{2c}$ produces the phase diagram, and its limit $a_1\to 0$ yields Eq. (4), whose solvability is the condition for the mitigation strategy to exist.
What would settle it
Run the same two-disorder SIR dynamics on a configuration-model network modified to include a measured level of clustering (for example, by adding triangles or household structure) and check whether increasing $a_2$ still suppresses the epidemic when $f_1 < T_c/\beta$. If clustering raises the effective threshold enough that epidemics survive, the locally tree-like percolation mapping is the load-bearing assumption that would need modification.
Extended reading notes
Core claim
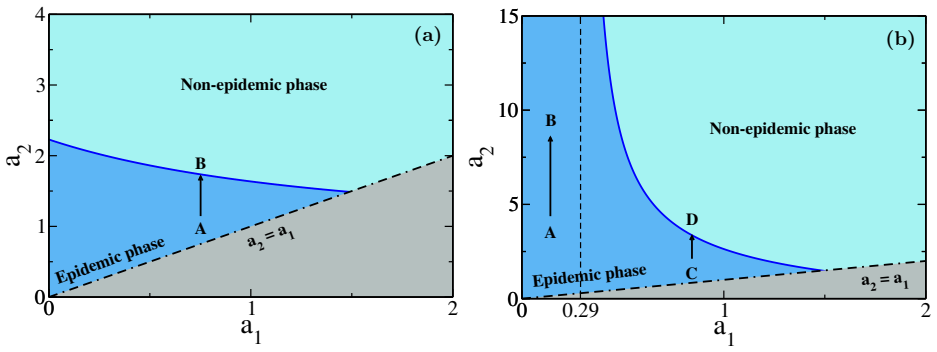
The central discovery is a critical condition for epidemic control in a network with two classes of contact duration. With average transmissibility $T = f_1 T_{a_1} + (1-f_1) T_{a_2}$ and epidemic threshold $T_c = 1/(\kappa-1)$, increasing the disorder intensity $a_2$ of distant contacts brings the system into the non-epidemic phase if and only if $f_1 < T_c/\beta$. In that regime Eq. (4), $T_c = f_1\beta + (1-f_1)\beta (1-e^{-\tilde a_2})/\tilde a_2$, has a finite solution $\tilde a_2$ even at $a_1=0$, so the strategy works no matter how long close contacts last. For $f_1 > T_c/\beta$, the strategy works only when close contacts are already sufficiently short; otherwise there is a minimum close-contact intensity $a_{1m}$ below which no finite shortening of distant contacts prevents an epidemic. The phase diagram is verified by simulations on homogeneous random networks and truncated scale-free networks, and the qualitative conclusions survive for recovery times $t_r>1$ and for the experimentally motivated distribution $P'(\omega)\propto \omega^{-1.6}$.
Load-bearing premise
The phase boundary is computed by identifying the average transmissibility with the percolation probability and using the threshold $T_c=1/(\kappa-1)$, which is exact only for locally tree-like, degree-uncorrelated configuration-model networks in the thermodynamic limit; real contact networks with clustering and household structure could shift this number.
Editorial extensions
If this is right
- If $f_1 < \tilde f_1 = T_c/\beta$, shortening distant contacts alone can move the system from any epidemic point in the $(a_1,a_2)$ plane to the non-epidemic phase, including the limit $a_1=0$ where close contacts have maximal transmissibility.
- The required shortening of distant contacts shrinks as the density of close contacts decreases, so the strategy is most efficient in populations where unavoidable close ties are a minority.
- For $f_1 > \tilde f_1$, the strategy has a limitation: it works only when close-contact durations are already below a minimum value $a_{1m}$; otherwise no reduction of distant contacts suffices.
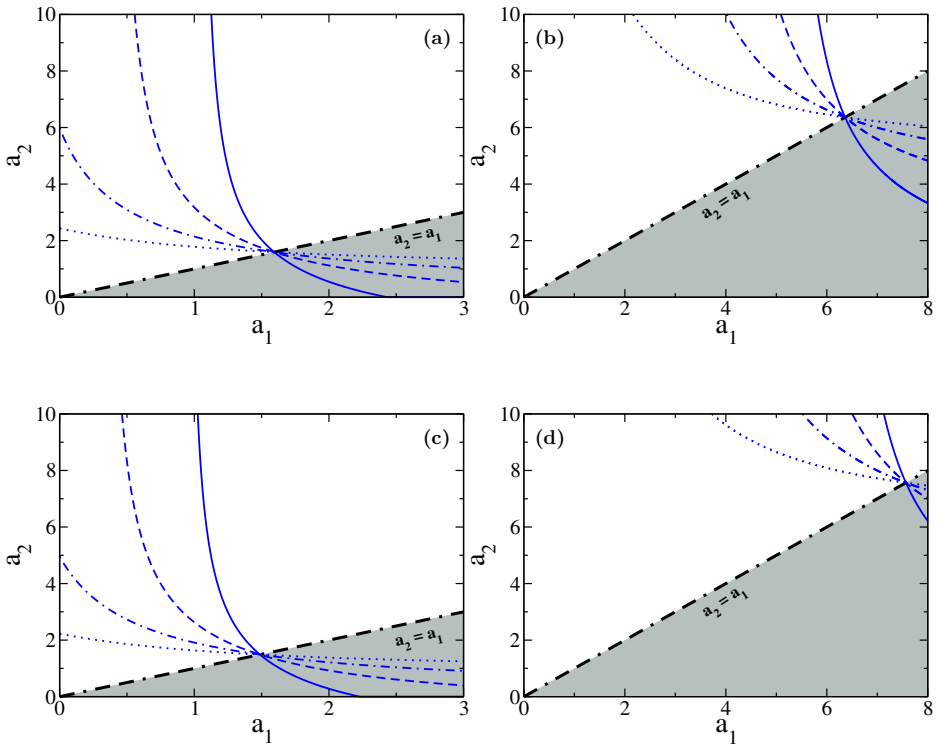
- Longer recovery times widen the epidemic phase, meaning the same strategy demands stronger reductions in distant-contact duration for diseases with longer infectious periods, although the qualitative phase structure is unchanged.
- Heterogeneous scale-free networks require larger reductions of distant contacts than homogeneous random networks, because hubs accelerate transmission once infected.
Reading between the lines
- Beyond the paper, the threshold $\tilde f_1 = T_c/\beta$ suggests an actionable planning rule: estimate $T_c$ from the contact network and $\beta$ from the pathogen, measure the close-contact fraction $f_1$, and only then commit to a distant-contact shortening policy.
- The comparison with $P'(\omega)\propto \omega^{-1.6}$ implies that in populations with strongly right-skewed contact durations, suppression may be easier than the uniform power-law model predicts; individual-level contact data could be used to test which distribution governs the strategy's critical line.
- Because the argument is just a weighted-transmissibility substitution in the percolation mapping, the same threshold logic should transfer to other spreading processes that share the bond-percolation representation, such as information or computer-virus propagation on weighted networks, provided transmissibility is duration-dependent.
- Interventions that reduce the effective virulence $\beta$ (masks, ventilation, vaccination) would raise the permissible close-contact density $\tilde f_1$, so combining them with distant-contact shortening should widen the non-epidemic region more than either measure alone.
Signed reviews
Editorial analysis
A structured set of objections, weighed in public.
Referee Report
Summary. The manuscript studies an SIR epidemic model on configuration-model networks in which edges carry one of two disorder classes: close contacts (fraction f1, disorder intensity a1) and distant contacts (fraction 1-f1, intensity a2 > a1). Contact-time disorder enters through per-link transmission weights beta*omega with omega drawn from P(omega)=1/(a omega). The authors propose mitigating epidemics by increasing a2, i.e., shortening distant contacts, and use the transmissibility-based mapping to bond percolation to derive a critical a2^c(a1). For tr=1 they show that as a1 tends to 0 the critical curve approaches a finite a2_tilde, which exists iff f1 < Tc/beta = f1_tilde; hence if close contacts are sufficiently rare, shortening distant contacts can move the system to the non-epidemic phase even when close contacts have maximal duration. They illustrate the phase boundary on the (a1,a2) plane for ER and SF networks, compare tr=1 and tr=5, and consider an empirically motivated P'(omega) proportional to omega^{-1.6} distribution for close contacts.
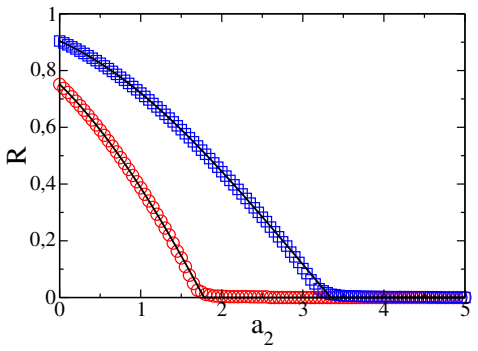
Significance. If correct within its stated locally tree-like, uncorrelated-network assumptions, the paper provides a simple and falsifiable design rule for social-distancing interventions: in the tr=1 case explicitly derived, only the density of unmodifiable close contacts, not their duration, determines whether shortening distant contacts can eliminate an epidemic. The derivation is parameter-free in the sense that the threshold is expressed in terms of the percolation critical point Tc and the virulence beta, and the simulation-theory agreement in Fig. 2 supports the percolation mapping. The paper is appropriately careful about its modeling assumptions: it restricts the theoretical analysis to configuration-model, locally tree-like networks in the thermodynamic limit, so the numerical threshold is a model prediction rather than a universal constant. The main weakness is that the headline threshold is stated without the tr=1 qualification and is then used in a context where the paper itself extends to tr=5.
major comments (1)
- [Abstract; Sec. III, Eq. (4); Sec. V; Fig. 5] The headline threshold f1_tilde = Tc/beta is derived under the explicit assumption tr=1, but the abstract and conclusions state it without this qualification, and Fig. 5 extends the analysis to tr=5. For tr>1, the transmissibility of an a1=0 close contact is T0(tr)=1-(1-beta)^tr, not beta. Replacing beta by T0(tr) in Eq. (4) gives existence of a2_tilde only when f1 < Tc/T0(tr). Since T0(tr)>beta for tr>1, the stated threshold overestimates the allowable density of close contacts. For example, for an ER network with <k>=4 (kappa=5, Tc=0.25), beta=0.5, and tr=5, Tc/beta=0.5 while Tc/T0(5)=0.25/0.96875 approximately 0.258. For f1=0.4 the abstract's criterion predicts controllability, yet no finite a2 satisfies the a1=0 critical equation because f1*T0(5) already exceeds Tc. Equation (5) has the same issue. The paper should state that f1_tilde = Tc/beta applies to tr=1 and, if the general case is to be covered, derive the general condition f1 < Tc/[1-(1-beta)^tr].
minor comments (4)
- [Sec. II, Fig. 2] The simulation points in Fig. 2 have no error bars, and only one ER network case is reported despite the text describing 'extensive simulations'; adding error bars and at least one SF-network simulation would strengthen the empirical support.
- [Sec. III, Figs. 3 and 5] The phase diagrams in Figs. 3 and 5 are theoretical curves; no direct simulation of the phase boundary is reported, so the text should state explicitly that the phase boundaries are predictions of the percolation mapping rather than direct simulation results.
- [Sec. II, Eq. (2)] Equation (2) is imported from Ref. [34] without derivation; since it is central to the critical-condition analysis, a short derivation or an appendix would make the paper self-contained.
- [Sec. III, Eq. (4)] The notation T_{a_i} in Eq. (2) does not show the dependence on beta and tr; writing T_{a_i}(beta, tr) would make the tr=1 restriction in Eqs. (3)-(5) and the tr=5 generalization in Fig. 5 easier to follow.
Circularity Check
No circularity: the threshold f1 < Tc/beta is a direct algebraic consequence of the stated model and standard percolation theory, and the only self-cited input formula is independently validated by simulations.
full rationale
The paper's central result, the existence condition f1 < Tc/beta for the mitigation strategy, is derived in Eqs. (1)-(4) from the model definition T = f1 T_a1 + (1-f1) T_a2 together with the standard percolation critical point Tc = 1/(kappa-1). Eq. (4) is Tc = f1 beta + (1-f1) beta (1 - e^{-a2})/a2, and since (1 - e^{-x})/x is strictly between 0 and 1 for x > 0, the existence of a2 requires exactly f1 < Tc/beta. This is algebra, not a fitted result. The only externally cited ingredient is the single-disorder transmissibility formula, Eq. (2), attributed to Ref. [34], which shares an author with this paper. That self-citation is not load-bearing in a circular sense: the formula is parameter-free, stated with explicit assumptions about the contact-time distribution, and the paper independently checks it by comparing the resulting percolation solution against SIR simulations in Fig. 2, finding excellent agreement. The generalization to tr > 1 in Fig. 5 and the wording of the abstract/conclusions raise a legitimate modeling-scope concern about whether the threshold should be Tc/[1 - (1-beta)^tr] rather than Tc/beta, but that is an internal overgeneralization or correctness issue, not circular reasoning. No fitted parameter is renamed as a prediction, no known result is merely renamed, and no uniqueness claim is imported from the authors' prior work. The derivation is self-contained once the standard percolation mapping is accepted, and the paper provides its own simulation-based support for the input transmissibility formula.
Assumptions & free parameters
assumptions (6)
- standard math SIR final size maps to link percolation: R = P∞ and the epidemic threshold is Tc = 1/(κ - 1).
- domain assumption For a single disorder intensity a, transmissibility is T_a = Σ_{t=1}^{tr} [(1 - βe^{-a})^t - (1 - β)^t] / (a t).
- domain assumption The transmissibility of the two-type network is the weighted average T = f1 T_{a1} + (1 - f1) T_{a2}.
- domain assumption Contact times are quenched random variables drawn from P(ω) = 1/(aω) with ω ∈ [e^{-a}, 1], and a susceptible-infected pair transmits with probability βω per time step.
- domain assumption Networks are generated by the Molloy-Reed algorithm and are locally tree-like with no clustering in the thermodynamic limit.
- domain assumption The Sec IV comparison assumes P'(ω) = 1/(a'_1 ω^1.6) with lower cutoff set by equal minimum ω for both distributions.
Cite this review
Pith. "Pith review of Controlling distant contacts to reduce disease spreading on disordered complex networks." pith.science (2026). https://pith.science/paper/G2PQGYZP
@misc{pith2026190806147,
  author       = {Pith},
  title        = {Pith review of: Controlling distant contacts to reduce disease spreading on disordered complex networks},
  year         = {2026},
  howpublished = {\url{https://pith.science/paper/G2PQGYZP}},
  note         = {Machine review of arXiv:1908.06147}
}
abstract
In real social networks, person-to-person interactions are known to be heterogeneous, which can affect the way a disease spreads through a population, reaches a tipping point in the fraction of infected individuals, and becomes an epidemic. This property, called disorder, is usually associated with contact times between individuals and can be modeled by a weighted network, where the weights are related to normalized contact times $\omega$. In this paper, we study the SIR model for disease spreading when both close and distant types of interactions are present. We develop a mitigation strategy that reduces only the time duration of distant contacts, which are easier to alter in practice. Using branching theory, supported by simulations, we found that the effectiveness of the strategy increases when the density $f_1$ of close contacts decreases. Moreover, we found a threshold $\tilde{f}_1 = T_c / \beta$ below which the strategy can bring the system from an epidemic to a non-epidemic phase, even when close contacts have the longest time durations.
Figures

Figures from the paper (3 more)

Reference graph
Works this paper leans on
-
[1]
Then, we plot a2c as a function of a1 for both cases [see Fig
For a fixed value of a1, we compute the corresponding value for a′ 1 and use these two intensities to obtain the critical values a2c for each case. Then, we plot a2c as a function of a1 for both cases [see Fig. 6(a)]. This allows a comparison of the results when both distributions have the same range of normalized contact times. We can see that for the dis...
work page 2014
-
[2]
R. M. Anderson and R. M. May, Infectious Diseases of Humans: Dynamics and Control (Oxford University Press, Oxford, 1992)
work page 1992
-
[3]
N. P. A. S. Johnson and J. Mueller, Bull. Hist. Med. 76, 105 (2002)
work page 2002
- [4]
- [5]
-
[6]
New york is fighting its worst outbreak of measles in decades,
M. Fox, “New york is fighting its worst outbreak of measles in decades,” (2019)
work page 2019
-
[7]
A. E. van den Bogaard and E. E. Stobberingh, Int. J. Antimicrob. Ag. 14, 327 (2000)
work page 2000
-
[8]
Using climate to predict infectious disease outbreaks: A review,
World Health Organization, “Using climate to predict infectious disease outbreaks: A review,” (2004)
work page 2004
Show all 39 references
-
[9]
A. J. McMichael, R. E. Woodruff, and S. Hales, The Lancet 367, 859 (2006)
2006
-
[10]
Greger, Crit
M. Greger, Crit. Rev. Microbiol. 33, 243 (2007)
2007
-
[11]
M. E. J. Newman, Phys. Rev. E 66, 016128 (2002)
2002
-
[12]
Boccaletti, V
S. Boccaletti, V. Latora, Y. Moreno, M. Chavez, and D. Hwang, Phys. Rep. 424, 175 (2006)
2006
-
[13]
M. E. J. Newman, Networks: An Introduction (Oxford University Press, 2010)
2010
-
[14]
Castellano and R
C. Castellano and R. Pastor-Satorras, Phys. Rev. Lett 105, 218701 (2010)
2010
-
[15]
Pastor-Satorras, C
R. Pastor-Satorras, C. Castellano, P. Van Mieghem, and A. Vespignani, Rev. Mod. Phys. 87, 925 (2015)
2015
-
[16]
W. Wang, M. Tang, H. E. Stanley, and L. A. Braunstein, Reports on Progress in Physics 80, 036603 (2017)
2017
-
[17]
Grassberger, Math
P. Grassberger, Math. Biosci. 63, 157 (1983). 16
1983
-
[18]
N. T. J. Bailey, The Mathematical Theory of Infectious Diseases (Griffin, London, 1975)
1975
-
[19]
J. C. Miller, Phys. Rev. E 76, 010101 (2007)
2007
-
[20]
Kenah and J
E. Kenah and J. M. Robins, Phys. Rev. E 76, 036113 (2007)
2007
-
[21]
Lagorio, M
C. Lagorio, M. V. Migueles, L. A. Braunstein, E. L´ opez, and P. Macri, Physica A 388, 755 (2009)
2009
-
[22]
L. A. Meyers, Bull. Amer. Math. Soc. 44, 63 (2007)
2007
-
[23]
M. J. Ferrari, S. Bansal, L. A. Meyers, and O. N. Bjørnstad, Proc. R. Soc. London, Ser. B 273, 2743 (2006)
2006
-
[24]
Bansal, B
S. Bansal, B. Pourbohloul, and L. A. Meyers, PLoS Med. 3, e387 (2006)
2006
-
[25]
M. A. Di Muro, L. G. Alvarez-Zuzek, S. Havlin, and L. A. Braunstein, New J. Phys. 20, 083025 (2018)
2018
-
[26]
Gross, C
T. Gross, C. J. Dommar D’Lima, and B. Blasius, Phys. Rev. Lett. 96, 208701 (2006)
2006
-
[27]
Lagorio, M
C. Lagorio, M. Dickison, F. Vazquez, L. A. Braunstein, P. A. Macri, M. V. Migueles, S. Havlin, and H. E. Stanley, Phys. Rev. E 83, 026102 (2011)
2011
-
[28]
Buono, C
C. Buono, C. Lagorio, P. A. Macri, and L. A. Braunstein, Physica A 391, 4181 (2012)
2012
-
[29]
L. D. Valdez, P. A. Macri, and L. A. Braunstein, Phys. Rev. E 85, 036108 (2012)
2012
-
[30]
Buono, F
C. Buono, F. Vazquez, P. A. Macri, and L. A. Braunstein, Phys. Rev. E 88, 022813 (2013)
2013
-
[31]
Eastwood, D
K. Eastwood, D. N. Durrheim, M. Butler, and E. A. Jon, Emerg. Infect. Dis. 16, 1211 (2010)
2010
-
[32]
Cattuto, W
C. Cattuto, W. V. den Broeck, A. Barrat, V. Colizza, J. F. Pinton, and A. Vespignani, PLoS ONE 5, e11596 (2010)
2010
-
[33]
Karsai, M
M. Karsai, M. Kivel¨ a, R. K. Pan, K. Kaski, J. Kert´ esz, A. L. Barab´ asi, and J. Saram¨ aki, Phys. Rev. E 83, 025102 (2011)
2011
-
[34]
Stehle´ e, A
J. Stehle´ e, A. Barrat, C. Cattuto, J. F. Pinton, L. Isella, and W. V. den Broeck, J. Theor. Biol. 271, 166 (2011)
2011
-
[35]
L. D. Valdez, C. Buono, P. A. Macri, and L. A. Braunstein, FRACTALS 21, 1350019 (2013)
2013
-
[36]
Molloy and B
M. Molloy and B. Reed, Random Struct. Algor. 6, 161 (1995)
1995
-
[37]
L. A. Braunstein, Z. Wu, Y. Chen, S. V. Buldyrev, T. Kalisy, S. Sreenivasan, R. Cohen, E. Lpez, S. Havlin, and H. E. Stanley, International Journal of Bifurcation and Chaos 17, 2215 (2007)
2007
-
[38]
M. E. J. Newman, S. H. Strogatz, and D. J. Watts, Phys. Rev. E 64, 026118 (2001)
2001
-
[39]
M. E. J. Newman, SIAM Rev. 45, 167 (2003). 17
2003
Reviewed August 14, 2026 · model on record in the stance chip above.
Discussion (0). Continue with ORCID to comment.