REVIEW 4 major objections 5 minor 18 references
An Age-Dependent Model for Dengue Transmission: Analysis and Comparison to Field Data from Semarang, Indonesia
T0 review · 4 major / 5 minor · reviewed 2026-08-14 · deepseek-v4-flash
Pith's one-line read Age-structured dengue model gets a unique endemic equilibrium and a convergent iteration.
desk verdict The math is sound and the fixed-point convergence result is real, but the Semarang data fit compares a steady-state prevalence curve to annual incidence counts, which is a genuine flaw in the empirical validation. read the letter →
The pith
A machine-rendered reading of the paper's core claim, the machinery that carries it, and where it could break.
The reading
What carries the argument
The central object is the scalar fixed-point equation for $Q$, the normalized infected proportion of the host population. It reduces the PDE equilibrium problem to a one-dimensional root-finding problem, $F(Q)=0$, where $F(Q)=1-\int\int_{\Omega} k(x,s)e^{-Q\Lambda(x,s)}\,d(s,x)$. The kernel $k(x,s)=p(x)\theta(s)e^{-\gamma(x-s)}/N$ and the accumulated exposure $\Lambda(x,s)=\int_s^x \theta(t)\,dt$ are what make the age structure visible in $R_0$; the monotonicity and concavity of $F$ supply existence and uniqueness, while the iteration map $T(Q)=Q(1-F(Q))$ supplies convergence. This machinery carries the entire argument from threshold characterization to the numerical parameter fits.
What would settle it
Use the optimized transmission curve from the six-year fit to simulate the model under each year's observed incidence forcing without averaging; if the resulting age distribution diverges from the reported individual-year data while the averaged data match, the steady-state-as-incidence identification fails.
Extended reading notes
Core claim
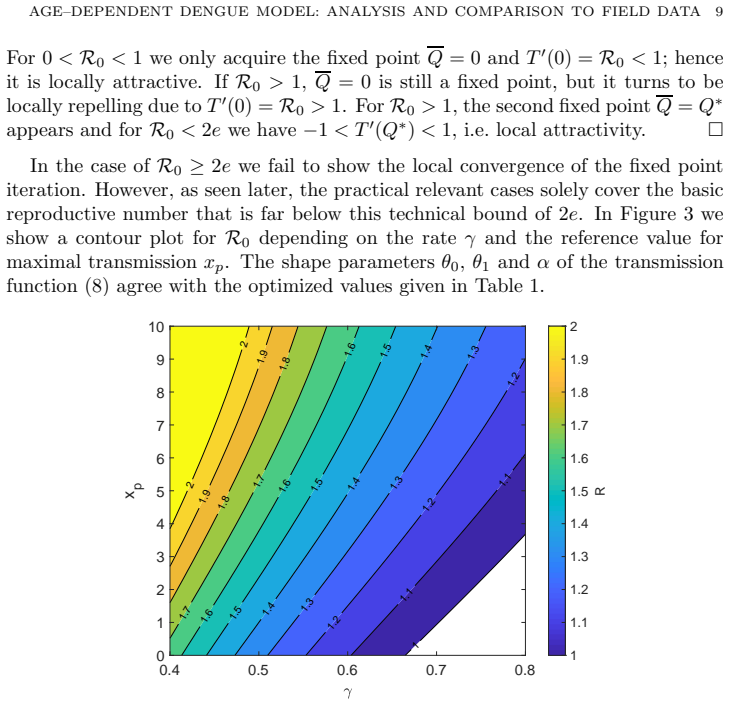
The paper's central claim is that the endemic equilibrium of the reduced host-only model is determined by the scalar $Q$, the normalized infected proportion, through the fixed-point equation $Q = Q \int\int_{\Omega} k(x,s)e^{-Q\Lambda(x,s)} \, d(s,x)$, where $k(x,s) = p(x)\theta(s)e^{-\gamma(x-s)}/N$ encodes population structure, age-dependent transmission, and loss of immunity. Defining $R_0 = \int\int_{\Omega} k(x,s)\,d(s,x)$, the authors prove that for $R_0\leq 1$ only the disease-free equilibrium exists, while for $R_0>1$ a unique $Q^*\in(0,1)$ exists; moreover, the iteration $Q^{(j)}=T(Q^{(j-1)})$ is locally convergent to $Q^*$ when $1<R_0<2e$, with $Q=0$ locally repelling. With the fitted Gaussian-plus-background transmission rate, the stationary infected fraction $i(x)=w(x)p(x)$ reproduces the averaged Semarang age distribution, and the SIR variant slightly improves the fit.
Load-bearing premise
The load-bearing premise is that the model's stationary infected fraction is proportional, without an explicit scale factor, to the observed yearly hospitalized-case counts; if that proportionality fails, the fitted transmission parameters do not estimate the intended age-dependent infection rate.
Editorial extensions
If this is right
- If $R_0 \leq 1$, the model permits only the disease-free equilibrium, so endemic dengue persistence in this age-structured setting requires the reproductive number to exceed one.
- For $1<R_0<2e$, the fixed-point iteration is locally convergent, so the endemic age distribution can be computed reliably whenever fitted parameters fall in that range.
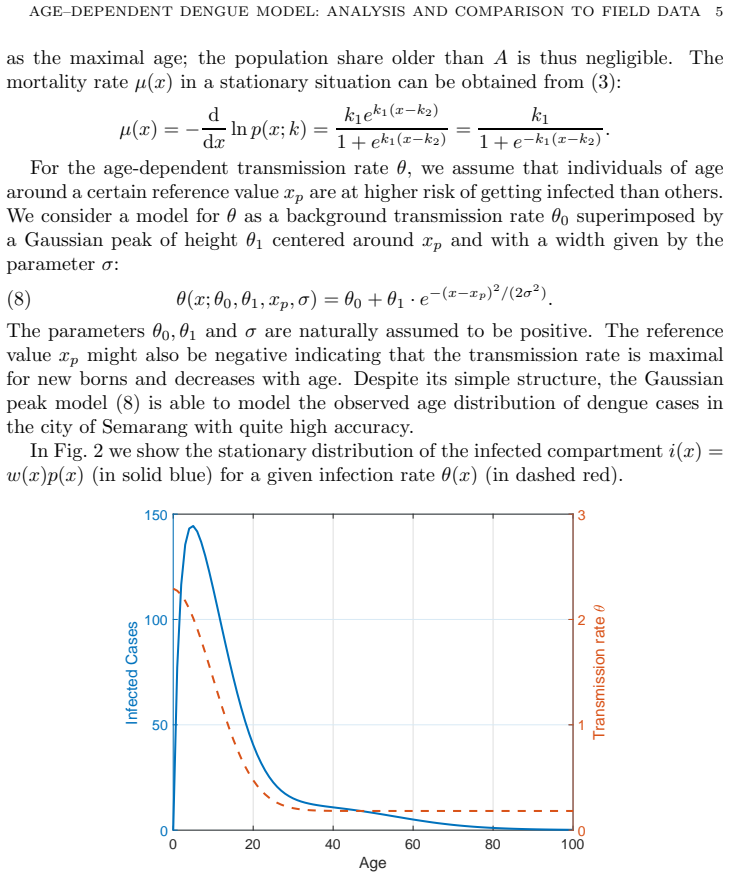
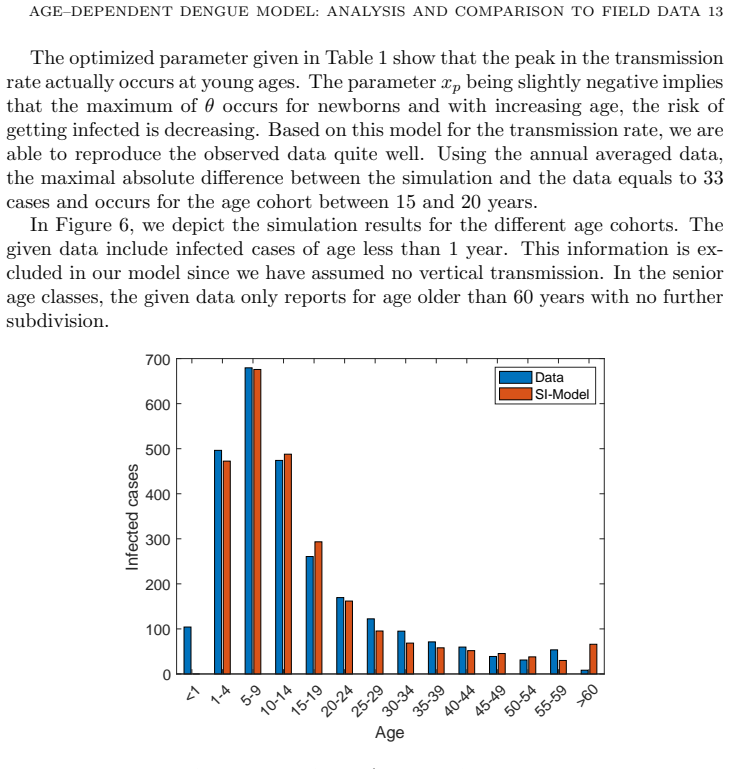
- The optimized transmission rate is maximal at birth and decreases with age, which the model identifies as the reason hospitalized-case counts are concentrated in younger age classes.
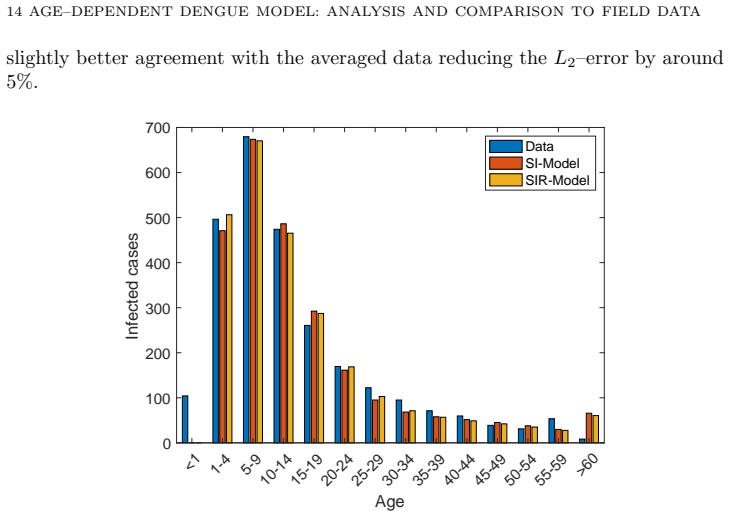
- The SIR extension lowers the $L^2$ error from 135.55 to 128.48, showing that adding a recovered class improves agreement with the averaged hospitalization data.
- For a constant transmission rate and linearly declining population, the asymptotic solution $z\simeq k-2$ recovers the classic SI equilibrium value $1-\gamma/\theta_0$ in the large-$A\theta_0$ limit, linking the age-structured model to the familiar age-independent result.
Reading between the lines
- The data are annual hospitalization counts while the model is a stationary prevalence profile; fitting without an explicit age-dependent reporting or hospitalization fraction implicitly assumes those two are proportional, an assumption the paper does not test.
- The theorem's convergence range is capped at $R_0<2e$ by a bounding argument rather than by a sharp condition; because the paper does not report fitted $R_0$ values, the margin between the fitted regime and this cap is unknown.
- A direct extension would be to fit the age-dependent reporting fraction as an unknown parameter; the resulting transmission curve would likely shift if hospitalization probability varies strongly with age.
- The same existence-and-convergence framework should extend to age-dependent recovery rates or to an SIR structure with age-dependent mortality, since the kernel and monotonicity arguments only require continuity and positivity of the coefficient functions.
Signed reviews
Editorial analysis
A structured set of objections, weighed in public.
Referee Report
Summary. This paper proposes an age-structured, vector-borne dengue model and reduces the vector dynamics by a time-scale argument to an age-structured SI-type host model. The endemic equilibrium is characterized by a scalar fixed-point problem for the total infected fraction Q, with infected age profile w(x) solving an ODE. The main analytical results are: if R0 <= 1 only the disease-free equilibrium exists, while if R0 > 1 a unique endemic equilibrium exists (Theorem 6); a fixed-point iteration converges locally for 1 < R0 < 2e (Theorem 10). The paper also derives an approximate closed-form solution for constant transmission and fits the model to hospitalized dengue case data from Semarang by least squares, comparing SI and SIR variants.
Significance. The analytical core is a solid, self-contained contribution: Theorem 6 follows from the monotonicity of F in Lemma 5, and Theorem 10 gives a concrete contraction range in terms of R0. The authors also correctly note that their fitted parameters place R0 within the proved convergence range. However, the empirical validation, which is advertised as a central contribution, is not convincing. The model output w(x)p(x) is an equilibrium prevalence, whereas the Semarang data are annual hospitalized-case counts, i.e., incidence; no hospitalization or reporting rate is introduced. In addition, the parameters are estimated on the same data used for validation. These issues directly affect the fitted parameters and the headline L2 errors, so the applied claims need substantial revision even though the theoretical results appear sound.
major comments (4)
- [Sec. 4.1-4.2, Eq. (5), Figs. 6-7] The quantity compared to the data is w(x)p(x)=i(x), the stationary prevalence of infected individuals, but the data are annual numbers of hospitalized cases, which are incidence flows. In the equilibrium of the age-structured SI model, the age-specific annual incidence of new infections is theta(x)(1-w(x))Q p(x)/N with Q defined in Eq. (5b), not i(x). These two curves are not proportional because w satisfies the differential equation in (5a), so the age profiles differ by the w'(x) term. The least-squares problem in Sec. 4.2 minimizes ||w-data||, so a prevalence stock is being fitted to incidence data. This can bias the estimated parameters, including the reported negative xp that places the transmission peak at newborns. The authors should either derive the model's incidence curve and fit that curve, include an age-dependent hospitalization or reporting rate, or explicitly justify and verify a proportionality between prevalence and annual hospitalized cases.
- [Sec. 4.2, Table 1] The parameters are chosen by minimizing the L2 distance to the same averaged data set that is then shown as agreement in Figs. 6 and 7. This is in-sample fitting rather than validation. The instability of the estimates is visible in Table 1: across the six yearly fits, xp ranges from -11.42 to 5.07 and theta1 from 1.23 to 2.70, yet only the average is used to support the model. A cross-validation or independent-year prediction, together with an uncertainty or identifiability analysis, is needed before the model can be described as validated.
- [Sec. 4.2-4.3 vs. Eq. (5b), Eq. (11)] There is a normalization inconsistency in the definition of Q. The fixed point is defined as Q = (1/N) integral p(y)w(y) dy in Eq. (5b) and Eq. (11), but the constraint in Sec. 4.2 is written with theta(1-w)Q/N, and Sec. 4.3 defines Q = integral_0^A p(y)w(y) dy without the factor 1/N. Since N is approximately 1.6 x 10^6, this is not a harmless rescaling: if the numerical implementation follows the written equations, the force of infection differs by a factor of N. The authors should state exactly which normalization was implemented and verify that the reported theta values are consistent with the model equations as written.
- [Sec. 4.3] The SIR model is fit to the same incidence data using the same prevalence-incidence identification, so the improved L2 error of 128.48 does not provide independent support for the method. Furthermore, the fixed-point iteration and convergence theorem were proved only for the SI model; the SIR equilibrium equations are not analyzed in Sec. 3, so the SIR comparison lacks the theoretical backing claimed for the overall framework. The SIR section should either be supported by an analogous analytical result or explicitly presented as a purely numerical comparison.
minor comments (5)
- [Eq. (8) and Table 1] The width parameter of the Gaussian transmission rate is denoted sigma in Eq. (8), but Table 1 and the surrounding text use alpha (e.g., the column header 'alpha' and the discussion after Table 1). Please use one symbol consistently.
- [Eq. (1), Eq. (5)] The model in Eqs. (1) and (5) is SIS-like, because infected individuals return to the susceptible class at rate gamma; calling it an SI model is confusing, especially when the SIR model in Sec. 4.3 is presented as an extension.
- [Eq. (21)] The prefactor [1 - A gamma/2 - A theta0] in Eq. (21) appears inconsistent with the value alpha/(gamma+alpha) obtained from Eq. (20). With the fitted parameter values (A=100, theta0=0.1821, gamma=0.6412) the prefactor is negative, which cannot be a valid endemic prevalence coefficient. Please check the algebra leading to this displayed formula.
- [Fig. 5] The y-axis label in Fig. 5 says 'Percentage of infected cases', but the data are percentages of hospitalized cases. Please re-label to avoid conflating infection with hospitalization.
- [Sec. 3.3, Eq. (15)] The formula for f(delta) in Eq. (15) is stated without derivation; adding one line of integration would make the section easier to check.
Circularity Check
Empirical validation is an in-sample least-squares fit presented as a prediction; the analytical Theorems 6 and 10 are independent.
-
fitted input called prediction
[Section 4.2 (Parameter estimation), Eq. (5), Table 1, Fig. 6; cf. Section 4.3, Table 2, Fig. 7]
"In a consecutive step, we will use the age-structured SI model (5) to predict the age distribution of dengue cases. For that purpose we need to identify the parameters c := (θ0, θ1, xp, σ) shaping the transmission rate θ, as well as the rate of loss of immunity γ > 0. We estimate these model parameters, such that the model solution w and the observed data agree in the least-squared sense: min_{(c,γ)∈R4×R+} ‖w − data‖2."
The 'predicted' age distribution is the direct object of the least-squares objective: the parameters c and γ are chosen to minimize ‖w − data‖². The subsequent agreement between w and the Semarang data (L2 error 135.55 for SI, 128.48 for SIR) is the minimized in-sample residual, not an independent prediction. The same six-year averaged data are used both to identify all five parameters and to 'validate' the model; no held-out data or out-of-sample test is performed. Thus the empirical validation claim reduces by construction to the fitting procedure. The mathematical theorems in Section 3 remain self-contained, but the applied validation is a fitted input presented as a prediction.
full rationale
The mathematical core (Sections 3.1–3.2) is self-contained: Lemmas 4, 5, 8 and 9 provide the estimates that yield Theorem 6 (existence and uniqueness of Q*) and Theorem 10 (local convergence of the fixed-point iteration), using only the stated assumptions on θ, p, and γ. There is no self-citation chain or imported uniqueness theorem; references [5]–[13] are background, not load-bearing, and no claim rests on the authors' prior work. The circularity is confined to the empirical section. Section 4.2 explicitly says it will 'predict' the age distribution and then identifies c and γ by minimizing the squared distance between w and the Semarang data. Figures 6–7 and Tables 1–2 then report the minimized residual as agreement and validation. That is an in-sample fit: the observed data are the fitting target, so the reported L2 errors are forced by construction rather than independent predictions. This matches the fitted-input-called-prediction pattern. A separate limitation, not itself circularity, is the identification of the equilibrium infected stock w(x)p(x) with annual hospitalized-case incidence without a hospitalization or reporting rate; this can bias the fitted parameters but is an empirical misspecification concern, not a circular derivation. Overall score 6 because the central analytical derivations are independent, but the empirical validation claim partially reduces to the fitting procedure.
Assumptions & free parameters
free parameters (6)
- theta0 =
0.1821 (average 2009-2014; per-year 0.0919 to 0.2226)
- theta1 =
2.1135 (average 2009-2014)
- xp =
-0.5209 (average; range -11.42 to 5.07 across years)
- sigma (labeled alpha in Table 1) =
10.3164 (average 2009-2014)
- gamma =
0.6412 (average 2009-2014)
- k0, k1, k2 =
0.0181*N, 0.0984, 55.3
assumptions (7)
- domain assumption Host population is at a stationary age distribution p(x) with constant total population N.
- domain assumption Vector population is eliminated by quasi-steady-state with J/rho much less than 1, giving v* approximately (lambda/rho^2)J.
- domain assumption No vertical transmission; all newborns are susceptible.
- ad hoc to paper Transmission rate has the parametric form theta(x) = theta0 + theta1 exp(-(x-xp)^2/(2 sigma^2)).
- domain assumption Infected hosts lose immunity at a uniform rate gamma independent of age.
- domain assumption Hospitalized hosts are isolated, so vector transmission from them is negligible (sigma(y) approximately 0).
- domain assumption Stationary prevalence can be compared directly to annual hospitalized incidence.
Cite this review
Pith. "Pith review of An Age-Dependent Model for Dengue Transmission: Analysis and Comparison to Field Data from Semarang, Indonesia." pith.science (2026). https://pith.science/paper/GAT5HQJK
@misc{pith2026190809256,
  author       = {Pith},
  title        = {Pith review of: An Age-Dependent Model for Dengue Transmission: Analysis and Comparison to Field Data from Semarang, Indonesia},
  year         = {2026},
  howpublished = {\url{https://pith.science/paper/GAT5HQJK}},
  note         = {Machine review of arXiv:1908.09256}
}
read the original abstract
Medical statistics reveal a significant dependence of hospitalized dengue patient on the patient's age. To incorporate an age-dependence into a mathematical model, we extend the classical ODE system of disease dynamics to a PDE system. The equilibrium distribution is then determined by the fixed points of resulting integro-differential equations. In this paper we use an extension of the concept of the basic reproductive number to characterize parameter regimes, where either only the disease-free or an endemic equilibrium exists. Using rather general and minimal assumptions on the population distribution and on the age-dependent transmission rate, we prove the existence of those equilibria. Furthermore, we are able to prove the convergence of an iteration scheme to compute the endemic equilibrium. To validate our model, we use existing data from the city of Semarang, Indonesia for comparison and to identify the model parameters.
Figures

Figures from the paper (4 more)


Reference graph
Works this paper leans on
-
[1]
A. Coale, Growth and Structure of Human Populations: A Ma thematical Investigation, Princeton University Press, 1972
work page 1972
-
[2]
F. Hoppenstaedt, Mathematical Theories of Populations , Society for Industrial and Applied Mathematics, 1975
work page 1975
- [3]
-
[4]
J. Metz, O. Diekmann, The Dynamics of Physiologically St ructured Populations, Springer Verlag, 1986
work page 1986
-
[5]
C. de Le´ on, L. Esteva, A. Korobeinikov, Age-dependency in host-vector models - The global analysis., Applied Mathematics and Computation 243 (2014) 969–981
work page 2014
-
[6]
K. Rock, D. W ood, M. Keeling, Age- and bite-structured mo dels for vector-borne diseases, Epidemics 12 (2015) 20–29
work page 2015
- [7]
-
[8]
S. Busenberg, K. Cooke, M. Iannelli, Endemic Thresholds and Stability in a Class of Age- Structured Epidemics, SIAM Journal on Applied Mathematics 48 (6) (1988) 1379–1395
work page 1988
Show all 18 references
-
[9]
Inaba, Threshold and stability results for an age-str uctured epidemic model, Journal of Mathematical Biology 28 (4) (1990) 1–25
H. Inaba, Threshold and stability results for an age-str uctured epidemic model, Journal of Mathematical Biology 28 (4) (1990) 1–25. 16 AGE–DEPENDENT DENGUE MODEL: ANALYSIS AND COMPARISON TO F IELD DATA
1990
-
[10]
Iannelli, F
M. Iannelli, F. Milner, A. Pugliese, Analytical and Num erical Results for the Age-Structured S-I-S Epidemic Model with Mixed Inter-Intracohort Transmi ssion, SIAM Journal on Mathe- matical Analysis 23 (3) (1992) 662–688
1992
-
[11]
Capasso, Mathematical structures of epidemic syste ms, Springer Verlag, 1993
V. Capasso, Mathematical structures of epidemic syste ms, Springer Verlag, 1993
1993
-
[12]
Inaba, H
H. Inaba, H. Sekine, A mathematical model for Chagas dis ease with infection-age-dependent infectivity, Mathematical Biosciences 190 (1) (2004) 39–6 9
2004
-
[13]
Franceschetti, A
A. Franceschetti, A. Pugliese, Threshold behaviour of a SIR epidemic model with age struc- ture and immigration., Journal of Mathematical Biology 57 ( 1) (2008) 1–27
2008
-
[14]
C. o. S. Health Office (Dinas Kesehatan), Dengue statisti cs, Private Communication (2014)
2014
-
[15]
Esteva, C
L. Esteva, C. Vargas, Analysis of a dengue disease trans mission model, Mathematical Bio- sciences 150 (2) (1998) 131–151
1998
-
[16]
A. Jain, U. Chaturvedi, Dengue in infants: an overview, FEMS Immunology & Medical Microbiology 59 (2) (2010) 119–130
2010
-
[17]
de Jong, M.C.M .and Diekmann, H
O. de Jong, M.C.M .and Diekmann, H. Heesterbeek, How doe s transmission of infection depend on population size?, in: D. Mollison (Ed.), Epidemic Models Their Structure and Relation to Data, The Newton Institute, Cambridge, 1995, pp . 84–94
1995
-
[18]
Pyramid.net
P. Pyramid.net. Population pyramid indonesia 2016 [on line] (2019) [cited 18.06.2019]
2019
Reviewed August 14, 2026 · model on record in the stance chip above.
Discussion (0). Continue with ORCID to comment.