REVIEW 4 major objections 5 minor 74 references
Structural and Stellar Population Properties vs. Bulge Types in Sloan Digital Sky Survey Central Galaxies
T0 review · 4 major / 5 minor · reviewed 2026-08-14 · deepseek-v4-flash
Pith's one-line read A single density number — the stellar mass within the central 1 kpc — orders galaxy bulges into the same classes that detailed bulge-disk decomposition does.
desk verdict Solid mapping of bulge classes onto the known ΔΣ1 elbow, but the ΔΣ1 zero-point calibration deserves a skeptical look before trusting exact P/C fractions. read the letter →
The pith
A machine-rendered reading of the paper's core claim, the machinery that carries it, and where it could break.
The reading
What carries the argument
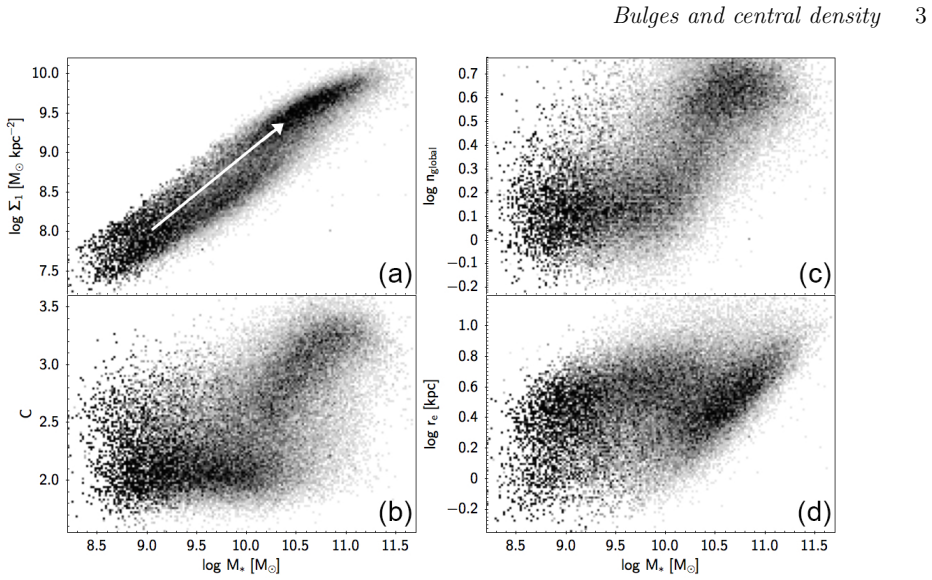
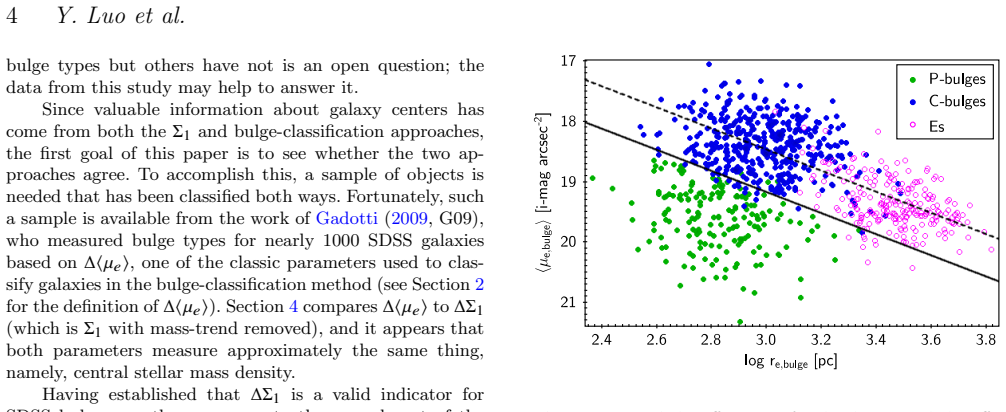
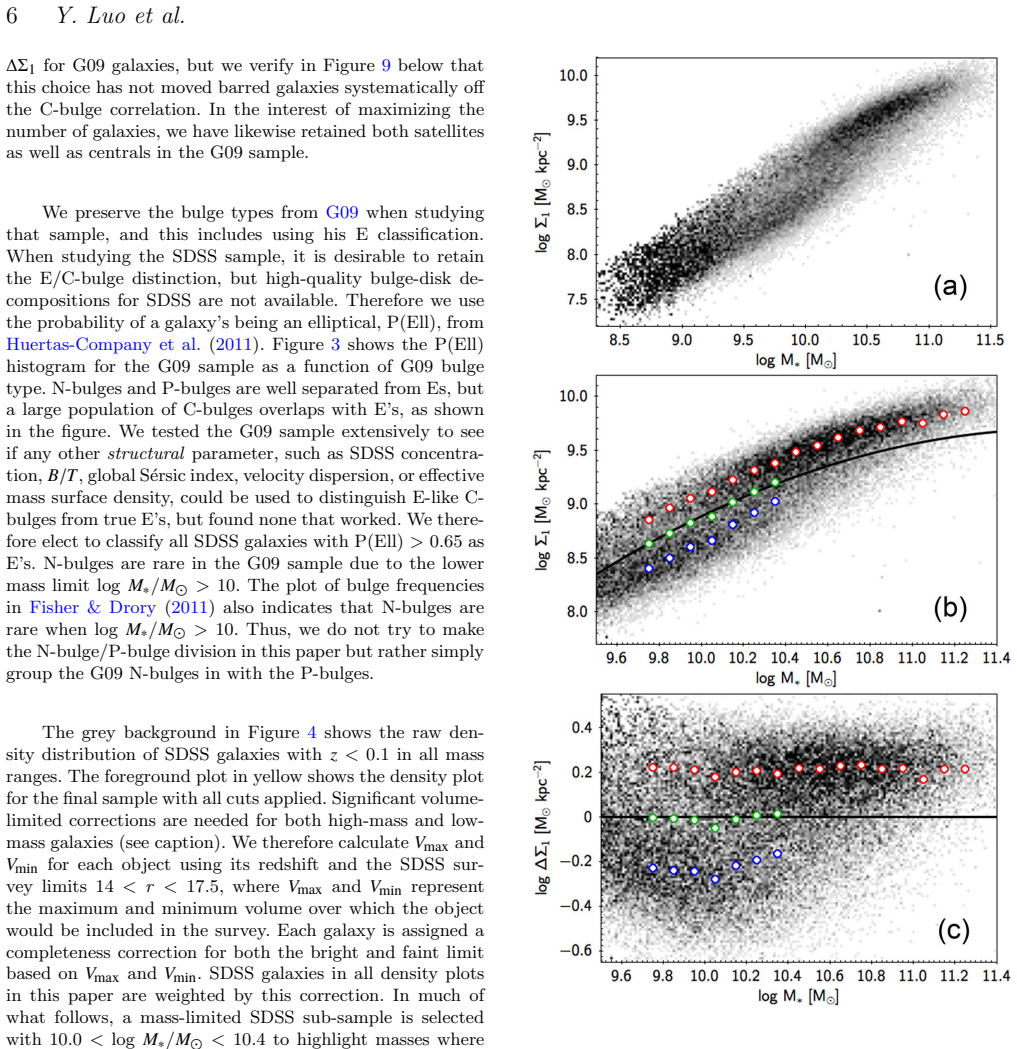
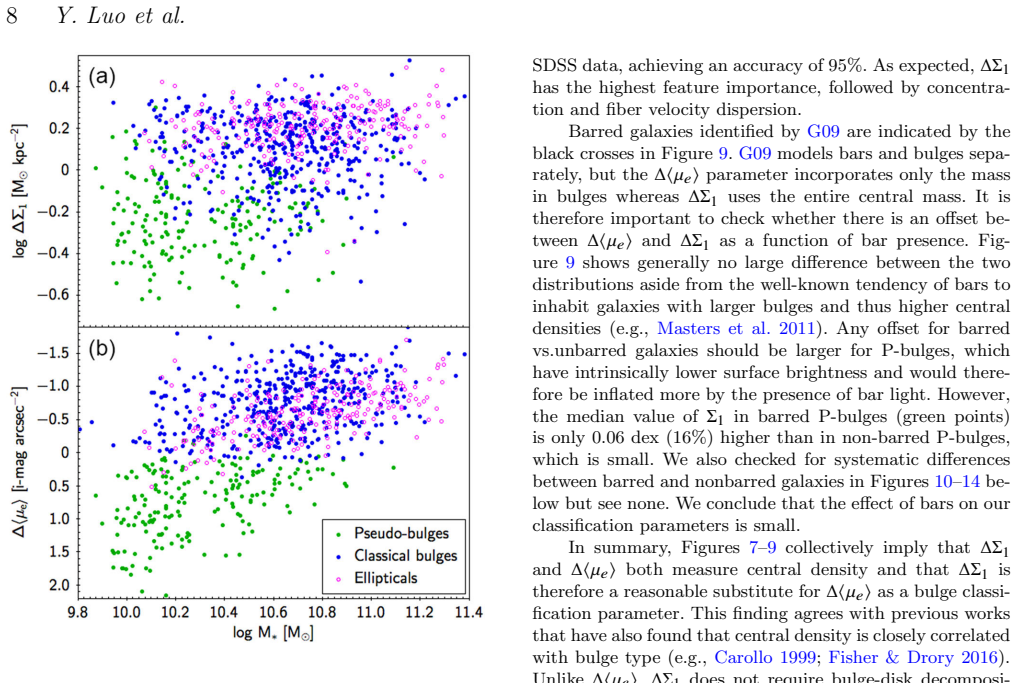
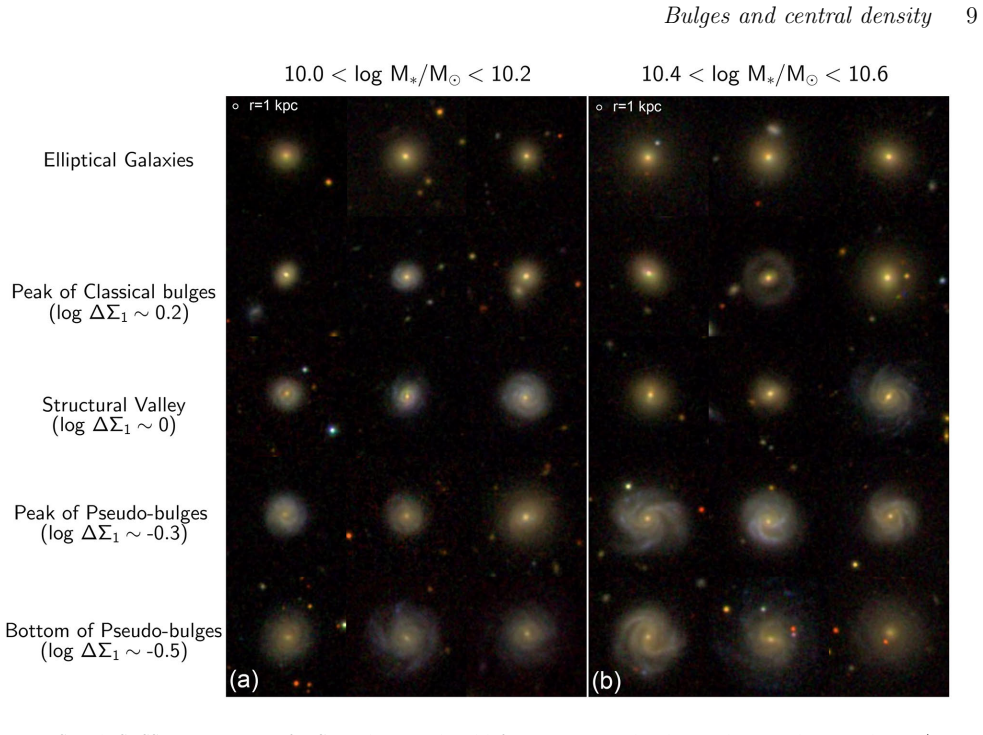
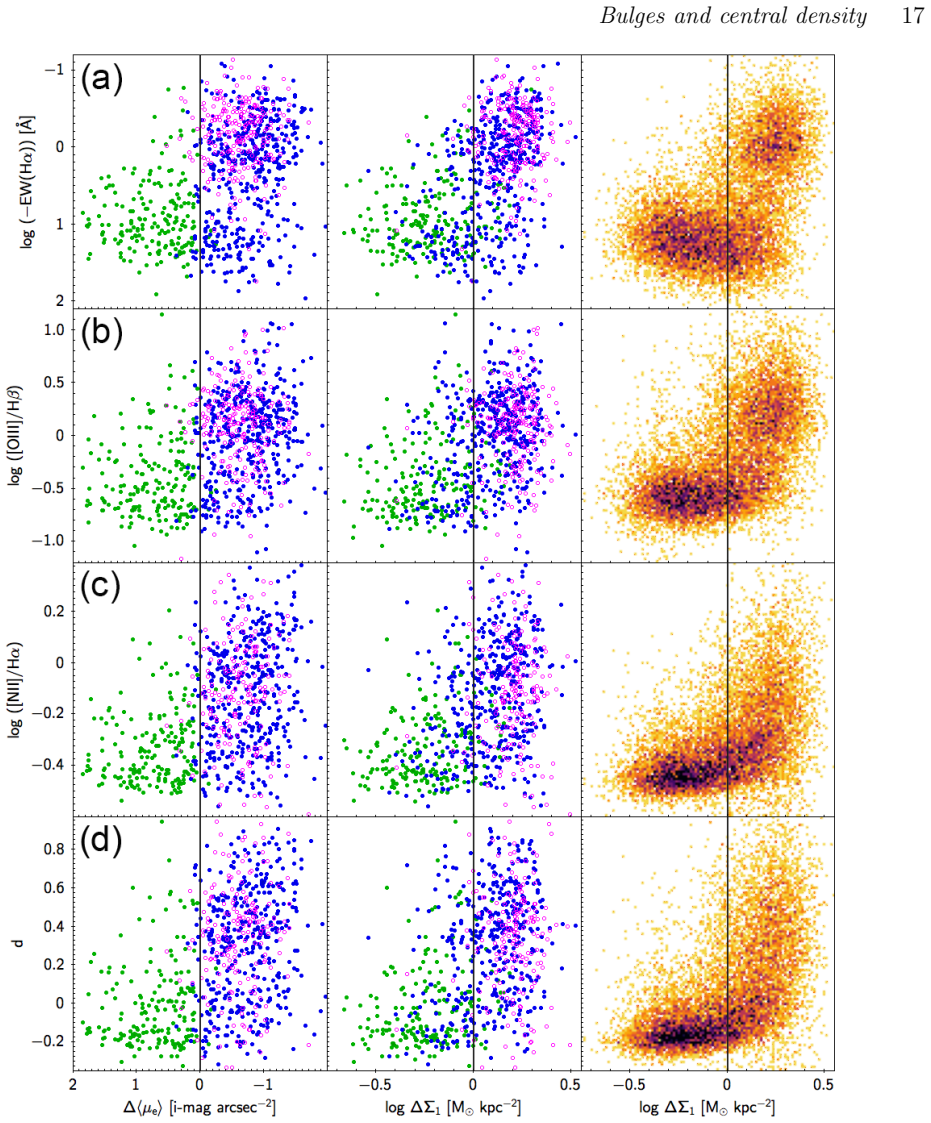
The load-bearing object is $\Delta\Sigma_1$, the residual of the log central stellar-mass surface density within 1 kpc after removing the mass trend defined by the structural valley in the $\Sigma_1$–$M_*$ plane. $\Sigma_1$ had been used before as an evolutionary clock; the new step is to test it as a bulge-type classifier and map traditional bulge classes onto it. The comparison line is $\Delta\langle\mu_e\rangle$, the residual from the Kormendy relation used by Gadotti (2009) to separate pseudo-bulges from classical bulges. Because $\Delta\Sigma_1$ requires only aperture photometry and no decomposition, it carries the statistical program: it lets the authors push bulge studies from a few hundred decomposed galaxies to roughly 12,000 SDSS centrals, with a boundary at $\Delta\Sigma_1=0$ dividing the two structural clouds.
What would settle it
Take a sample of SDSS galaxies with both $\Delta\Sigma_1$ and bulge-disk decompositions across a wider mass range and check whether the residual scatter between the two indicators disappears once the mass trend is removed from $\Delta\langle\mu_e\rangle$; if it does not, the $\Delta\Sigma_1=0$ boundary misclassifies a mass- and radius-dependent fraction of bulges, and the claimed universality of star-forming pseudo-bulges would fail in proportion.
Extended reading notes
Core claim
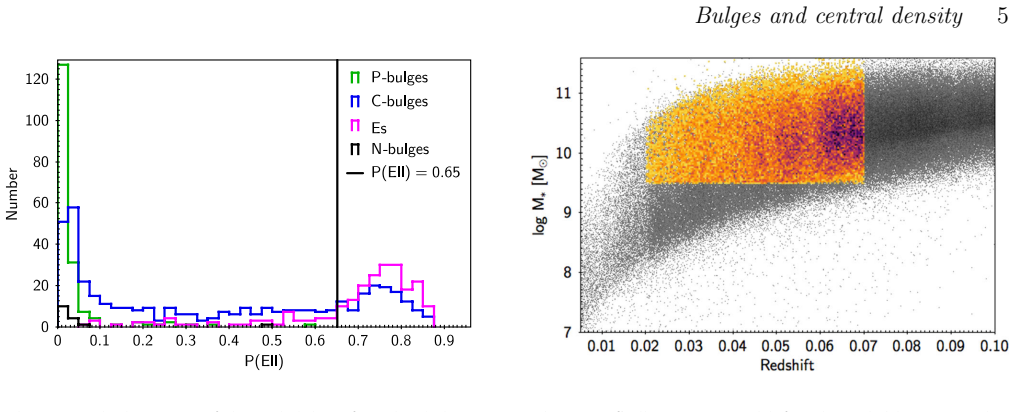
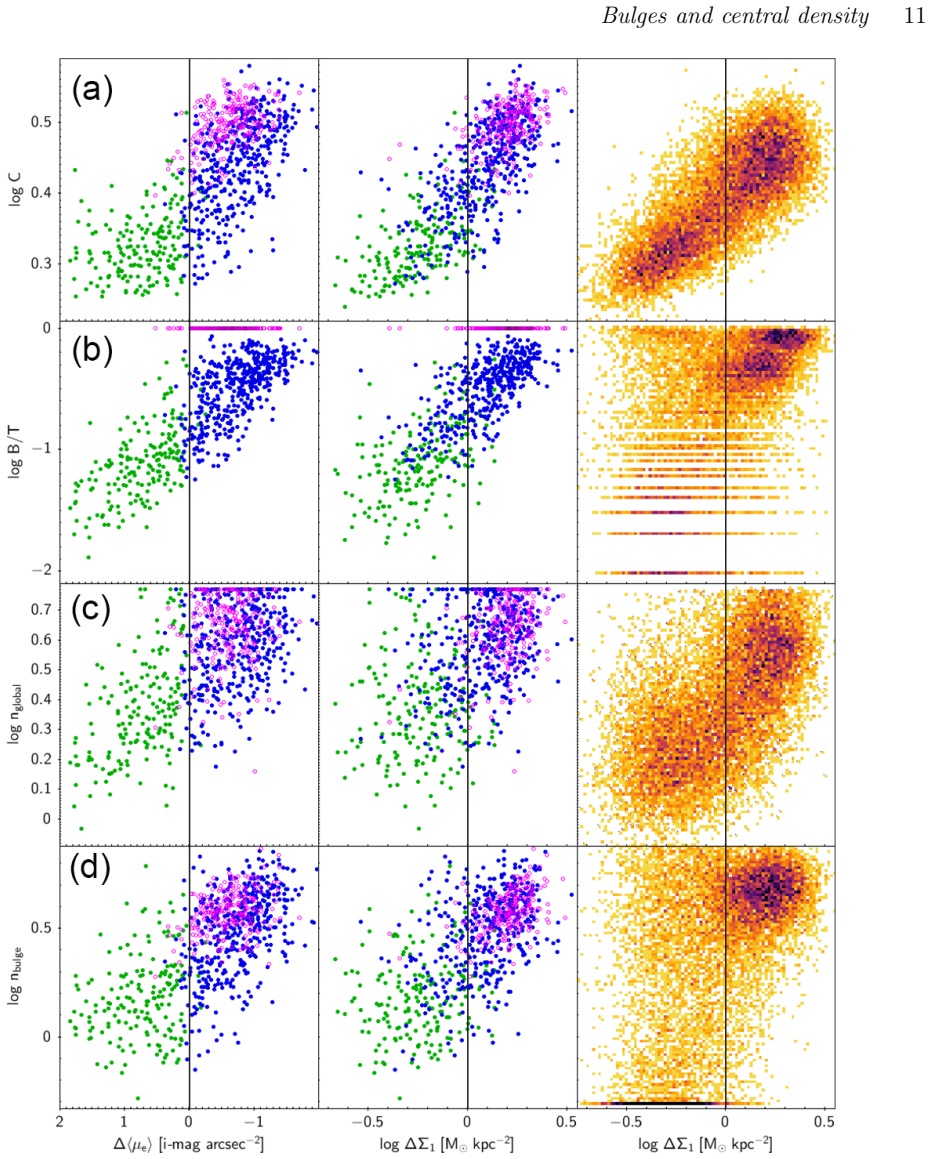
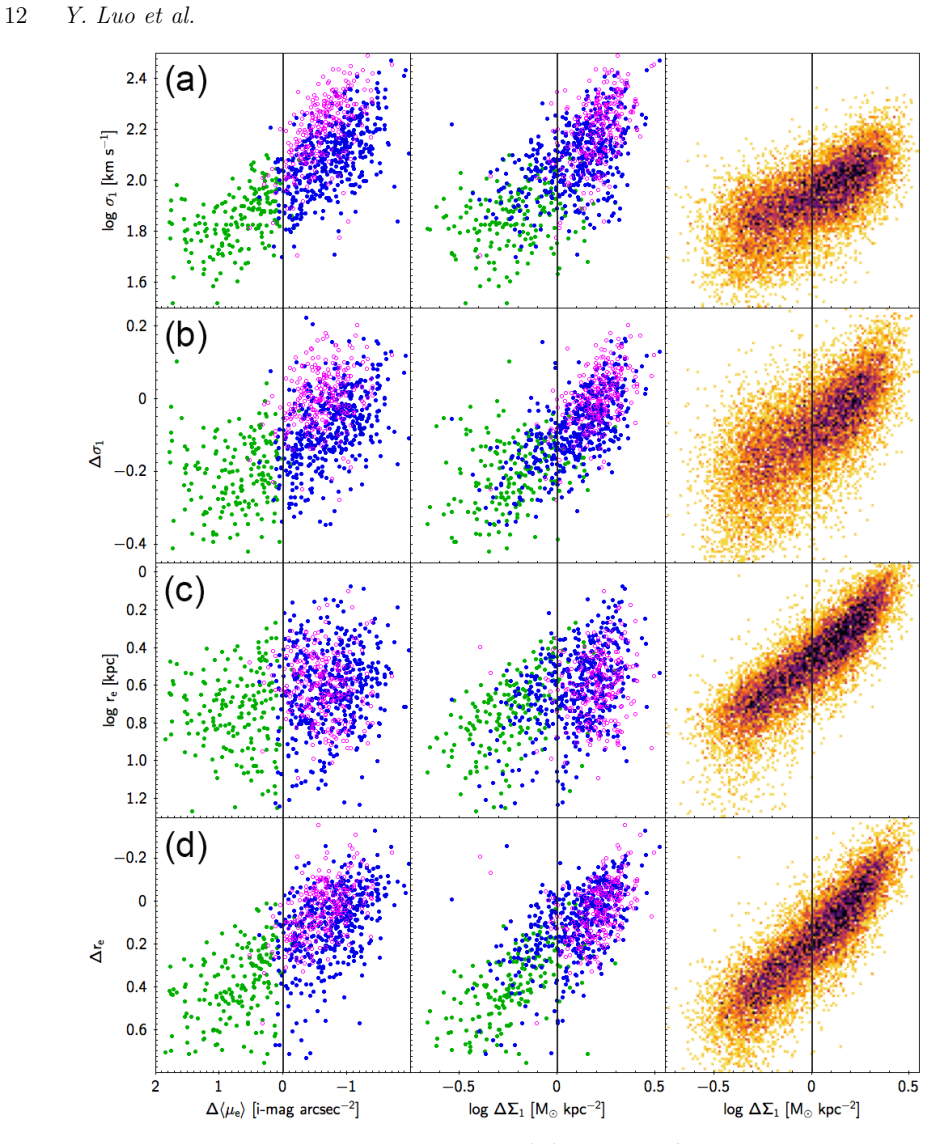
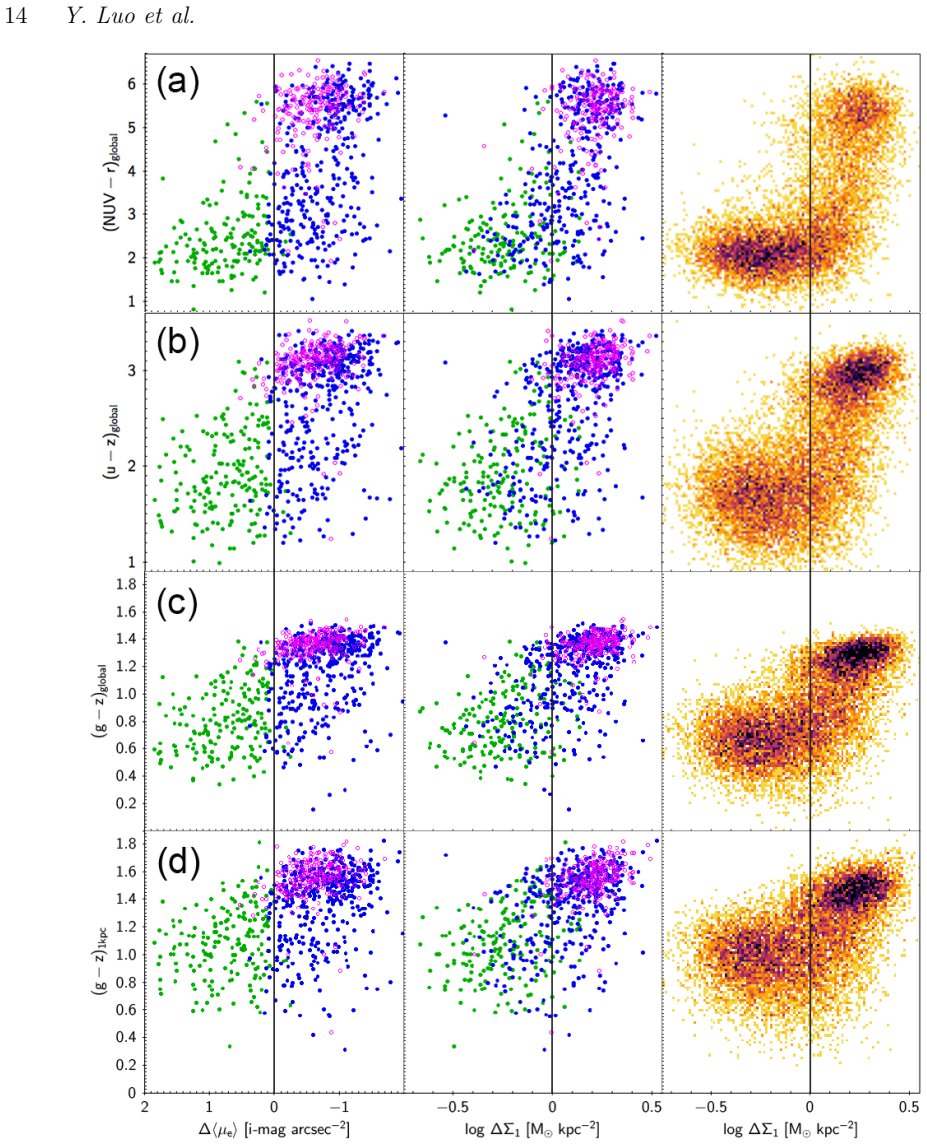
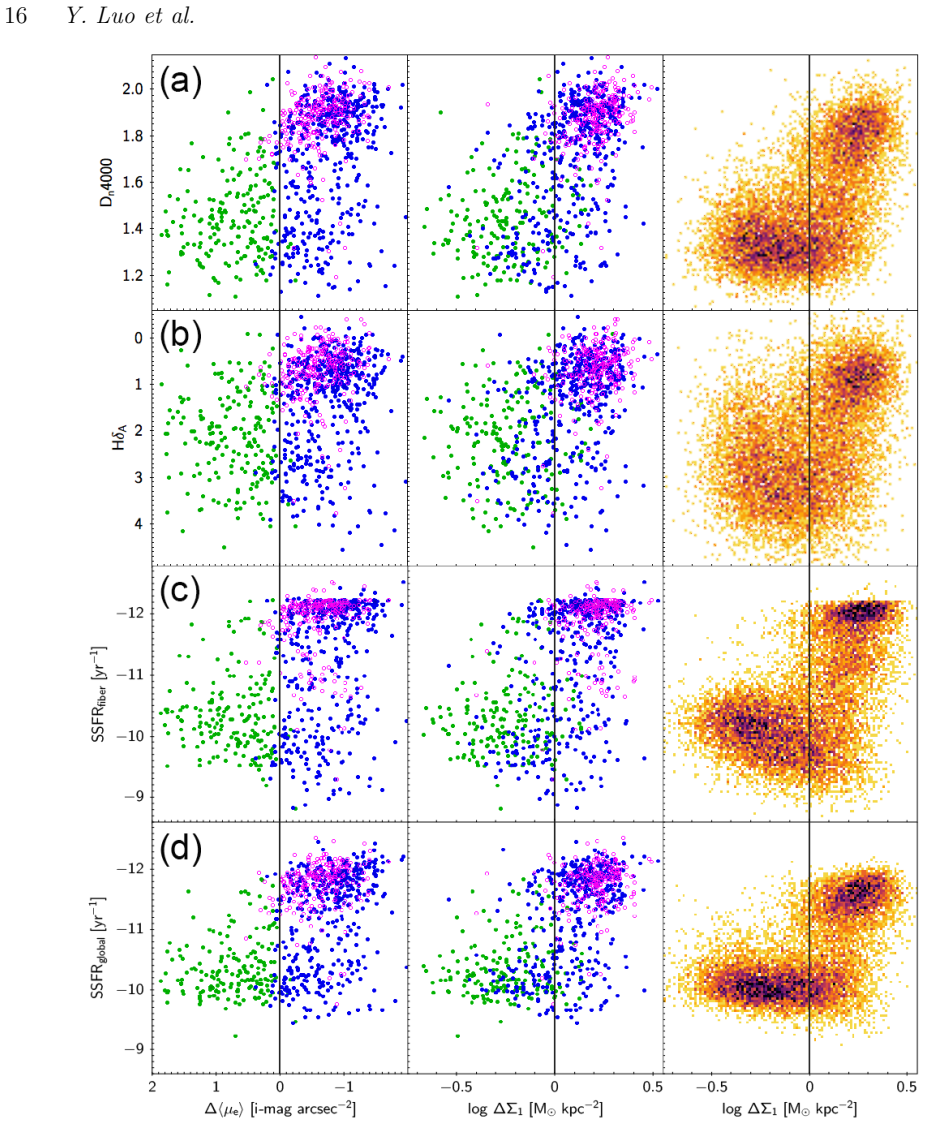
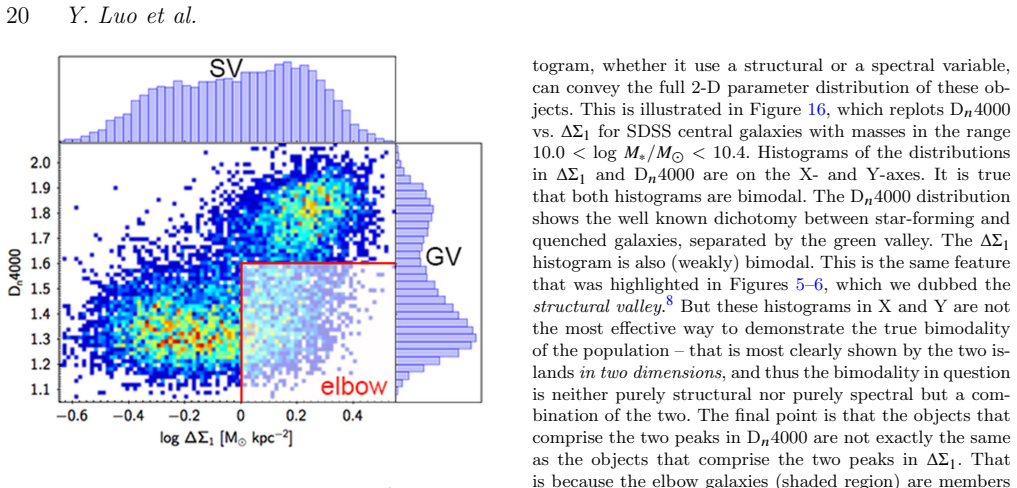
The paper's central claim is that $\Delta\Sigma_1$, defined as the residual of $\log\Sigma_1$ after removing a quadratic trend with stellar mass, measures the same underlying quantity as the classical bulge-type parameter $\Delta\langle\mu_e\rangle$ — central stellar density — and can therefore be used as a bulge classifier for SDSS central galaxies out to $z=0.07$ without bulge-disk decomposition. Classifying by $\Delta\Sigma_1$ reproduces the Gadotti (2009) pseudo-bulge/classical-bulge split well enough that the two approaches measure approximately the same thing. Mapped onto twenty properties, the distribution is linear in log-log space for structural parameters but sharply elbow-shaped for star-formation and stellar-age indicators: specific star-formation rate stays roughly flat as central density rises, then falls steeply at the elbow. In the mass-limited sample, galaxies with $\Delta\Sigma_1<0$ (pseudo-bulges) are all star-forming, while galaxies with $\Delta\Sigma_1>0$ (classical bulges) mix quenched and actively star-forming systems — a subclass the authors name star-forming classical bulges (C-SFBs). The paper concludes that structural and stellar-population evolution decouple near quenching, and that bulge type is best seen as a two-dimensional structural and spectral property rather than a single number.
Load-bearing premise
The claim rests on the assumption that the single measured number, central stellar density within 1 kpc relative to the mass trend, truly separates pseudo-bulges from classical bulges in the same way that the established decomposition-based indicator does, even though the two agree only approximately and the differences track galaxy mass and radius.
Editorial extensions
If this is right
- Galaxy bulges can be classified in SDSS-quality imaging by a single aperture-density measurement, extending bulge-type studies to $z=0.07$ and to tens of thousands of galaxies instead of the few hundred with careful decompositions.
- Pseudo-bulges in this mass range form a homogeneous, universally star-forming population, so a low $\Delta\Sigma_1$ value is a reliable sign of an actively star-forming bulge.
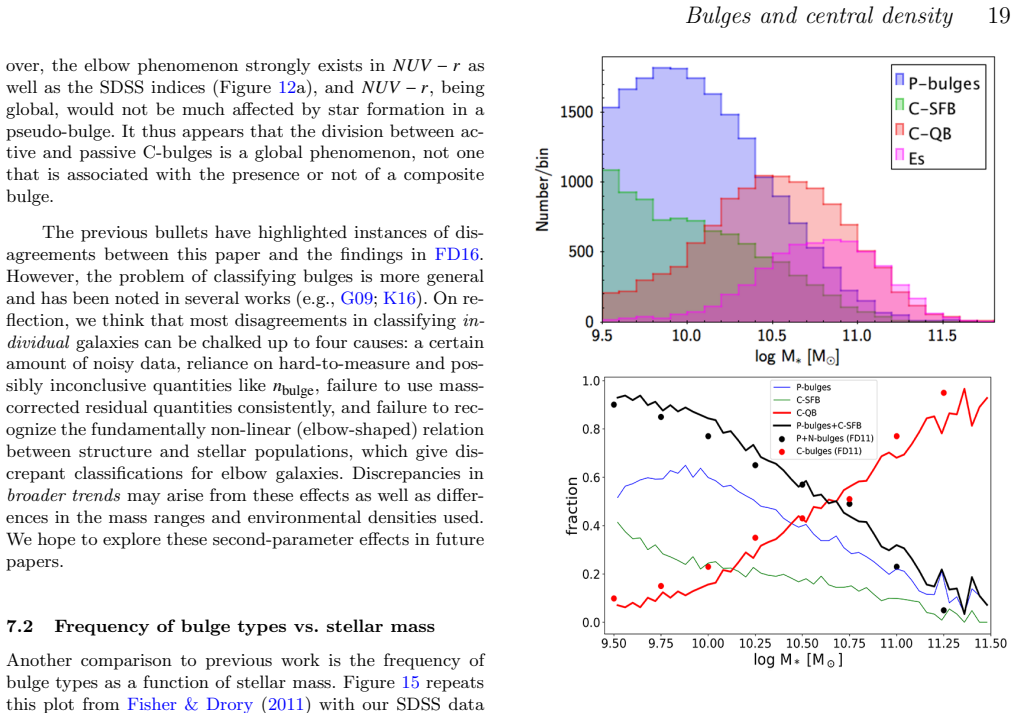
- Classical bulges are heterogeneous: in the mass-limited SDSS sample, 42% of central C-bulges are blue and star-forming (C-SFBs), which explains why classifications based on structure alone and on stellar population alone have disagreed.
- The elbow shape implies that central density grows before star formation fades, and the elbow marks where quenching begins; galaxies there are candidates for being caught in the act of quenching.
- If the local mapping is universal, deep surveys at $z\sim3$ should already show the same elbow pattern with star-forming classical bulges on the horizontal branch, which can be checked with existing high-redshift data.
Reading between the lines
- Beyond the paper's mass-limited sample, a testable prediction is that the fraction of star-forming classical bulges peaks near the knee of the elbow in specific star-formation rate, so bulge demographics in deeper surveys should show C-SFBs as a redshift-dependent population rather than a static class.
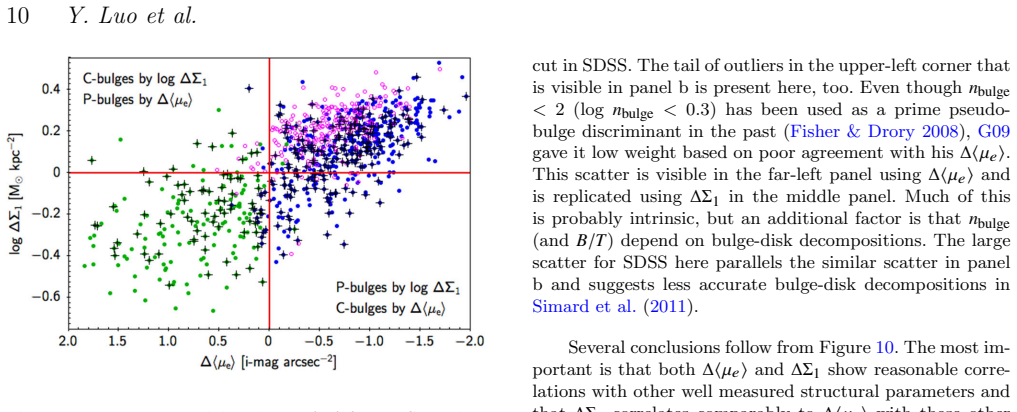
- The residual trends between $\Delta\Sigma_1$ and $\Delta\langle\mu_e\rangle$ with galaxy radius and mass suggest that the $\Delta\Sigma_1=0$ boundary may need recalibration outside $10.0<\log M_*/M_\odot<10.4$, where the low-density population becomes sparse; one could define the boundary as a function of mass and radius.
- If the elbow is fundamental, bulge classification should be treated as a two-dimensional coordinate in a structure–star-formation plane; then 'pseudo-bulge' and 'classical bulge' become regions, and the elbow population (C-SFBs) is a natural third region, not a contradiction.
- The paper's reframing of bimodality suggests that the 'structural valley' and the 'green valley' are different divisions made by different objects; testing this with spatially resolved IFU data could reveal whether elbow galaxies have young central stars or just dusty centers.
Editorial analysis
A structured set of objections, weighed in public.
Referee Report
Summary. The paper introduces ΔΣ1, a mass-trend-removed central stellar-mass surface density within 1 kpc, as a practical bulge-type indicator for SDSS central galaxies. It calibrates ΔΣ1 by fitting the structural valley in the Σ1–M* plane, validates it against Gadotti (2009) using Δ⟨μe⟩, and then maps the resulting P-bulge/C-bulge classification onto twenty structural and stellar-population properties for a mass-limited sample of about 12,000 galaxies. The central claims are that ΔΣ1 and Δ⟨μe⟩ measure the same central-density quantity, that P-bulges occupy the low-density horizontal arm of a strongly non-linear 'elbow' and are universally star-forming, and that C-bulges occupy the elbow and vertical branch with a wide range of star-formation rates, thereby explaining past classification disagreements. The paper also interprets the elbow as evidence that central structure and stellar populations evolve differently during quenching.
Significance. If the calibration is sound, the paper is significant for three reasons: it provides a bulge-type indicator that avoids bulge-disk decomposition and works to z=0.07 in SDSS, it offers a large homogeneous mapping of bulge classes onto many independent galaxy properties, and it proposes an explanation for historical classification discrepancies in terms of the elbow-shaped structure–star-formation relation. The paper also ships a public Σ1 catalog, which is a useful community resource. The external comparison with Gadotti (2009) is the right kind of validation, and the consistency with earlier Σ1-based results from Fang et al. (2013) and Barro et al. (2017) lends credibility to the elbow pattern. However, the central classification boundary is calibrated on the same sample that is later classified, and the external validation shows mass- and radius-dependent residuals; the robustness of the reported P-bulge/C-bulge fractions therefore remains the main open question.
major comments (4)
- [Section 3 (Eq. 2) and Section 7.1]
- [Section 3 (Fig. 6)]
- [Section 4 (Figs. 7–9)]
- [Section 5 (Figs. 10b and 10d)]
minor comments (5)
- [Abstract and Section 7.1]
- [Section 2, Table 1]
- [Section 4 (Fig. 9)]
- [Section 6, footnote 7]
- [Section 7.1]
Circularity Check
No significant circularity: ΔΣ1 is calibrated from structural bimodality and validated against the external G09 catalog, and the P/C–star-formation elbow is an empirical correlation rather than a reduction to the calibration.
full rationale
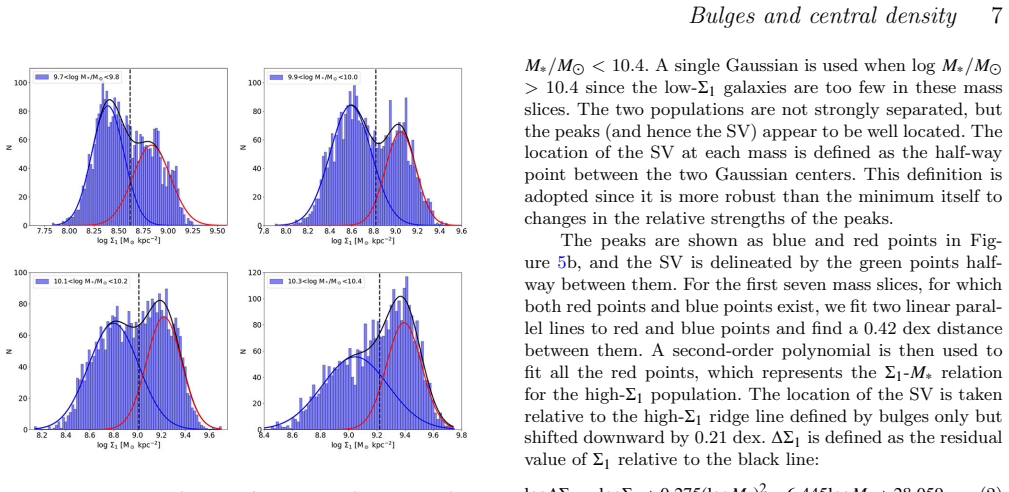
The derivation chain is not circular. ΔΣ1 is defined in Eq. (2) from the structural valley (SV) in the Σ1–M* plane, which is located by double-Gaussian fits to the distribution of central stellar-mass surface density (Section 3, Figures 5–6). The SV and the ΔΣ1=0 boundary are determined purely from structure, not from star-formation rates or bulge-type labels, so the later finding that galaxies with ΔΣ1<0 are star-forming is an independent empirical correlation, not a tautology. The P-bulge/C-bulge mapping is explicitly validated against the external Gadotti (2009) sample using the independent bulge indicator Δ⟨μe⟩ (Section 4, Figures 7–9), and the comparison shows approximate agreement. The residual trends with mass and radius in Figure 9 are a validation weakness, but the paper does not redefine ΔΣ1 to force agreement with G09; it asserts, without demonstration, that removing the mass trend from Δ⟨μe⟩ would tighten the relation, which is a missing support rather than a circular step. The elbow-shaped relation between central density and star-formation rate was published earlier by Fang et al. (2013) and Barro et al. (2017), whose author lists overlap with the present paper, but the present paper's contribution is the mapping of bulge classes onto that elbow, and this mapping is checked against the external G09 classifications rather than derived from the self-citations. No fitted parameter is renamed as a prediction, and no equation is defined in terms of the quantities it is used to explain. The statements that P-bulges are universally star-forming and that C-bulges span a wide range of star-formation rates are data descriptions from independent spectral indices, not consequences of the ΔΣ1 definition.
Assumptions & free parameters
free parameters (6)
- ΔΣ1 mass-trend polynomial coefficients =
0.275, -6.445, 28.059 in Eq. (2)
- Structural valley offset from high-Σ1 ridgeline =
0.21 dex (half of 0.42 dex separation of double-Gaussian peaks)
- Δσ1 mass-trend coefficients =
slope 0.338, intercept 1.430
- Δre mass-trend coefficients =
slope 0.535, intercept 5.175
- P(Ell) elliptical threshold =
0.65
- Dn4000 red/blue division =
1.6
assumptions (6)
- domain assumption Gadotti (2009) Δ⟨μe⟩ classifications are a valid reference for bulge type.
- domain assumption Σ1 measured from SDSS aperture photometry with M/Li from Fang et al. (2013) traces stellar mass surface density within 1 kpc.
- domain assumption The high-Σ1 ridgeline in the Σ1-M* plane is an approximate evolutionary track.
- ad hoc to paper The structural valley defined by double-Gaussian fits separates two real populations.
- domain assumption Cosmology H0=70, Ωm=0.3, ΩΛ=0.7 and standard K-corrections are adopted.
- domain assumption Huertas-Company et al. P(Ell) probabilities correctly identify ellipticals in SDSS.
Cite this review
Pith. "Pith review of Structural and Stellar Population Properties vs. Bulge Types in Sloan Digital Sky Survey Central Galaxies." pith.science (2026). https://pith.science/paper/GEMRJ6LJ
@misc{pith2026190808055,
  author       = {Pith},
  title        = {Pith review of: Structural and Stellar Population Properties vs. Bulge Types in Sloan Digital Sky Survey Central Galaxies},
  year         = {2026},
  howpublished = {\url{https://pith.science/paper/GEMRJ6LJ}},
  note         = {Machine review of arXiv:1908.08055}
}
abstract
This paper studies pseudo-bulges (P-bulges) and classical bulges (C-bulges) in Sloan Digital Sky Survey central galaxies using the new bulge indicator $\Delta\Sigma_1$, which measures relative central stellar-mass surface density within 1 kpc. We compare $\Delta\Sigma_1$ to the established bulge-type indicator $\Delta\langle\mu_e\rangle$ from Gadotti (2009) and show that classifying by $\Delta\Sigma_1$ agrees well with $\Delta\langle\mu_e\rangle$. $\Delta\Sigma_1$ requires no bulge-disk decomposition and can be measured on SDSS images out to $z = 0.07$. Bulge types using it are mapped onto twenty different structural and stellar-population properties for 12,000 SDSS central galaxies with masses 10.0 < log $M_*$/$M_{\odot}$ < 10.4. New trends emerge from this large sample. Structural parameters show fairly linear log-log relations vs. $\Delta\Sigma_1$ and $\Delta\langle\mu_e\rangle$ with only moderate scatter, while stellar-population parameters show a highly non-linear "elbow" in which specific star-formation rate remains roughly flat with increasing central density and then falls rapidly at the elbow, where galaxies begin to quench. P-bulges occupy the low-density end of the horizontal arm of the elbow and are universally star-forming, while C-bulges occupy the elbow and the vertical branch and exhibit a wide range of star-formation rates at fixed density. The non-linear relation between central density and star-formation rate has been seen before, but this mapping onto bulge class is new. The wide range of star-formation rates in C-bulges helps to explain why bulge classifications using different parameters have sometimes disagreed in the past. The elbow-shaped relation between density and stellar indices suggests that central structure and stellar-populations evolve at different rates as galaxies begin to quench.
Figures
Figures from the paper (12 more)
Reference graph
Works this paper leans on
-
[1]
Abazajian K. N., et al., 2009, @doi [ ] 10.1088/0067-0049/182/2/543 , https://ui.adsabs.harvard.edu/abs/2009ApJS..182..543A 182, 543
-
[2]
Adelman-McCarthy J. K., et al., 2008, @doi [ ] 10.1086/524984 , https://ui.adsabs.harvard.edu/abs/2008ApJS..175..297A 175, 297
doi:10.1086/524984 2008
-
[5]
Ball N. M., Loveday J., Brunner R. J., 2008, @doi [ ] 10.1111/j.1365-2966.2007.12627.x , https://ui.adsabs.harvard.edu/abs/2008MNRAS.383..907B 383, 907
arXiv 2008
-
[6]
Barro G., et al., 2013, @doi [ ] 10.1088/0004-637X/765/2/104 , https://ui.adsabs.harvard.edu/abs/2013ApJ...765..104B 765, 104
-
[7]
Barro G., et al., 2017, @doi [ ] 10.3847/1538-4357/aa6b05 , https://ui.adsabs.harvard.edu/abs/2017ApJ...840...47B 840, 47
-
[8]
F., 2008, @doi [ ] 10.1086/589551 , https://ui.adsabs.harvard.edu/abs/2008ApJ...682..355B 682, 355
Bell E. F., 2008, @doi [ ] 10.1086/589551 , https://ui.adsabs.harvard.edu/abs/2008ApJ...682..355B 682, 355
doi:10.1086/589551 2008
-
[9]
Bell E. F., et al., 2004, @doi [ ] 10.1086/420778 , https://ui.adsabs.harvard.edu/abs/2004ApJ...608..752B 608, 752
doi:10.1086/420778 2004
-
[10]
Blanton M. R., Moustakas J., 2009, @doi [ ] 10.1146/annurev-astro-082708-101734 , https://ui.adsabs.harvard.edu/abs/2009ARA&A..47..159B 47, 159
Show all 74 references
-
[11]
R., Roweis S., 2007, @doi [ ] 10.1086/510127 , https://ui.adsabs.harvard.edu/abs/2007AJ....133..734B 133, 734
Blanton M. R., Roweis S., 2007, @doi [ ] 10.1086/510127 , https://ui.adsabs.harvard.edu/abs/2007AJ....133..734B 133, 734
2007 doi
-
[12]
R., et al., 2003, @doi [ ] 10.1086/342935 , https://ui.adsabs.harvard.edu/abs/2003AJ....125.2348B 125, 2348
Blanton M. R., et al., 2003, @doi [ ] 10.1086/342935 , https://ui.adsabs.harvard.edu/abs/2003AJ....125.2348B 125, 2348
2003 doi
-
[13]
R., et al., 2005, @doi [ ] 10.1086/429803 , https://ui.adsabs.harvard.edu/abs/2005AJ....129.2562B 129, 2562
Blanton M. R., et al., 2005, @doi [ ] 10.1086/429803 , https://ui.adsabs.harvard.edu/abs/2005AJ....129.2562B 129, 2562
2005 doi
-
[14]
B., et al., 2009, @doi [ ] 10.1088/0004-637X/706/1/L173 , https://ui.adsabs.harvard.edu/abs/2009ApJ...706L.173B 706, L173
Brammer G. B., et al., 2009, @doi [ ] 10.1088/0004-637X/706/1/L173 , https://ui.adsabs.harvard.edu/abs/2009ApJ...706L.173B 706, L173
2009 doi
-
[15]
B., et al., 2011, @doi [ ] 10.1088/0004-637X/739/1/24 , https://ui.adsabs.harvard.edu/abs/2011ApJ...739...24B 739, 24
Brammer G. B., et al., 2011, @doi [ ] 10.1088/0004-637X/739/1/24 , https://ui.adsabs.harvard.edu/abs/2011ApJ...739...24B 739, 24
2011 doi
-
[16]
Brinchmann J., Charlot S., White S. D. M., Tremonti C., Kauffmann G., Heckman T., Brinkmann J., 2004, @doi [ ] 10.1111/j.1365-2966.2004.07881.x , https://ui.adsabs.harvard.edu/abs/2004MNRAS.351.1151B 351, 1151
2004
-
[17]
Cappellari M., et al., 2006, @doi [ ] 10.1111/j.1365-2966.2005.09981.x , https://ui.adsabs.harvard.edu/abs/2006MNRAS.366.1126C 366, 1126
2006
-
[18]
M., 1999, @doi [ ] 10.1086/307753 , https://ui.adsabs.harvard.edu/abs/1999ApJ...523..566C 523, 566
Carollo C. M., 1999, @doi [ ] 10.1086/307753 , https://ui.adsabs.harvard.edu/abs/1999ApJ...523..566C 523, 566
1999 doi
-
[19]
Ceverino D., Dekel A., Tweed D., Primack J., 2015, @doi [ ] 10.1093/mnras/stu2694 , https://ui.adsabs.harvard.edu/abs/2015MNRAS.447.3291C 447, 3291
2015 doi
-
[20]
arXiv:1909.10817
Chen Z., et al., 2019, arXiv e-prints, https://ui.adsabs.harvard.edu/abs/2019arXiv190910817C p. arXiv:1909.10817
2019 arXiv
-
[21]
Cheung E., et al., 2012, @doi [ ] 10.1088/0004-637X/760/2/131 , https://ui.adsabs.harvard.edu/abs/2012ApJ...760..131C 760, 131
2012 doi
-
[22]
Dekel A., Sari R., Ceverino D., 2009, @doi [ ] 10.1088/0004-637X/703/1/785 , https://ui.adsabs.harvard.edu/abs/2009ApJ...703..785D 703, 785
2009 doi
-
[23]
E., 1983, @doi [ ] 10.1086/161093 , https://ui.adsabs.harvard.edu/abs/1983ApJ...270....7D 270, 7
Dressler A., Gunn J. E., 1983, @doi [ ] 10.1086/161093 , https://ui.adsabs.harvard.edu/abs/1983ApJ...270....7D 270, 7
1983 doi
-
[24]
P., et al., 2006, @doi [ ] 10.1111/j.1365-2966.2006.10126.x , https://ui.adsabs.harvard.edu/abs/2006MNRAS.368..414D 368, 414
Driver S. P., et al., 2006, @doi [ ] 10.1111/j.1365-2966.2006.10126.x , https://ui.adsabs.harvard.edu/abs/2006MNRAS.368..414D 368, 414
2006
-
[25]
G., Bournaud F., Elmegreen D
Elmegreen B. G., Bournaud F., Elmegreen D. M., 2008, @doi [ ] 10.1086/592190 , https://ui.adsabs.harvard.edu/abs/2008ApJ...688...67E 688, 67
2008 doi
-
[26]
Erwin P., et al., 2015, @doi [ ] 10.1093/mnras/stu2376 , https://ui.adsabs.harvard.edu/abs/2015MNRAS.446.4039E 446, 4039
2015 doi
-
[27]
M., et al., 2007, @doi [ ] 10.1086/519294 , https://ui.adsabs.harvard.edu/abs/2007ApJ...665..265F 665, 265
Faber S. M., et al., 2007, @doi [ ] 10.1086/519294 , https://ui.adsabs.harvard.edu/abs/2007ApJ...665..265F 665, 265
2007 doi
-
[28]
H., Saglia R
Fabricius M. H., Saglia R. P., Fisher D. B., Drory N., Bender R., Hopp U., 2012, @doi [ ] 10.1088/0004-637X/754/1/67 , https://ui.adsabs.harvard.edu/abs/2012ApJ...754...67F 754, 67
2012 doi
-
[29]
J., Faber S
Fang J. J., Faber S. M., Koo D. C., Dekel A., 2013, @doi [ ] 10.1088/0004-637X/776/1/63 , https://ui.adsabs.harvard.edu/abs/2013ApJ...776...63F 776, 63
2013 doi
-
[30]
B., 2006, @doi [ ] 10.1086/504351 , https://ui.adsabs.harvard.edu/abs/2006ApJ...642L..17F 642, L17
Fisher D. B., 2006, @doi [ ] 10.1086/504351 , https://ui.adsabs.harvard.edu/abs/2006ApJ...642L..17F 642, L17
2006 doi
-
[31]
B., Drory N., 2008, @doi [ ] 10.1088/0004-6256/136/2/773 , https://ui.adsabs.harvard.edu/abs/2008AJ....136..773F 136, 773
Fisher D. B., Drory N., 2008, @doi [ ] 10.1088/0004-6256/136/2/773 , https://ui.adsabs.harvard.edu/abs/2008AJ....136..773F 136, 773
2008 doi
-
[32]
B., Drory N., 2010, @doi [ ] 10.1088/0004-637X/716/2/942 , https://ui.adsabs.harvard.edu/abs/2010ApJ...716..942F 716, 942
Fisher D. B., Drory N., 2010, @doi [ ] 10.1088/0004-637X/716/2/942 , https://ui.adsabs.harvard.edu/abs/2010ApJ...716..942F 716, 942
2010 doi
-
[33]
B., Drory N., 2011, @doi [ ] 10.1088/2041-8205/733/2/L47 , https://ui.adsabs.harvard.edu/abs/2011ApJ...733L..47F 733, L47
Fisher D. B., Drory N., 2011, @doi [ ] 10.1088/2041-8205/733/2/L47 , https://ui.adsabs.harvard.edu/abs/2011ApJ...733L..47F 733, L47
2011 doi
-
[34]
B., Drory N., 2016, in Laurikainen E., Peletier R., Gadotti D., eds, Astrophysics and Space Science Library Vol
Fisher D. B., Drory N., 2016, in Laurikainen E., Peletier R., Gadotti D., eds, Astrophysics and Space Science Library Vol. 418, Galactic Bulges. p. 41 ( @eprint arXiv 1512.02230 ), @doi 10.1007/978-3-319-19378-6_3
2016 arXiv
-
[35]
B., Drory N., Fabricius M
Fisher D. B., Drory N., Fabricius M. H., 2009, @doi [ ] 10.1088/0004-637X/697/1/630 , https://ui.adsabs.harvard.edu/abs/2009ApJ...697..630F 697, 630
2009 doi
-
[36]
C., Krumholz M
Forbes J. C., Krumholz M. R., Burkert A., Dekel A., 2014, @doi [ ] 10.1093/mnras/stt2294 , https://ui.adsabs.harvard.edu/abs/2014MNRAS.438.1552F 438, 1552
2014 doi
-
[37]
A., 2009, @doi [ ] 10.1111/j.1365-2966.2008.14257.x , https://ui.adsabs.harvard.edu/abs/2009MNRAS.393.1531G 393, 1531
Gadotti D. A., 2009, @doi [ ] 10.1111/j.1365-2966.2008.14257.x , https://ui.adsabs.harvard.edu/abs/2009MNRAS.393.1531G 393, 1531
2009
-
[38]
A., et al., 2019, @doi [ ] 10.1093/mnras/sty2666 , https://ui.adsabs.harvard.edu/abs/2019MNRAS.482..506G 482, 506
Gadotti D. A., et al., 2019, @doi [ ] 10.1093/mnras/sty2666 , https://ui.adsabs.harvard.edu/abs/2019MNRAS.482..506G 482, 506
2019 doi
-
[39]
F., et al., 2009a, @doi [ ] 10.1111/j.1365-2966.2009.14983.x , https://ui.adsabs.harvard.edu/abs/2009MNRAS.397..802H 397, 802
Hopkins P. F., et al., 2009a, @doi [ ] 10.1111/j.1365-2966.2009.14983.x , https://ui.adsabs.harvard.edu/abs/2009MNRAS.397..802H 397, 802
2009
-
[40]
F., Cox T
Hopkins P. F., Cox T. J., Younger J. D., Hernquist L., 2009b, @doi [ ] 10.1088/0004-637X/691/2/1168 , https://ui.adsabs.harvard.edu/abs/2009ApJ...691.1168H 691, 1168
-
[41]
Huertas-Company M., Aguerri J. A. L., Bernardi M., Mei S., S \'a nchez Almeida J., 2011, @doi [ ] 10.1051/0004-6361/201015735 , https://ui.adsabs.harvard.edu/abs/2011A
2011 doi
-
[43]
Kauffmann G., et al., 2003b, @doi [ ] 10.1046/j.1365-8711.2003.06292.x , https://ui.adsabs.harvard.edu/abs/2003MNRAS.341...54K 341, 54
2003
-
[44]
Kauffmann G., et al., 2003c, @doi [ ] 10.1111/j.1365-2966.2003.07154.x , https://ui.adsabs.harvard.edu/abs/2003MNRAS.346.1055K 346, 1055
2003
-
[45]
Kim T., et al., 2014, @doi [ ] 10.1088/0004-637X/782/2/64 , https://ui.adsabs.harvard.edu/abs/2014ApJ...782...64K 782, 64
2014 doi
-
[46]
Kormendy J., 1977, @doi [ ] 10.1086/155687 , https://ui.adsabs.harvard.edu/abs/1977ApJ...218..333K 218, 333
1977 doi
-
[47]
418, Galactic Bulges
Kormendy J., 2016, in Laurikainen E., Peletier R., Gadotti D., eds, Astrophysics and Space Science Library Vol. 418, Galactic Bulges. p. 431 ( @eprint arXiv 1504.03330 ), @doi 10.1007/978-3-319-19378-6_16
2016 arXiv
-
[48]
C., 2010, @doi [ ] 10.1088/2041-8205/715/2/L176 , https://ui.adsabs.harvard.edu/abs/2010ApJ...715L.176K 715, L176
Kormendy J., Barentine J. C., 2010, @doi [ ] 10.1088/2041-8205/715/2/L176 , https://ui.adsabs.harvard.edu/abs/2010ApJ...715L.176K 715, L176
2010 doi
-
[49]
Kormendy J., Kennicutt Jr. R. C., 2004, @doi [ ] 10.1146/annurev.astro.42.053102.134024 , https://ui.adsabs.harvard.edu/abs/2004ARA
2004
-
[50]
E., 2010, @doi [ ] 10.1088/0004-637X/723/1/54 , https://ui.adsabs.harvard.edu/abs/2010ApJ...723...54K 723, 54
Kormendy J., Drory N., Bender R., Cornell M. E., 2010, @doi [ ] 10.1088/0004-637X/723/1/54 , https://ui.adsabs.harvard.edu/abs/2010ApJ...723...54K 723, 54
2010 doi
-
[51]
Lee B., et al., 2018, @doi [ ] 10.3847/1538-4357/aaa40f , https://ui.adsabs.harvard.edu/abs/2018ApJ...853..131L 853, 131
2018 doi
-
[53]
L., et al., 2011, @doi [ ] 10.1111/j.1365-2966.2010.17834.x , https://ui.adsabs.harvard.edu/abs/2011MNRAS.411.2026M 411, 2026
Masters K. L., et al., 2011, @doi [ ] 10.1111/j.1365-2966.2010.17834.x , https://ui.adsabs.harvard.edu/abs/2011MNRAS.411.2026M 411, 2026
2011
-
[54]
M., Molaeinezhad A., Onodera M., Khosroshahi H
Mosleh M., Tacchella S., Renzini A., Carollo C. M., Molaeinezhad A., Onodera M., Khosroshahi H. G., Lilly S., 2017, @doi [ ] 10.3847/1538-4357/aa5f14 , https://ui.adsabs.harvard.edu/abs/2017ApJ...837....2M 837, 2
2017 doi
-
[55]
K., 2011, @doi [ ] 10.1088/0067-0049/195/2/13 , https://ui.adsabs.harvard.edu/abs/2011ApJS..195...13O 195, 13
Oh K., Sarzi M., Schawinski K., Yi S. K., 2011, @doi [ ] 10.1088/0067-0049/195/2/13 , https://ui.adsabs.harvard.edu/abs/2011ApJS..195...13O 195, 13
2011 doi
-
[56]
Padmanabhan N., et al., 2008, @doi [ ] 10.1086/524677 , https://ui.adsabs.harvard.edu/abs/2008ApJ...674.1217P 674, 1217
2008 doi
-
[57]
G., Kelson D
Patel S. G., Kelson D. D., Holden B. P., Franx M., Illingworth G. D., 2011, @doi [ ] 10.1088/0004-637X/735/1/53 , https://ui.adsabs.harvard.edu/abs/2011ApJ...735...53P 735, 53
2011 doi
-
[58]
Querejeta M., et al., 2019, @doi [ ] 10.1051/0004-6361/201834915 , https://ui.adsabs.harvard.edu/abs/2019A&A...625A..19Q 625, A19
2019 doi
-
[59]
D., et al., 2004, @doi [ ] 10.1086/380601 , https://ui.adsabs.harvard.edu/abs/2004ApJ...602..190Q 602, 190
Quintero A. D., et al., 2004, @doi [ ] 10.1086/380601 , https://ui.adsabs.harvard.edu/abs/2004ApJ...602..190Q 602, 190
2004 doi
-
[60]
S., Cox T
Robertson B., Bullock J. S., Cox T. J., Di Matteo T., Hernquist L., Springel V., Yoshida N., 2006, @doi [ ] 10.1086/504412 , https://ui.adsabs.harvard.edu/abs/2006ApJ...645..986R 645, 986
2006 doi
-
[61]
Salo H., et al., 2015, @doi [ ] 10.1088/0067-0049/219/1/4 , https://ui.adsabs.harvard.edu/abs/2015ApJS..219....4S 219, 4
2015 doi
-
[62]
T., Patton D
Simard L., Mendel J. T., Patton D. R., Ellison S. L., McConnachie A. W., 2011, @doi [ ] 10.1088/0067-0049/196/1/11 , https://ui.adsabs.harvard.edu/abs/2011ApJS..196...11S 196, 11
2011 doi
-
[63]
Strateva I., et al., 2001, @doi [ ] 10.1086/323301 , https://ui.adsabs.harvard.edu/abs/2001AJ....122.1861S 122, 1861
2001 doi
-
[64]
Tacchella S., et al., 2015, @doi [Science] 10.1126/science.1261094 , https://ui.adsabs.harvard.edu/abs/2015Sci...348..314T 348, 314
2015 doi
-
[65]
Wang W., et al., 2017, @doi [ ] 10.1093/mnras/stx1148 , https://ui.adsabs.harvard.edu/abs/2017MNRAS.469.4063W 469, 4063
2017 doi
-
[66]
E., et al., 2017, @doi [ ] 10.3847/1538-4357/aa6258 , https://ui.adsabs.harvard.edu/abs/2017ApJ...838...19W 838, 19
Whitaker K. E., et al., 2017, @doi [ ] 10.3847/1538-4357/aa6258 , https://ui.adsabs.harvard.edu/abs/2017ApJ...838...19W 838, 19
2017 doi
-
[67]
J., Quadri R
Williams R. J., Quadri R. F., Franx M., van Dokkum P., Labb \'e I., 2009, @doi [ ] 10.1088/0004-637X/691/2/1879 , https://ui.adsabs.harvard.edu/abs/2009ApJ...691.1879W 691, 1879
2009 doi
-
[68]
L., 2019, @doi [ ] 10.1093/mnras/stz1377 , https://ui.adsabs.harvard.edu/abs/2019MNRAS.tmp.1323W p
Woo J., Ellison S. L., 2019, @doi [ ] 10.1093/mnras/stz1377 , https://ui.adsabs.harvard.edu/abs/2019MNRAS.tmp.1323W p. 1323
2019 doi
-
[69]
M., Koo D
Woo J., Dekel A., Faber S. M., Koo D. C., 2015, @doi [ ] 10.1093/mnras/stu2755 , https://ui.adsabs.harvard.edu/abs/2015MNRAS.448..237W 448, 237
2015 doi
-
[70]
M., Faber S
Woo J., Carollo C. M., Faber S. M., Dekel A., Tacchella S., 2017, @doi [ ] 10.1093/mnras/stw2403 , https://ui.adsabs.harvard.edu/abs/2017MNRAS.464.1077W 464, 1077
2017 doi
-
[71]
K., et al., 2007, @doi [ ] 10.1086/521402 , https://ui.adsabs.harvard.edu/abs/2007ApJS..173..293W 173, 293
Wyder T. K., et al., 2007, @doi [ ] 10.1086/521402 , https://ui.adsabs.harvard.edu/abs/2007ApJS..173..293W 173, 293
2007 doi
-
[72]
J., van den Bosch F
Yang X., Mo H. J., van den Bosch F. C., Zhang Y., Han J., 2012, @doi [ ] 10.1088/0004-637X/752/1/41 , https://ui.adsabs.harvard.edu/abs/2012ApJ...752...41Y 752, 41
2012 doi
-
[73]
M., Faber S
Yesuf H. M., Faber S. M., Trump J. R., Koo D. C., Fang J. J., Liu F. S., Wild V., Hayward C. C., 2014, @doi [ ] 10.1088/0004-637X/792/2/84 , https://ui.adsabs.harvard.edu/abs/2014ApJ...792...84Y 792, 84
2014 doi
-
[74]
M., Faber S
Yesuf H. M., Faber S. M., Koo D. C., Woo J., Primack J. R., Luo Y., 2019, arXiv e-prints, https://ui.adsabs.harvard.edu/abs/2019arXiv191203633Y p. arXiv:1912.03633
2019 arXiv
-
[75]
I., Zaritsky D., Lin H., Tucker D., Hashimoto Y., Shectman S
Zabludoff A. I., Zaritsky D., Lin H., Tucker D., Hashimoto Y., Shectman S. A., Oemler A., Kirshner R. P., 1996, @doi [ ] 10.1086/177495 , https://ui.adsabs.harvard.edu/abs/1996ApJ...466..104Z 466, 104
1996 doi
-
[76]
Zolotov A., et al., 2015, @doi [ ] 10.1093/mnras/stv740 , https://ui.adsabs.harvard.edu/abs/2015MNRAS.450.2327Z 450, 2327
2015 doi
-
[77]
G., et al., 2014, @doi [ ] 10.1088/0004-637X/791/1/45 , https://ui.adsabs.harvard.edu/abs/2014ApJ...791...45V 791, 45
van Dokkum P. G., et al., 2014, @doi [ ] 10.1088/0004-637X/791/1/45 , https://ui.adsabs.harvard.edu/abs/2014ApJ...791...45V 791, 45
2014 doi
-
[78]
G., et al., 2015, @doi [ ] 10.1088/0004-637X/813/1/23 , https://ui.adsabs.harvard.edu/abs/2015ApJ...813...23V 813, 23
van Dokkum P. G., et al., 2015, @doi [ ] 10.1088/0004-637X/813/1/23 , https://ui.adsabs.harvard.edu/abs/2015ApJ...813...23V 813, 23
2015 doi
Reviewed August 14, 2026 · model on record in the stance chip above.
Discussion (0). Continue with ORCID to comment.