REVIEW 3 major objections 5 minor 34 references
Identification and Characterization of a New Disruption Regime in ADITYA-U Tokamak
T0 review · 3 major / 5 minor · reviewed 2026-08-06 · deepseek-v4-flash
Pith's one-line read The paper identifies a new disruption class in the ADITYA-U tokamak, Accelerated Mode Disruption, distinguished by a rising (2,1) drift-tearing-mode frequency followed by a sudden frequency collapse and a faster, more intense current…
desk verdict Plausible new disruption class, but the reported thresholds are built on a classification rule the paper never states; needs major revision before the quantitative claims can be trusted. read the letter →
The pith
A machine-rendered reading of the paper's core claim, the machinery that carries it, and where it could break.
The reading
What carries the argument
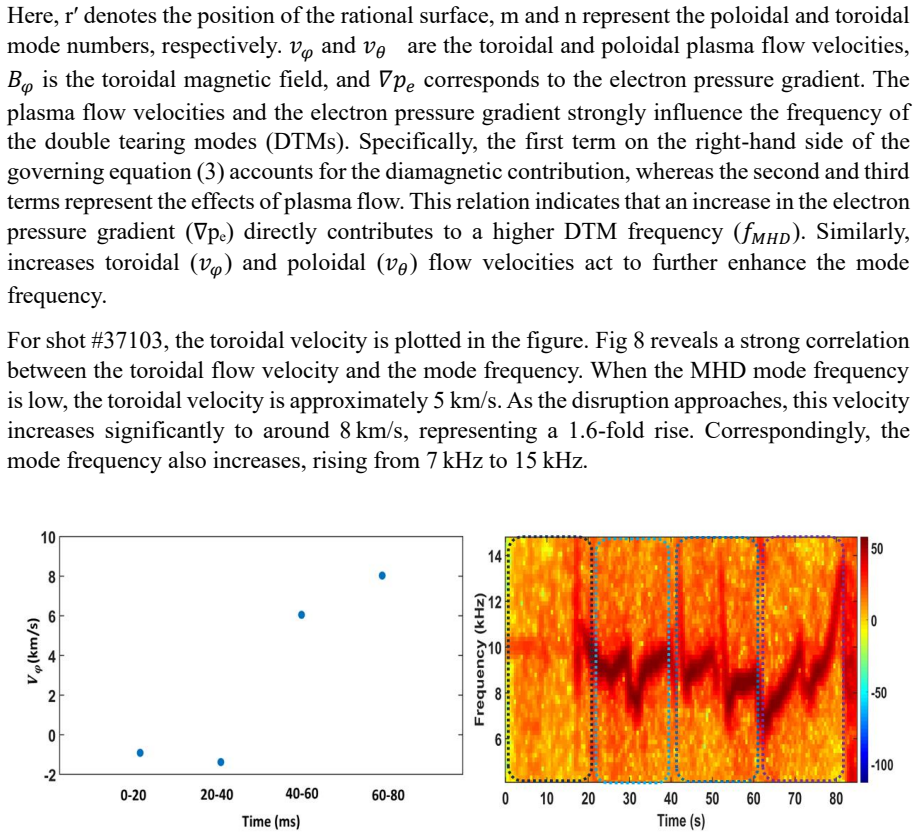
The carrying object is the (m/n = 2/1) drift-tearing mode (DTM), the coupled tearing-drift instability that is the sole dominant mode in AMD discharges. Its frequency is decomposed as $f_{\rm MHD} = \frac{m}{2\pi r B_\varphi}\frac{\nabla p_e}{e n_e} + \frac{n v_\varphi}{2\pi R_0} + \frac{m v_\theta}{2\pi r}$ at the rational surface; for shot #37103 the diamagnetic term contributes about 7.8 kHz of a 10 kHz frequency, with toroidal flow about 1.7 kHz and poloidal flow about 0.5 kHz. The mechanism this equation encodes is the paper's central explanation: a rising pressure gradient near the rational surface is what accelerates the mode, and the same core-temperature-hollowing that steepens that gradient also destabilizes the mode and triggers the quench. The empirical separators, $q_{\rm edge} > 4.3$ and greater than 16% current decay, locate the q=2 surface and the current-profile evolution that set AMD apart from LMD.
What would settle it
Take the same 150 discharges, mask the labels, and have two independent analysts classify each shot by a pre-specified rule (for example, the sign of the linear slope of the dominant Mirnov frequency during the 10 ms before the thermal quench, or a threshold on the frequency rise). If the sharp boundaries at $q_{\rm edge}=4.3$, 16% current decay, 1.5 ms quench time, and 56 MA/s do not reappear, the AMD/LMD separation is an artifact of the labelling procedure. A complementary check is to find a single discharge with a clear rising-frequency precursor but a current quench longer than 1.5 ms, which would break the claimed correspondence.
Extended reading notes
Core claim
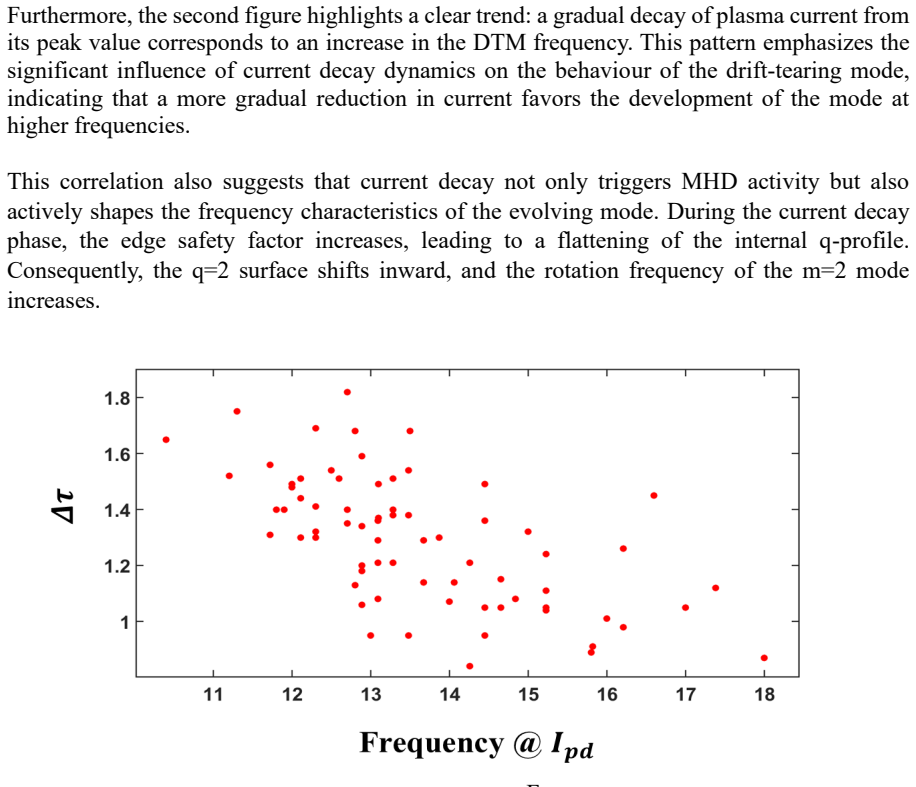
The central claim is that ADITYA-U hosts a previously unrecognized disruption regime, Accelerated Mode Disruption, whose precursor differs from locked-mode behavior: instead of the mode slowing toward locking, the (2,1) drift-tearing mode shows a sustained frequency rise while its magnetic island width stays roughly 4–5 cm, followed by an abrupt frequency drop and island expansion immediately before the thermal quench. The paper derives statistical boundaries between AMD and LMD from 150 discharges: 73% of AMDs occur for $q_{\rm edge} > 4.3$ while 80% of LMDs occur below that value, and a plasma current decay greater than 16% from maximum gives a 75% chance of AMD. AMD current quenches are shorter than 1.5 ms and faster than 56 MA/s, making them more hazardous than LMD. Physically, the paper attributes AMD to core radiation and hollowing of the temperature profile, which flattens or hollows the current profile and steepens both the current-density and pressure gradients near the q=2 rational surface, driving the dominant (2,1) drift-tearing mode; roughly 78% of the observed frequency rise is assigned to the diamagnetic pressure-gradient term.
Load-bearing premise
The entire statistical separation rests on the assumption that the 150 discharges were sorted into AMD and LMD by a consistent and unbiased reading of the precursor frequency trend; the paper gives no quantitative, pre-specified sorting rule, so the empirical thresholds could partly be a product of the sorting.
Editorial extensions
If this is right
- Disruption prediction systems that rely on mode locking as the warning sign will miss AMD until very late; a rising (2,1) mode frequency with saturated amplitude is itself an early precursor.
- Real-time monitors using $q_{\rm edge}$ and the current decay coefficient can flag high-risk shots: values above 4.3 and above 16% decay point to the faster AMD class.
- Because AMD current quenches are shorter than 1.5 ms and faster than 56 MA/s, mitigation actuators for ADITYA-U must be able to react on or before the frequency-collapse phase, not after locking.
- The DTM frequency at the disruption onset correlates with quench duration, so the precursor frequency rise is not just a label but a severity measure.
- A planned mitigation framework on ADITYA-U would combine software predictions with hardware actuators keyed to $q_{\rm edge}$, current decay, and DTM frequency.
Reading between the lines
- Extension, not the paper's claim: the frequency slope during the precursor could serve as a continuous danger score, with faster rises predicting shorter quench times; the paper's correlation between final frequency and quench time supports this but does not test it directly.
- Extension, not the paper's claim: if the $q_{\rm edge} > 4.3$ boundary reflects the position of the q=2 surface near the plasma edge, then similar AMD-like events should appear in other small and medium tokamaks operated at high edge safety factor with core radiation; this is testable with existing multi-device disruption records.
- Extension, not the paper's claim: a practical predictor could classify AMD using only Mirnov frequency slope and soft-X-ray core hollowing, avoiding the need for full equilibrium reconstruction; the paper's diagnostics show both signals change early, but it does not test such a classifier.
Signed reviews
Editorial analysis
A structured set of objections, weighed in public.
Referee Report
Summary. The paper reports the identification of a new disruption regime in the ADITYA-U tokamak, termed Accelerated Mode Disruption (AMD), and contrasts it with conventional Locked Mode Disruption (LMD). The distinguishing signature is a precursor phase with a steadily rising mode frequency and nonlinearly saturated amplitude, followed by a sudden frequency collapse and amplitude growth. A statistical analysis of 150 discharges is claimed to yield empirical thresholds in edge safety factor (q_edge > 4.3), normalized current decay coefficient (>16%), current quench time (<1.5 ms), and current quench rate (>56 MA/s) that separate AMD from LMD. The paper further proposes that core temperature hollowing causes steepening of pressure and current density gradients near the 2/1 rational surface, destabilizing the drift-tearing mode and producing the observed frequency behavior.
Significance. If substantiated, the existence of a distinct disruption class with faster and more dangerous current quenches would be valuable for disruption prediction and mitigation, particularly for future devices. The paper leverages a reasonably large dataset (150 discharges) and multiple diagnostics (Mirnov coils, SXR, bolometry, Langmuir probes), and the primary classification signal (rising versus decaying precursor frequency) is in principle independent of the variables used for the reported thresholds. These are notable strengths. However, the quantitative support is currently inadequate: the classification rule is not specified in a reproducible way, the thresholds lack error bars, and the mechanism section contains circular reasoning and a unit inconsistency. The paper's central claim is therefore not yet convincingly established, but it is potentially salvageable with a thorough revision.
major comments (3)
- [Sec. 3.1-3.2] The classification rule used to label the 150 discharges as AMD or LMD is not specified. The text describes AMD as exhibiting 'a steady rise in mode frequency with a nonlinearly saturated amplitude' (Sec. 3.1), but it does not define a quantitative criterion: no time window, frequency slope threshold, amplitude saturation level, or analysis method is given. The inclusion and exclusion criteria for the 150-shot sample, the shot list, and any inter-rater or independent diagnostic checks are also absent. Because the statistical thresholds in Sec. 3.2 (q_edge > 4.3, current decay > 16%) are computed on this manually labeled sample, they may be artifacts of the labeling procedure rather than independent physical boundaries. Please provide an explicit, reproducible classification algorithm or detailed quantitative criteria, and re-derive the thresholds with confidence intervals.
- [Sec. 6] The claim that the electron pressure gradient dominates the DTM frequency is circular. The diamagnetic contribution of 7.8 kHz is obtained as the residual after subtracting the flow contributions (1.7 kHz toroidal and 0.5 kHz poloidal) from the measured total frequency of approximately 10 kHz (Sec. 5); it is not an independent measurement of a pressure-gradient-driven term. Using that residual to conclude that 'the pressure gradient near the mode rational surface plays a dominant role' (Sec. 5) is reasoning in a circle. Furthermore, the calculation in the bullet list is dimensionally inconsistent: the text first states that ∇p_e should be 2×10^4 Pa/m, but then writes '∇p_e = ∇(n_e T_e) = 2.6×10^4 / 1.6×10^-19 = 1.625×10^23 Pa/m', which is not a valid pressure-gradient computation. Please correct the unit errors and either provide an independent measurement of the pressure gradient or explicitly frame the 7.8 kHz value as a consistency check rather than as evidence for the mechanism.
- [Sec. 5-6] The analysis relies on an assumed current density profile J ~ (1-(r/a)^2)^α with α=3 (Sec. 5), but no justification or sensitivity study is provided. The location of the rational surface r_s ≈ 0.12 m for shot #37103, the computed island width, and the frequency decomposition in Sec. 5 all depend on this assumption. Since the interpretation of the mode as a 2/1 drift-tearing mode and the subsequent mechanism discussion hinge on r_s, please provide a sensitivity analysis over reasonable α values or cite a direct constraint on the current density profile from the ADITYA-U diagnostics.
minor comments (5)
- [Sec. 3.3] The text states 'Figure 3 presents the statistical analysis of these parameters across 150 disruptive shots', but the actual figures showing current quench time and rate are Fig. 4(a) and 4(b). Please correct the cross-reference.
- [Sec. 6] The text refers to 'Figure 5' and 'Figure 6' for the bolometer radiation profiles and chord-averaged temperature, but these data are displayed in Fig. 10(a) and 10(b). Please correct the figure citations.
- [Sec. 7] The summary contains a duplicated phrase: 'Through a comprehensive Through a comprehensive statistical study'. Please fix the typo.
- [Sec. 3.1] For shot #37103, the text states that the Mirnov signal shows 'a characteristic 50% increase in frequency', but the described frequency range is 7-15 kHz, which is more than a 100% increase. Please clarify the metric used for the percentage change.
- [Sec. 6] The paper refers to 'line-averaged temperature' estimated from SXR signals; SXR diagnostics measure line-integrated emissivity, and the temperature inference is indirect (via foil-filter ratios, as noted in Sec. 2). Please use the correct terminology and explain the inversion method.
Circularity Check
The empirical AMD/LMD separation is not circular, but the mechanistic claim that a pressure-gradient-driven diamagnetic term dominates is constructed from the residual after subtracting flow terms.
-
self definitional
[Section 5 (frequency decomposition) and Section 6 (required pressure gradient)]
"With this in mind, by incorporating these values into the final equation, the term that contributes the maximum is m/(2πrBφ) ∇p_e/(e n_e)=7.8 kHz. Approximately 22% of the increase in Drift-Tearing Mode (DTM) frequency can be attributed to the combined effects of toroidal and poloidal plasma flows, while the remaining contribution primarily arises from the diamagnetic term. ... For the observed DTM frequency of 7.8 kHz, the relation ... suggests that the required electron pressure gradient ∇p_e should be 2×10^4 Pa/m."
The 7.8 kHz diamagnetic contribution is not an independent measured quantity: it is computed as the arithmetic residual from the measured total frequency after subtracting the estimated flow terms (10 kHz − 1.7 kHz − 0.5 kHz) using the decomposition in Eq. (3). The paper then treats this residual as evidence that the pressure gradient dominates and derives the 'required' pressure gradient of 2×10^4 Pa/m from it. Because the diamagnetic term is by construction the leftover after subtracting the flow terms, the conclusion that pressure-gradient effects dominate and drive the frequency increase is guaranteed by the subtraction itself. No independent measurement of ∇p_e is presented to validate the inferred steep gradient.
full rationale
The central regime identification is not circular: AMD and LMD are labeled in Sec. 3.1 by the sign of the precursor-mode frequency trend (rising versus decaying), which is independent of the downstream statistical thresholds (q_edge, current-decay coefficient, CQ time/rate). The reported cluster separation is therefore an empirical summary of an independently labeled sample, even though the labeling rule is qualitative and not pre-registered. That is a reproducibility/validity concern, not a circularity. No load-bearing uniqueness theorem or self-citation chain is invoked: the frequency formula is attributed to an external J-TEXT paper, and the analogous JET observations [9] are an external comparison. The one genuinely circular element is the mechanistic attribution in Secs. 5-6: the diamagnetic term is defined as the measured frequency minus the estimated flow terms, so the statement that it dominates, and the required pressure gradient of 2×10^4 Pa/m, are both constructed from that residual. The paper then uses these as evidence for localized pressure steepening. That sub-claim reduces by construction to the input data. The score of 6 reflects partial circularity in the mechanism, while the empirical AMD/LMD distinction retains independent content.
Assumptions & free parameters
free parameters (3)
- Current density profile exponent alpha =
3
- Diamagnetic frequency contribution =
7.8 kHz
- AMD/LMD separation cutoffs =
q_edge=4.3, current decay=16%, CQ time=1.5 ms, CQ rate=56 MA/s
assumptions (4)
- domain assumption Current density profile has the form J ~ (1-(r/a)^2)^3 and the safety factor follows Eq. (1).
- domain assumption The MHD frequency is the sum of diamagnetic, toroidal flow, and poloidal flow terms as in Eq. (3).
- domain assumption Temperature hollowing and current flattening destabilize the 2/1 tearing mode via steep gradients near the rational surface.
- domain assumption The discharges analyzed in the 150-shot sample are representative and the AMD/LMD labels are assigned correctly.
Cite this review
Pith. "Pith review of Identification and Characterization of a New Disruption Regime in ADITYA-U Tokamak." pith.science (2026). https://pith.science/paper/GKTJLSWX
@misc{pith2026250717299,
  author       = {Pith},
  title        = {Pith review of: Identification and Characterization of a New Disruption Regime in ADITYA-U Tokamak},
  year         = {2026},
  howpublished = {\url{https://pith.science/paper/GKTJLSWX}},
  note         = {Machine review of arXiv:2507.17299}
}
read the original abstract
Disruptions continue to pose a significant challenge to the stable operation and future design of tokamak reactors. A comprehensive statistical investigation carried out on the ADITYA-U tokamak has led to the observation and characterization of a novel disruption regime. In contrast to the conventional Locked Mode Disruption (LMD), the newly identified disruption exhibits a distinctive two-phase evolution: an initial phase characterized by a steady rise in mode frequency with a nonlinearly saturated amplitude, followed by a sudden frequency collapse accompanied by a pronounced increase in amplitude. This behaviour signifies the onset of the precursor phase on a significantly shorter timescale. Clear empirical thresholds have been identified to distinguish this disruption type from conventional LMD events, including edge safety factor, current decay coefficient, current quench (CQ) time, and CQ rate. The newly identified disruption regime is predominantly governed by the (m/n = 2/1) drift-tearing mode (DTM), which, in contrast to typical disruptions in the ADITYA-U tokamak that involve both m/n = 2/1 and 3/1 modes, consistently manifests as the sole dominant instability. Initiated by core temperature hollowing, the growth of this mode is significantly enhanced by a synergistic interplay between a strongly localized pressure gradient and the pronounced steepening of the current density profile in the vicinity of the mode rational surface.
Figures


Figures from the paper (7 more)





Reference graph
Works this paper leans on
-
[1]
T. Jordan and D. Schneider, “Effects of an electrically conducting first wall on the blanket loading during a Tokamak plasma disruption,” Fusion Engineering and Design, vol. 31, no. 4, pp. 313–321, Aug. 1996, doi: 10.1016/0920-3796(96)00526-1
-
[2]
T. Craciunescu, A. Murari, on behalf of JET Contributors, and the EUROfusion Tokamak Exploitation Team, “Parsimonious statistical techniques for the detection of drifts toward dangerous operational conditions in tokamaks,” Plasma Phys. Control. Fusion, vol. 66, no. 9, p. 095008, Sep. 2024, doi: 10.1088/1361-6587/ad670a
-
[3]
F. C. Schuller, “Disruptions in tokamaks,” Plasma Phys. Control. Fusion, vol. 37, no. 11A, pp. A135–A162, Nov. 1995, doi: 10.1088/0741-3335/37/11A/009
-
[4]
Disruptions and Plasma Current Asymmetries in Tokamak Plasmas
E. Matveeva, J. Havlıˇcek, O. Hronova, V . Weinzettl, and A. Havranek, “Disruptions and Plasma Current Asymmetries in Tokamak Plasmas”
-
[5]
Vertical displacement events: A serious concern in future ITER operation,
A. Hassanein, T. Sizyuk, and M. Ulrickson, “Vertical displacement events: A serious concern in future ITER operation,” Fusion Engineering and Design, vol. 83, no. 7–9, pp. 1020–1024, Dec. 2008, doi: 10.1016/j.fusengdes.2008.05.032
-
[6]
A new look at density limits in tokamaks,
M. Greenwald et al., “A new look at density limits in tokamaks,” Nucl. Fusion, vol. 28, no. 12, pp. 2199–2207, Dec. 1988, doi: 10.1088/0029-5515/28/12/009
-
[8]
Characterization of the plasma current quench during disruptions in ADITYA tokamak,
S. Purohit et al., “Characterization of the plasma current quench during disruptions in ADITYA tokamak,” Nucl. Fusion, vol. 60, no. 12, p. 126042, Dec. 2020, doi: 10.1088/1741-4326/abb79c. 19
-
[9]
G. Pucella et al., “Onset of tearing modes in plasma termination on JET: the role of temperature hollowing and edge cooling,” Nucl. Fusion, vol. 61, no. 4, p. 046020, Apr. 2021, doi: 10.1088/1741-4326/abe3c7
Show all 34 references
-
[10]
The study of heat flux for disruption on experimental advanced superconducting tokamak,
Z. Yang et al., “The study of heat flux for disruption on experimental advanced superconducting tokamak,” Physics of Plasmas, vol. 23, no. 5, p. 052502, May 2016, doi: 10.1063/1.4948494
2016 doi
-
[11]
Characteristics of current quenches during disruptions in the J-TEXT tokamak,
Y . Zhang et al., “Characteristics of current quenches during disruptions in the J-TEXT tokamak,” Phys. Scr., vol. 86, no. 2, p. 025501, Aug. 2012, doi: 10.1088/0031- 8949/86/02/025501
2012 doi
-
[12]
MHD spectrogram contribution to disruption prediction using Convolutional Neural Networks,
E. Aymerich, G. Sias, S. Atzeni, F. Pisano, B. Cannas, and A. Fanni, “MHD spectrogram contribution to disruption prediction using Convolutional Neural Networks,” Fusion Engineering and Design, vol. 204, p. 114472, Jul. 2024, doi: 10.1016/j.fusengdes.2024.114472
2024
-
[13]
Deep sequence to sequence learning-based prediction of major disruptions in ADITYA tokamak,
A. Agarwal et al., “Deep sequence to sequence learning-based prediction of major disruptions in ADITYA tokamak,” Plasma Phys. Control. Fusion, vol. 63, no. 11, p. 115004, Nov. 2021, doi: 10.1088/1361-6587/ac234c
2021 doi
-
[14]
Disruption prediction using a full convolutional neural network on EAST,
B. H. Guo et al., “Disruption prediction using a full convolutional neural network on EAST,” Plasma Phys. Control. Fusion, vol. 63, no. 2, p. 025008, Feb. 2021, doi: 10.1088/1361-6587/abcbab
2021 doi
-
[15]
CNN disruption predictor at JET: Early versus late data fusion approach,
E. Aymerich, G. Sias, F. Pisano, B. Cannas, A. Fanni, and the-JET-Contributors, “CNN disruption predictor at JET: Early versus late data fusion approach,” Fusion Engineering and Design, vol. 193, p. 113668, Aug. 2023, doi: 10.1016/j.fusengdes.2023.113668
2023
-
[16]
In-depth research on the interpretable disruption predictor in HL-2A,
Z. Yang, F. Xia, X. Song, Z. Gao, S. Wang, and Y . Dong, “In-depth research on the interpretable disruption predictor in HL-2A,” Nucl. Fusion, vol. 61, no. 12, p. 126042, Dec. 2021, doi: 10.1088/1741-4326/ac31d8
2021 doi
-
[17]
The ITPA disruption database,
N. W. Eidietis et al., “The ITPA disruption database,” Nucl. Fusion, vol. 55, no. 6, p. 063030, Jun. 2015, doi: 10.1088/0029-5515/55/6/063030
2015 doi
-
[18]
Drift-tearing modes in a tokamak plasma,
D. Biskamp, “Drift-tearing modes in a tokamak plasma,” Nucl. Fusion, vol. 18, no. 8, pp. 1059–1068, Aug. 1978, doi: 10.1088/0029-5515/18/8/003
1978 doi
-
[19]
Effect of periodic gas-puffs on drift-tearing modes in ADITYA/ADITYA- U tokamak discharges,
H. Raj et al., “Effect of periodic gas-puffs on drift-tearing modes in ADITYA/ADITYA- U tokamak discharges,” Nucl. Fusion, vol. 60, no. 3, p. 036012, Mar. 2020, doi: 10.1088/1741-4326/ab6810
2020 doi
-
[20]
Drift-tearing magnetic islands in tokamak plasmas,
R. Fitzpatrick and F. L. Waelbroeck, “Drift-tearing magnetic islands in tokamak plasmas,” Physics of Plasmas, vol. 15, no. 1, p. 012502, Jan. 2008, doi: 10.1063/1.2829757
2008 doi
-
[21]
Controlling the rotation of drift tearing modes by biased electrode in ADITYA-U tokamak,
T. Macwan et al., “Controlling the rotation of drift tearing modes by biased electrode in ADITYA-U tokamak,” Physics of Plasmas, vol. 28, no. 11, p. 112501, Nov. 2021, doi: 10.1063/5.0059410
2021 doi
-
[22]
Mode rotation control in a tokamak with a feedback-driven biased electrode,
J. W. Brooks, I. G. Stewart, M. D. Boyer, J. P. Levesque, M. E. Mauel, and G. A. Navratil, “Mode rotation control in a tokamak with a feedback-driven biased electrode,” Review of Scientific Instruments, vol. 90, no. 2, p. 023503, Feb. 2019, doi: 10.1063/1.5062271
2019 doi
-
[23]
Effect of electrode biasing on m/n = 2/1 tearing modes in J-TEXT experiments,
H. Liu et al., “Effect of electrode biasing on m/n = 2/1 tearing modes in J-TEXT experiments,” Nucl. Fusion, vol. 57, no. 1, p. 016003, Jan. 2017, doi: 10.1088/0029- 5515/57/1/016003
2017 doi
-
[24]
In-vessel saddle coils for MHD control in ASDEX Upgrade,
W. Suttrop et al., “In-vessel saddle coils for MHD control in ASDEX Upgrade,” Fusion Engineering and Design, vol. 84, no. 2–6, pp. 290–294, Jun. 2009, doi: 10.1016/j.fusengdes.2008.12.044
2009 doi
-
[25]
Mode locking in tokamaks,
M. F. F. Nave and J. A. Wesson, “Mode locking in tokamaks,” Nucl. Fusion, vol. 30, no. 12, pp. 2575–2583, Dec. 1990, doi: 10.1088/0029-5515/30/12/011. 20
1990 doi
-
[26]
Nonlinear saturation of resistive tearing modes in a cylindrical tokamak with and without solving the dynamics,
J. Loizu and D. Bonfiglio, “Nonlinear saturation of resistive tearing modes in a cylindrical tokamak with and without solving the dynamics,” J. Plasma Phys., vol. 89, no. 5, p. 905890507, Oct. 2023, doi: 10.1017/S0022377823000934
2023 doi
-
[27]
Overview of recent experimental results from the ADITYA-U tokamak,
R. L. Tanna et al., “Overview of recent experimental results from the ADITYA-U tokamak,” Nucl. Fusion, vol. 62, no. 4, p. 042017, Feb. 2022, doi: 10.1088/1741- 4326/ac31db
2022 doi
-
[28]
Improved Horizontal Plasma Position Control Using c-RIO-Based Real Time System in Aditya-U,
P. Gautam et al., “Improved Horizontal Plasma Position Control Using c-RIO-Based Real Time System in Aditya-U,” IEEE Trans. Plasma Sci., vol. 52, no. 9, pp. 3809– 3813, Sep. 2024, doi: 10.1109/TPS.2024.3474713
2024
-
[29]
DEVELOPMENT OF MULTIPURPOSE SOFT X-RAY TOMOGRAPHY SYSTEM FOR ADITYA-U
J. Raval, “DEVELOPMENT OF MULTIPURPOSE SOFT X-RAY TOMOGRAPHY SYSTEM FOR ADITYA-U.”
-
[30]
Mirnov coil data analysis for tokamak ADITYA,
D. Raju, R. Jha, P. K. Kaw, S. K. Mattoo, Y . C. Saxena, and A. Team, “Mirnov coil data analysis for tokamak ADITYA,” Pramana - J Phys, vol. 55, no. 5–6, pp. 727–732, Nov. 2000, doi: 10.1007/s12043-000-0039-8
-
[31]
Design and measurements of the diamagnetic loop in Aditya-U tokamak,
S. Aich et al., “Design and measurements of the diamagnetic loop in Aditya-U tokamak,” Radiation Effects and Defects in Solids, pp. 1–12, Aug. 2024, doi: 10.1080/10420150.2024.2378424
2024
-
[32]
The effect of impurity seeding on edge toroidal rotation in the ADITYA-U tokamak,
A. Kumar et al., “The effect of impurity seeding on edge toroidal rotation in the ADITYA-U tokamak,” Nucl. Fusion, vol. 64, no. 8, p. 086019, Aug. 2024, doi: 10.1088/1741-4326/ad4c5a
2024 doi
-
[33]
MHD mode evolutions prior to minor and major disruptions in SST-1 plasma,
J. Dhongde, S. Pradhan, and M. Bhandarkar, “MHD mode evolutions prior to minor and major disruptions in SST-1 plasma,” Fusion Engineering and Design, vol. 114, pp. 6– 12, Jan. 2017, doi: 10.1016/j.fusengdes.2016.10.015
2017 doi
-
[34]
Pre- disruption MHD activity in the LT-4 tokamak,
A. D. Cheetham, S. M. Hamberger, H. Kuwahara, A. H. Morton, and D. Vender, “Pre- disruption MHD activity in the LT-4 tokamak,” Nucl. Fusion, vol. 27, no. 5, pp. 843– 847, May 1987, doi: 10.1088/0029-5515/27/5/013
1987 doi
-
[35]
Observation of the bifurcation of tearing modes due to supersonic gas injected into the J-TEXT plasmas,
X. D. Feng, G. Zhuang, Z. J. Yang, J. S. Xiao, J. Chen, and X. W. Hu, “Observation of the bifurcation of tearing modes due to supersonic gas injected into the J-TEXT plasmas,” Physics Letters A, vol. 378, no. 16–17, pp. 1147–1152, Mar. 2014, doi: 10.1016/j.physleta.2014.02.017
2014 doi
Reviewed August 6, 2026 · model on record in the stance chip above.
Discussion (0). Continue with ORCID to comment.