REVIEW 4 major objections 5 minor 25 references
Comparative analysis of methods to estimate the tire/road friction coefficient applied to traffic accident reconstruction
T0 review · 4 major / 5 minor · reviewed 2026-08-14 · deepseek-v4-flash
Pith's one-line read A smartphone app can estimate the tire/road friction coefficient in braking tests as accurately as a professional accelerometer, the paper claims.
desk verdict A useful and well-motivated comparison of low-cost braking deceleration methods, but the manual stabilization-zone selection and garbled summary table make the headline equivalence provisional. read the letter →
The pith
A machine-rendered reading of the paper's core claim, the machinery that carries it, and where it could break.
The reading
What carries the argument
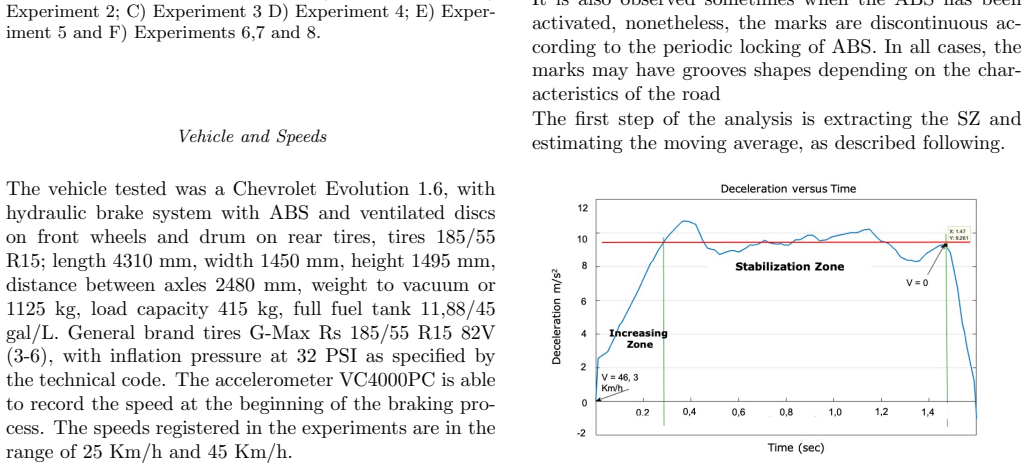
The load-bearing object is the Stabilization Zone: the flat portion of the deceleration-versus-time curve after the driver's initial brake application, where deceleration fluctuates around a constant expected value. The authors select this zone manually, smooth it with a moving average, and use the mean as the deceleration estimate. Three statistical tools carry the comparison: ANOVA F-tests for equality of means, simple linear regression for predicting accelerometer values from smartphone or video values, and t-distribution confidence intervals. The physical link to the friction coefficient is the elementary identity mu = a/g, which treats the stabilization-zone deceleration as constant under uniformly accelerated motion.
What would settle it
Re-run the same 89 braking-test traces through a blinded or automated stabilization-zone selection algorithm and recompute the ANOVA for smartphone versus accelerometer; if the F-statistic exceeds the critical value in any experiment, the reported equivalence depends on manual selection rather than on the sensors. A second check would be to repeat the comparison at speeds above 45 km/h or on another vehicle: if the means separate significantly, the claim is limited to the tested window.
Extended reading notes
Core claim
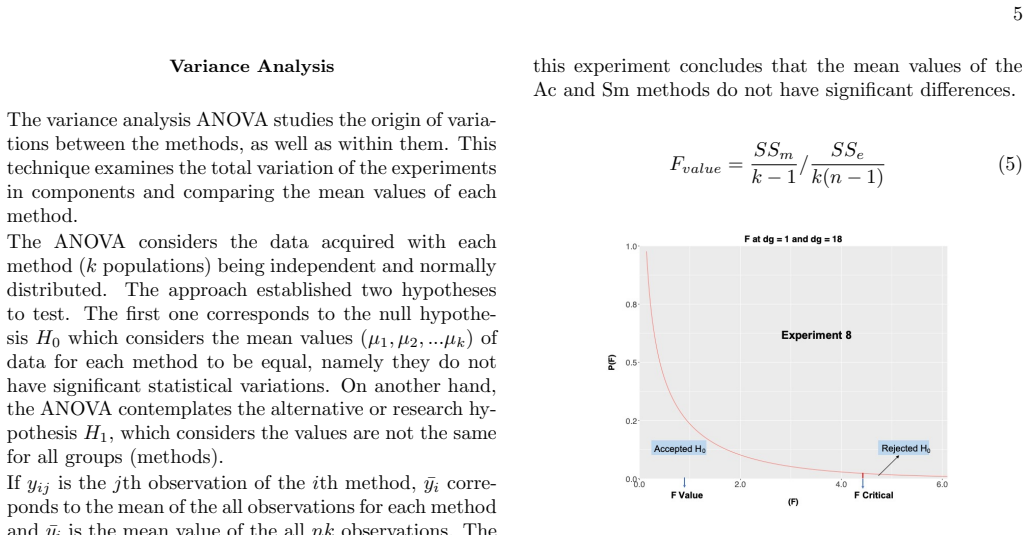
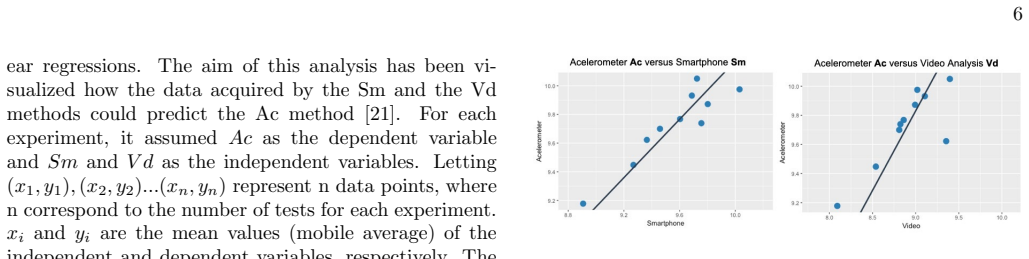
Using 89 braking tests in eight experiments, the authors compute a moving average over the manually selected stabilization zone of each deceleration trace and compare the mean values. An ANOVA F-test with alpha = 5% accepts the null hypothesis that smartphone and accelerometer means are equal for every experiment, with F_value below F_critical, while the accelerometer-versus-video comparison usually rejects the null hypothesis. Linear regressions of accelerometer values on smartphone or video values give R-squared close to 1 and small residual standard errors, and 95% t-confidence intervals are tabulated so the accelerometer value can be predicted from a smartphone measurement. The friction coefficient is then obtained as mu = a/g, reproducing initial speeds within about 2 km/h across the three methods. The paper concludes that the smartphone app provides good accuracy and no significant variance compared with the accelerometer, making it suitable for on-site accident reconstruction.
Load-bearing premise
The load-bearing premise is that the person analyzing the data chooses the flat part of the braking curve, where deceleration stops growing and fluctuates around a constant, in the same way and without bias for all three methods; if those boundaries are chosen differently for the phone, the accelerometer, and the video, the mean decelerations fed into the statistical comparison would be systematically shifted, and the claimed equivalence could be an artifact of the selection rather than of the sensors.
Editorial extensions
If this is right
- If the claim holds, a reconstruction expert with a smartphone can measure tire/road friction on site rather than importing a value from published tables for a different road.
- In several experiments, roughly four smartphone braking tests deliver the same quantity of information as one Vericom accelerometer test, so the cost savings are in hardware, not necessarily in the number of test runs.
- The 95% confidence intervals tabulated for each experiment let an expert convert a smartphone mean deceleration into a predicted accelerometer range for reconstruction calculations.
- Video analysis cannot match the accelerometer's precision directly, but its nearly perfect linear fit to accelerometer values means it can still be calibrated to estimate the accelerometer's deceleration.
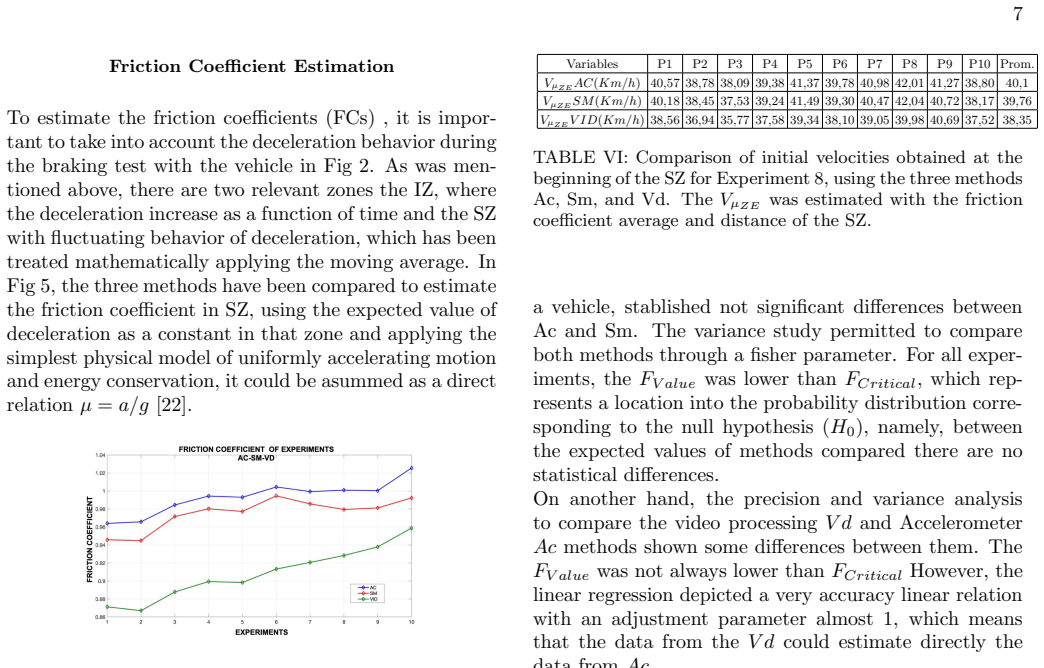
- Reconstructed initial braking speeds from all three methods agree within roughly 2 km/h in Experiment 8, suggesting the friction coefficient estimate is practically stable across methods.
Reading between the lines
- It is an inference, not the paper's claim, that the equivalence would survive on other vehicles, tire types, speeds outside 25-45 km/h, or roads with different macrotexture; the data cover one car and a modest speed window.
- Because the stabilization zone is selected manually, automating that selection with a change-point detector would be a natural test of whether the equivalence is robust or partly an artifact of consistent human judgment.
- The same protocol could be extended to compare the smartphone against other accepted friction measurement devices, such as pendulum testers or skid trailers, on wet or contaminated surfaces where friction varies more sharply.
- The quantity-of-information analysis suggests that raising the video frame rate should shrink the video method's precision gap relative to the accelerometer, though the paper does not derive the required frame rate.
Signed reviews
Editorial analysis
A structured set of objections, weighed in public.
Referee Report
Summary. The manuscript reports an experimental comparison of three methods for measuring vehicle deceleration during emergency braking—a Vericom VC4000PC accelerometer, the Kinetics Pro smartphone app, and Tracker-based video analysis—with all three recording simultaneously across eight experiments (about 89 braking tests, speeds 25–45 km/h) on Colombian roads. The authors manually extract the 'Stabilization Zone' (SZ) of each deceleration-time trace, compute a moving average to obtain a representative deceleration, and then compare methods by ANOVA, a precision/quantity-of-information analysis, linear regression, and confidence intervals, finally converting deceleration to friction coefficient as μ = a/g. The central claim is that the smartphone yields mean deceleration estimates with 'good accuracy' and no statistically significant variance compared with the accelerometer, whereas video analysis shows a good linear relation but significant variance in most experiments.
Significance. The practical question is important: if a smartphone app can match a reference accelerometer, low-cost friction measurement becomes feasible in low/middle-income settings. The experimental design is appropriate in broad outline: simultaneous data collection, an external reference instrument, and inferential statistics aimed at mean equivalence. However, the paper does not supply raw data, code, or a reproducible rule for the crucial SZ extraction; several aggregate tables contain impossible entries; and key regression/ANOVA results are only partially reported. The central equivalence claim is therefore plausible but not yet settled by the evidence presented.
major comments (4)
- [Estimation of Moving Average for Stabilization Zone SZ] The extraction of the SZ is described as manual: 'data were treatment manually, considering as the beginning of the SZ the point of the mean value where the fluctuations are concentrated,' and the moving-average window n in Eq. (1) is never specified. The SZ mean deceleration is the quantity that enters the ANOVA (Table IV), the precision analysis, the regressions, and the friction coefficient μ = a/g, so any analyst-dependent choice of SZ boundaries or window width can bias the comparison between methods. Braking deceleration is not flat (ABS cycling, road unevenness), and a small shift in the SZ can change μ by the same order as the reported between-method differences. Please provide a reproducible rule or code for SZ selection, state the window size n and its justification, and report a sensitivity analysis over SZ endpoints and window widths to show that the equivalence conclusion is robust.
- [Table II] Table II, which reports global statistical parameters for Experiment 8, contains internally impossible entries: for video analysis (Vd) the minimum deceleration is 10.9105 m/s² while the maximum is 6.0913 m/s², and the count is reported as 116.6, which cannot be a number of observations. Because these aggregate statistics are used to support the precision analysis and the claimed relationships, the tables must be corrected and the affected calculations re-run before the conclusions can be checked.
- [Variance Analysis and Regression Analysis] The ANOVA summary in Table IV is incomplete: Experiment 1 is missing, Ac–Vd columns are 'N/A' for Experiments 2 and 4, and Fcritical values are given without the corresponding degrees of freedom, sum of squares, or p-values; the table also appears to show 'EXP 1 Fvalue Fcritical FValue FCritical' as a header row rather than data. No checks for the ANOVA assumptions (normality, homogeneity of variance) are reported. Similarly, the Regression Analysis claims that 'R2 was always close to 1 and the RSE close to 0' for all experiments, but only Experiment 8 is shown and Eq. (8) for R2 is misspecified as written. Please report complete per-experiment ANOVA and regression results, including df, SS, MS, F, p-values, R², RSE, and the model (with or without intercept) actually fitted.
- [Friction Coefficient Estimation] The friction coefficient is estimated as μ = a/g from the SZ mean deceleration, and Table VI reports initial velocities computed from those friction coefficients. The text itself states that 'is important to make more rigorous calculations including the propagation of the errors,' yet no uncertainty is attached to the friction coefficients or to the velocities in Table VI. Since the application target is accident reconstruction, the practical claim requires error propagation (or at least a statement of typical uncertainty) for μ and for derived speeds; without it the reported agreement to within 2 km/h is not quantitatively interpretable.
minor comments (5)
- [Throughout] Throughout the text, 'Tacker' should be 'Tracker' and there are numerous typographical errors ('desaceleration', 'acelerometer', 'dont', 'aand'); the manuscript needs careful proofreading.
- [Eq. (1)] Eq. (1) is not a well-formed mathematical definition as printed: the summation index and limits are inconsistent, and the window size n is not defined in context; please rewrite it with explicit summation limits.
- [Precision Analysis and Conclusion] The precision metric is called 'IQ' in Table III and the text but 'IC' in the Conclusion; please use one symbol consistently and define it once.
- [Confidence Intervals] The confidence-interval interpretation 'at least 9 of 10 expected values for Ac fall within the intervals' is a misstatement of a 95% confidence interval; a 95% CI is a random interval that covers the true parameter with probability 0.95.
- [Table I] Table I's 'Level of Confidence 95%' column appears to be a half-width rather than a confidence level; please clarify the label and, if it is a half-width, state this explicitly.
Circularity Check
Minor in-sample regression is presented as prediction; the central smartphone-versus-accelerometer comparison is externally benchmarked and not circular.
-
fitted input called prediction
[Results, 'Regression Analysis' (Eqs. 6-9, Fig. 4)]
"The aim of this analysis has been visualized how the data acquired by the Sm and the Vd methods could predict the Ac method. ... R2 is close to 1, which means, the adjust is almost perfect. On another hand the RSE is very small, verifying the good accuracy of the fitting. Therefore, this analysis presents that the mean values distribution obtained with Ac could be estimated by Sm and Vd methods with very good accuracy."
The regression coefficients are fitted to the same experiment-level mean decelerations that are then used to compute R2 and RSE; no held-out data or cross-validation is used. Thus the reported 'accuracy' of estimating Ac from Sm/Vd is an in-sample goodness-of-fit, forced by the least-squares fit, not an independent predictive check. The language 'could predict the Ac method' and 'could be estimated... with very good accuracy' presents this fitted relationship as a predictive capability, but the demonstrated quantity (R2 close to 1, RSE small) is by construction a measure of how well the fitted line reproduces the training points.
full rationale
The core comparison is not circular: the smartphone and video decelerations are measured simultaneously with a Vericom VC4000PC accelerometer as an external reference, and the main equivalence claim rests on an ANOVA of those independent measurements. No load-bearing result is imported from the authors' prior work; citations [18] and [21] are standard statistical references, and the CEIRAT protocol is procedural rather than a source of the empirical equivalence. The only circular element identified is secondary: the regression analysis fits Ac as a function of Sm/Vd on the same experiment-level mean values and then reports the in-sample R2/RSE as 'good accuracy' for estimating Ac, which is a fitted-input-called-prediction rather than an out-of-sample validation. Separate data-quality problems (e.g., Table II lists a minimum of 10.91 m/s2 with a maximum of 6.09 m/s2 and fractional counts) and the unreproducible manual Stabilization-Zone selection are correctness/reproducibility concerns, not derivation circularity. Overall, the central claim retains independent empirical content, so the circularity score is low.
Assumptions & free parameters
free parameters (1)
- moving average window size n =
not specified
assumptions (4)
- domain assumption The deceleration in the Stabilization Zone is approximately constant, so the friction coefficient can be estimated as mu = a/g.
- domain assumption The Vericom VC4000PC accelerometer provides ground-truth deceleration values.
- domain assumption The smartphone's longitudinal accelerometer axis is aligned with the vehicle's direction of travel throughout the braking test.
- standard math The observations within each method are independent and normally distributed with homogeneous variances.
Cite this review
Pith. "Pith review of Comparative analysis of methods to estimate the tire/road friction coefficient applied to traffic accident reconstruction." pith.science (2026). https://pith.science/paper/GNAHAM6S
@misc{pith2026190807952,
  author       = {Pith},
  title        = {Pith review of: Comparative analysis of methods to estimate the tire/road friction coefficient applied to traffic accident reconstruction},
  year         = {2026},
  howpublished = {\url{https://pith.science/paper/GNAHAM6S}},
  note         = {Machine review of arXiv:1908.07952}
}
read the original abstract
The measure of the friction factor in the location of the event is very important to get accurate inputs to model the accident, as the friction factor depends on environmental conditions and the dynamics of the event. In some low-middle income countries, accident reconstruction experts, usually don't have the feasibility to acquire expensive equipment as high precision accelerometers; therefore, it is important to identify a low-cost method that provides data quality comparable with high precision equipment. This study presents a comparison of three methods: VC4000PC accelerometer, sensor kinetics mobile app and video analysis by tracker (free software). The methods have been compared experimentally for emergency braking with blocked wheel, as well as using ABS. Data from the three methods were recorded simultaneously. Data analysis was made applying inferential statistics. The results indicate that the data collected with the smartphone app ensure good accuracy and does not provide significant variance in comparison with the accelerometer. On the other hand, the data obtained by video analysis shows a good linear relationship with the accelerometer; however, it shows some statistical evidence of differences related to precision and variances in comparison with accelerometer device. The confidence interval, absolute error, and other estimators have been obtained for the smartphone method, to promote the optimal using by the experts to get parameters on site and apply to a traffic accident reconstruction.
Figures

Figures from the paper (3 more)

Reference graph
Works this paper leans on
-
[1]
R. W. Rivers, Technical Traffic Crash Investigators Handbook, 978-0-398-08399-1 (Charles C Thomas Pub- lisher LTD, Springfield Illinois, 2010), 3rd ed
work page 2010
-
[2]
Journal of Traffic and Transportation Engineering (En- glish Edition) 2, 3 (2015)
work page 2015
-
[3]
J. A. Cabrera, J. J. Castillo, J. Perez, J. M. Velasco, A. J. Guerra, and H. Pedro, Sensors 3 (2018)
work page 2018
- [4]
- [5]
- [6]
-
[7]
L. B. Fricke and J. S. Baker, Traffic Accident Investiga- tion Manual , Northwestern University Traffic Institute, Evaston, Illinois 60204, first edition ed. (1990)
work page 1990
-
[8]
The begging to the end of the braking maneuver is observed. Two sections can be identified. The first section called here as Increasing Zone IZ corresponds to the deceleration (related to the friction coefficient) starting from 0 until a mean value of deceleration (red curve) at the reaction time of the driver (green curve). This zone represents the first mome...
work page 1952
Show all 25 references
-
[9]
Raymond M., R
B. Raymond M., R. Donald F., and D. W. Sallmann, SAE TECHNICAL PAPER SERIES (1998)
1998
-
[10]
Bedsworth, R
K. Bedsworth, R. Butler, G. Rogers, K. Breen, and W. Fischer, SAE International p. 20 (2013)
2013
-
[11]
J. A. G. Monsoriu, B. Marcos H, S. R. Enrique, C. P. Luis Manuel, and V. L. Juan C, in Innovaciones en In- genier´ ıa de Educaci´ on, Investigaci´ on y Tecnolog´ ıa de la Informaci´ on(2014)
2014
-
[12]
Vieyra, C
R. Vieyra, C. Vieyra, P. Jeanjacquot, A. Mart´ ı, and M. Monteiro, 082 (2015)
2015
-
[13]
Bruwer and M
F. Bruwer and M. Booysen, Vehicle acceleration estima- tion using smartphone-based sensors
-
[14]
D. F. Avila Pesantez, J. G. Vizuete Salazar, and R. P. Humanante, Earthquakes detection using accelerometer of smartphones (2016)
2016
-
[15]
G´ omez and B
F. G´ omez and B. Hector, Trabajo final magister en esne˜ nanza de las ciencias exactas y naturales, Universi- dad Nacional de Colombia, Facultad de Ciencias Bogot´ a Colombia (2016)
2016
-
[16]
Navarrete, J
L. Navarrete, J. F. Almaguer, F. Navarrete, and M. Fl´ orez, Physics Education9, 8 (2015)
2015
-
[17]
Ramli, K
H. Ramli, K. T. Chan, and Y. W. Fen, 24, 297 (2016)
2016
-
[18]
Torres Z´ uniga, Revista de Ciencias Forenses de Hon- duras 3, 9 (2017)
V. Torres Z´ uniga, Revista de Ciencias Forenses de Hon- duras 3, 9 (2017)
2017
-
[19]
Baena, Dise˜ no de experimentos en investigaci´ on agropecuaria (2012)
D. Baena, Dise˜ no de experimentos en investigaci´ on agropecuaria (2012)
2012
-
[20]
I. O. Standardization, International Standard (2007)
2007
-
[21]
International, Tech
S. International, Tech. Rep. J2505-201008, SAE Interna- tional (2010)
2010
-
[22]
Baena, Investigaci´ on de Operaciones(2010)
D. Baena, Investigaci´ on de Operaciones(2010)
2010
-
[23]
Drag Factor And Coefficient of Friction in Traffic Acci- dent Reconstruction (????)
-
[24]
org/tracker/, accessed: 2019-08-11
Tracker video analysis modeling tool, https://physlets. org/tracker/, accessed: 2019-08-11
2019
-
[25]
Vericom Computers, VERICOM VC4000PC AND BRAKE METER OWNERS MANUAL , Vericom Com- puters, www.vericomcomputer.com (2013)
I. Vericom Computers, VERICOM VC4000PC AND BRAKE METER OWNERS MANUAL , Vericom Com- puters, www.vericomcomputer.com (2013)
2013
Reviewed August 14, 2026 · model on record in the stance chip above.
Discussion (0). Continue with ORCID to comment.