REVIEW 3 major objections 3 minor 37 references
Stars at High Spatial Resolution
T0 review · 3 major / 3 minor · reviewed 2026-08-14 · deepseek-v4-flash
Pith's one-line read A future space interferometer with 0.5–1 km baselines would image stellar surfaces and their dynamic processes at 0.1 milliarcsecond resolution.
desk verdict A well-written advocacy whitepaper for a space UV-optical interferometer; no new science, plausible but unquantified case, and a real sensitivity gap. read the letter →
The pith
A machine-rendered reading of the paper's core claim, the machinery that carries it, and where it could break.
The reading
What carries the argument
The load-bearing instrument is the Long-Baseline Space Interferometer (LBSI): an array of roughly 30 co-phased telescopes spread over 0.5–1.0 km and designed for UV-optical spectral imaging at about 0.1 milliarcsecond resolution. Since resolution scales as $\lambda/D$, a 500 m baseline at UV-optical wavelengths reaches angular scales that would require a monolithic aperture far larger than any feasible single telescope. The scientific mechanism is spectral imaging: resolving emission lines such as C IV and Mg II in hot-star winds, Lyman-$\alpha$-fluoresced H2 in protoplanetary disks, and the Mg h and k lines in pulsating atmospheres across the stellar disk, so that surface structures, shocks, and winds can be tied together observationally. The paper's simulations, including a 500 m baseline view of supergiant convection at 2 kpc, show the expected product: a few giant convection cells covering the disk and evolving on a timescale of about a year.
What would settle it
Perform the signal-to-noise calculation for the proposed 30-element, 500 m baseline array detecting Lyman-alpha-fluoresced H2 emission from a T Tauri star at 50 pc in a single 0.1 milliarcsecond resolution element within the stated minutes-to-hours exposure: if the photon count is insufficient, the promised sub-milliarcsecond observations are not achievable, and the science case collapses.
Extended reading notes
Core claim
The paper's central claim is that sub-milliarcsecond UV-optical spectral imaging with a Long-Baseline Space Interferometer (LBSI) with baselines of 0.5–1.0 km would be a leap in stellar physics comparable to the resolution gain from early telescopes to modern space observatories. At 0.1 milliarcsecond resolution, a roughly 30-element array could resolve stellar disks and their immediate surroundings in spectral lines, letting observers connect surface activity to outflows, winds, and circumstellar structure in both space and time. The paper surveys seven science areas, from protoplanetary disks to novae and supernovae, and argues that each is limited today by angular resolution rather than by theory or data. It concludes that this capability can be provided only by long-baseline interferometers or sparse-aperture telescopes in space, because the synthetic aperture must exceed 500 m and the key diagnostic radiation is in the UV, which the ground cannot observe.
Load-bearing premise
The central claim depends on the feasibility of building, launching, and operating a roughly 30-element, 0.5–1.0 km space interferometer that stays stable enough for sub-milliarcsecond UV spectral imaging, and the paper supplies no engineering demonstration, cost analysis, or technology roadmap for that facility.
Editorial extensions
If this is right
- In young stellar systems, the inner edge of the gas disk and the accretion hot spots on T Tauri and Herbig Ae stars, out to about 160 pc, become directly imageable, enabling tests of accretion geometry and disk–star coupling.
- In hot stars, tracking spots and wind features across the disk can test whether discrete absorption components are corotating interaction regions, and can measure Be-star disk inclination, density structure, and the wind/disk interaction.
- In pulsating stars, direct images of shocks propagating through the atmospheres of Miras, Cepheids, hot B stars, and other pulsators would constrain non-radial pulsation models and diagnose angular momentum profiles.
- In evolved cool stars, convection cells on red supergiants at kiloparsec distances can be imaged and followed over months to years, connecting surface granulation to chromospheric fields and mass loss.
- For explosive events, the early expansion geometry of galactic novae and supernovae at a few Mpc can be resolved, testing symmetry and fragmentation of the ejecta.
Reading between the lines
- A consequence the paper leaves implicit is that spatially resolved UV spectra of a host star would tie individual active regions to the actual UV/EUV flux and wind hitting an exoplanet, replacing time-averaged habitability proxies with per-region measurements.
- The paper's resolution-versus-distance framework can be inverted into a target-selection tool: any young star whose corotation radius subtends more than 0.1 milliarcsecond becomes a candidate for direct accretion-spot imaging, and such a list can be compiled from existing stellar parameters.
- The science case effectively writes a mission requirements document, including baseline length, aperture, UV bandpass, and a weeks-to-months repeat cadence; the missing piece is a technology demonstration that optical paths can be stabilized over kilometre baselines, which the paper does not provide.
- The same facility would naturally extend to measuring differential rotation and magnetic-field topology on any nearby resolved star, so the listed science cases are likely a lower bound on the return.
Signed reviews
Editorial analysis
A structured set of objections, weighed in public.
Referee Report
Summary. The paper, an Astro2020 science whitepaper, argues that a future Long-Baseline Space Interferometer (LBSI) with 0.5–1.0 km baselines will achieve 0.1 milliarcsecond UV/Optical spectral imaging, enabling a 'quantum leap' in stellar astrophysics. It surveys science cases in young stellar objects, hot stars, pulsation, cool evolved stars, active dwarfs, and novae/supernovae, and includes simulated observations of a T Tauri inner disk and a red supergiant's convection. The abstract claims that such observations require space-based interferometers because monolithic apertures in excess of 500 m are infeasible and because UV is inaccessible from the ground.
Significance. If the assumed capability exists, the scientific payoff is substantial: direct imaging of stellar surfaces, accretion shocks, magnetic fields, winds, and convection cells would address long-standing questions in stellar evolution, mass loss, and exoplanet habitability. The paper identifies concrete, falsifiable predictions, such as the geometry of T Tauri accretion footprints, the disk structure of Be stars, and the convective cell scale on supergiants, and it is grounded in the current literature. However, the science case is entirely conditional on the feasibility of a facility whose sensitivity is not quantified; the paper therefore has high scientific potential but currently lacks the quantitative support needed to establish that the proposed observations can actually be performed.
major comments (3)
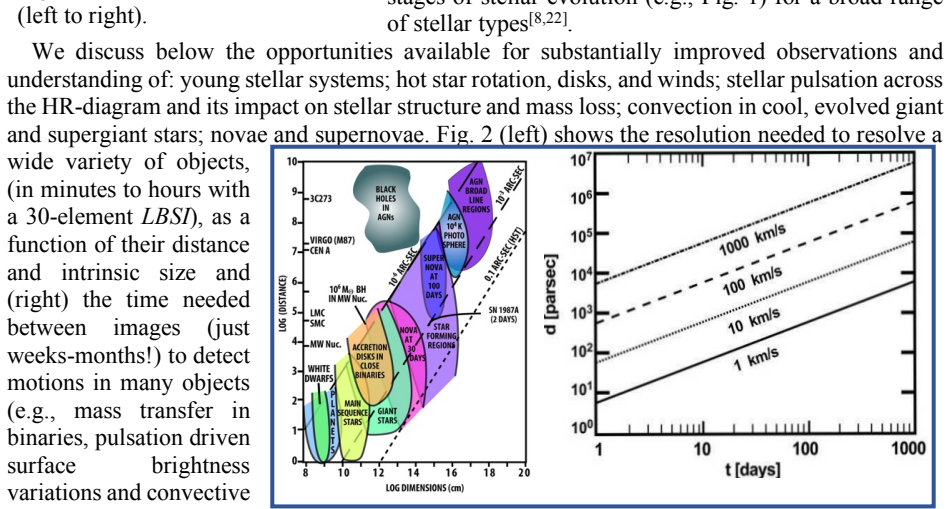
- [Section 2, Fig. 2] The central performance claim, that a 30-element LBSI can image the objects in Fig. 2 'in minutes to hours,' is not supported by any sensitivity or exposure-time calculation. The time to reach a given signal-to-noise ratio depends on total collecting area, throughput, spectral resolution, uv coverage, and source brightness, none of which are specified. For example, the T Tauri inner-disk simulation at 50 pc (Sec. 3) and the red supergiant simulation at 2 kpc (Fig. 4) are presented without an assumed integration time, spectral line flux, or noise model. Because many proposed programs require sampling over timescales from minutes to months, an order-of-magnitude sensitivity estimate (or a reference to a detailed instrument study) is necessary to support the claimed feasibility of the science case.
- [Abstract] The statement that 'aperture diameters required are in excess of 500 m' conflates angular resolution with sensitivity. The 0.1 mas resolution is set by the interferometric baseline, not by the diameter of a filled aperture; a 30-element sparse array with individual apertures of a few meters collects far less light than a 500 m filled aperture. The paper should distinguish the resolution requirement from the sensitivity requirement and state the assumed element diameters and total collecting area explicitly, otherwise the feasibility argument is misleading.
- [Figures 3 and 4] The simulated observations appear to assume a 500 m baseline but do not specify the array configuration, spectral bandpass, spectral resolution, integration time, or noise model used to generate them. As presented, these figures illustrate spatial sampling but do not demonstrate that the science goals can be achieved with realistic photon counts. Since the paper's programs depend on repeated imaging on dynamical timescales, a more quantitative description of the simulations is needed to support the stated capabilities.
minor comments (3)
- [Section 2] The phrase 'jet for-mation' contains a hyphenation error; it should read 'jet formation.'
- [References] Reference [22] (Labeyrie et al. 2008, Experimental Astronomy) is missing the article title and page range; please provide a complete citation.
- [Throughout] The paper would benefit from a summary table listing the assumed LBSI parameters (number of elements, aperture diameter, wavelength range, spectral resolution, and sensitivity) and the corresponding requirements for each science case; this would greatly improve transparency without requiring full engineering analysis.
Circularity Check
No circularity: this is an advocacy whitepaper stating science goals and facility requirements, not a derivation whose outputs reduce to its inputs.
full rationale
No circular step can be exhibited. The paper does not derive quantitative predictions from fitted data; it argues that a future long-baseline space interferometer would deliver sub-mas UV imaging and lists the stellar-astrophysics questions such imaging could address. The claim that 0.1 mas resolution requires baselines exceeding 500 m follows from the diffraction limit at UV wavelengths, not from a fitted parameter or from the paper's own inputs. Statements such as 'in minutes to hours with a 30-element LBSI' in Figure 2 are unsupported sensitivity claims, which is a feasibility and completeness concern, not circularity. The authors do cite their own previous mission concepts (Carpenter et al. 2008 and Labeyrie et al. 2008), but these are contextual references for the interferometer concept and the science goals are independently motivated by known open problems and external observations, so the self-citations are not load-bearing in any derivation. Because the paper is self-contained as a science-case proposal and contains no fitted-input-as-prediction structure, the circularity score is 0.
Assumptions & free parameters
assumptions (4)
- domain assumption A space-based long-baseline interferometer with baselines of 0.5-1.0 km can achieve 0.1 milliarcsecond resolution in the UV-optical and collect sufficient light for spectral imaging of stellar surfaces.
- domain assumption Ultraviolet observations of stars require a space-based observatory because the required aperture is unavailable from the ground and UV is blocked by the atmosphere.
- domain assumption Direct sub-mas spectral imaging will resolve the physical processes (accretion, convection, pulsation, winds, etc.) in the specific stars and regions discussed.
- domain assumption Exoplanet habitability depends on host star UV, EUV, and X-ray emission and winds.
Cite this review
Pith. "Pith review of Stars at High Spatial Resolution." pith.science (2026). https://pith.science/paper/GYCVXO5Y
@misc{pith2026190805665,
  author       = {Pith},
  title        = {Pith review of: Stars at High Spatial Resolution},
  year         = {2026},
  howpublished = {\url{https://pith.science/paper/GYCVXO5Y}},
  note         = {Machine review of arXiv:1908.05665}
}
read the original abstract
We summarize some of the compelling new scientific opportunities for understanding stars and stellar systems that can be enabled by sub-milliarcsec (sub-mas) angular resolution, UV-Optical spectral imaging observations, which can reveal the details of the many dynamic processes (e.g., evolving magnetic fields, accretion, convection, shocks, pulsations, winds, and jets) that affect stellar formation, structure, and evolution. These observations can only be provided by long-baseline interferometers or sparse aperture telescopes in space, since the aperture diameters required are in excess of 500 m (a regime in which monolithic or segmented designs are not and will not be feasible) and since they require observations at wavelengths (UV) not accessible from the ground. Such observational capabilities would enable tremendous gains in our understanding of the individual stars and stellar systems that are the building blocks of our Universe and which serve as the hosts for life throughout the Cosmos.
Figures


Figures from the paper (1 more)

Reference graph
Works this paper leans on
- [1]
-
[2]
Ardila, D.R. et al. 2013, ApJS, 207, 1
work page 2013
- [3]
-
[4]
Aurière, M. et al. 2015, A&A, 574, 90
work page 2015
-
[5]
Blondin, J.M., Lundqvist, P., and Chevalier, R.A. 1996, ApJ, 472, 257
work page 1996
-
[6]
Brown, J.C., Telfer, D., Li, Q., Hanuschik, R., Cassinelli, J.P., and Kholtygin, A. 2004, MNRAS 352, 1061
work page 2004
-
[7]
Calvet, N., Muzerolle, J., Briceño, C., Hernández, J., Hartmann, L., Saucedo, J.L., and Gordon, K.D. 2004, AJ, 128, 1294
work page 2004
-
[8]
Carpenter, K.G., Schrijver, C.J., Karovska, M., SI Study Team. 2008, “SI – The Stellar Imager”, in NASA Space Science Vision Missions, ed. M. Allen, (Progress in Astronautics and Aeronautics, vol. 224, pp. 191-227; AIAA)
work page 2008
Show all 37 references
-
[9]
David-Uraz, A. et al. 2017, MNRAS, 470, 3672
2017
-
[10]
Donati, J.-F. et al. 2011, MNRAS, 417, 472
2011
-
[11]
Donati, J.-F. et al. 2011, MNRAS, 417, 1747
2011
-
[12]
2013, EAS, 62, 289
Donati, J.-F. 2013, EAS, 62, 289
2013
-
[13]
Dupree, A.K. et al. 2005, ApJ, 625, L131
2005
-
[14]
& Kaper, L
Fullerton, A. & Kaper, L. 1995, Hot/Massive Star Newslet. #15, http://www.astroscu.unam.mx/massive_stars/
1995
-
[15]
1995, ApJ, 442, 296
Gayley, K.G., Owocki, S.P., and Cranmer, S.R. 1995, ApJ, 442, 296
1995
-
[16]
& Dupree, A.K
Gilliland, R.L. & Dupree, A.K. 1996, ApJ, 463, L29
1996
-
[17]
1993, MNRAS, 262, L7
Glatzel, W., Kiriakidis, M., and Fricke, K.J. 1993, MNRAS, 262, L7
1993
-
[18]
2005, ApJ, 630, 958
Grady, C.A., et al. 2005, ApJ, 630, 958
2005
-
[19]
2007, A&A, 475, 607
Grosso, N., Bouvier, J, Montmerle, T., Fernandez, M., Grankin, K., and Osorio, M.R.Z. 2007, A&A, 475, 607
2007
-
[20]
1998, ApJ, 505, 910
Ignace, R., Cassinelli, J.P., and Bjorkman, J.E. 1998, ApJ, 505, 910
1998
-
[21]
Winds from hot stars
Kudritzki, R.-P., and Puls, J. 2000, “Winds from hot stars”, Ann. Rev. Astron. Ap., 38, 613
2000
-
[22]
2008, Experimental Astronomy, 48
Labeyrie, A., et al. 2008, Experimental Astronomy, 48
2008
-
[23]
Wolf-Rayet Phenomena in Massive Stars and Starburst Galaxies
Lepine, S. & Moffat, A.F.J. 1999, “Wolf-Rayet Phenomena in Massive Stars and Starburst Galaxies”, 193, 250
1999
-
[24]
and Meynet, G
Maeder, A. and Meynet, G. 2008, Rev. Mex. A y A Conf. Series, 33, 38-43
2008
-
[26]
and Parr, A.M
Oudmaijer, R.D. and Parr, A.M. 2010, MNRAS, 405, 2439
2010
-
[27]
2018 Nature
Paladini, C., et al. 2018 Nature. 553..310P
2018
-
[28]
2013, ApJ, 765, 2
Peters, G.J., et al. 2013, ApJ, 765, 2
2013
-
[29]
2016, ApJ, 828, 47
Peters, G.J., Wang, L., Gies, D.R., & Grundstrom, E.D. 2016, ApJ, 828, 47
2016
-
[30]
2013, A&AR, 21, 69
Rivinius, T., Carciofi, A.C., and Martayan, C. 2013, A&AR, 21, 69
2013
-
[31]
1995, ApJ, 442, L25
Rosner, R., Musielak, Z.E., Cattaneo, F., Moore, R.L., and Suess, S.T. 1995, ApJ, 442, L25
1995
-
[32]
Schrijver, C. J. and Pols, O.R. 1993, A&A, 278, 51, (Erratum in A&A, 293, 640 (1995))
1995
-
[33]
2001, ApJ, 548, 1029
Shu, F.H., Shang, H., Gounelle, M., Glassgold, A.E., and Lee, T. 2001, ApJ, 548, 1029
2001
-
[34]
2017, https://arxiv.org/abs/1702.05898
Sokoloski, J.L., et al. 2017, https://arxiv.org/abs/1702.05898
2017 arXiv
-
[35]
Tatulli, E. et al. 2007, A&A 464, 55
2007
-
[36]
2003, MNRAS, 340, 1020
Townsend, R.H.D. 2003, MNRAS, 340, 1020
2003
-
[37]
2014, IAUS, 302, 389
Vlemmings, W.H.T. 2014, IAUS, 302, 389
2014
-
[38]
2018, ApJ, 853, 156
Wang, L., Gies, D.R., & Peters, G.J. 2018, ApJ, 853, 156
2018
Reviewed August 14, 2026 · model on record in the stance chip above.
Discussion (0). Continue with ORCID to comment.