Inferring and Predicting Clade-Level Relative Transmission Fitness in Seasonal Influenza A Using Differential Population Growth Rate and Deep Learning
Pith reviewed 2026-06-26 10:02 UTC · model grok-4.3
The pith
Differential population growth rates from GISAID sequences measure relative transmission fitness of influenza clades, which genome-trained neural networks can predict at R² above 0.95.
A machine-rendered reading of the paper's core claim, the machinery that carries it, and where it could break.
Core claim
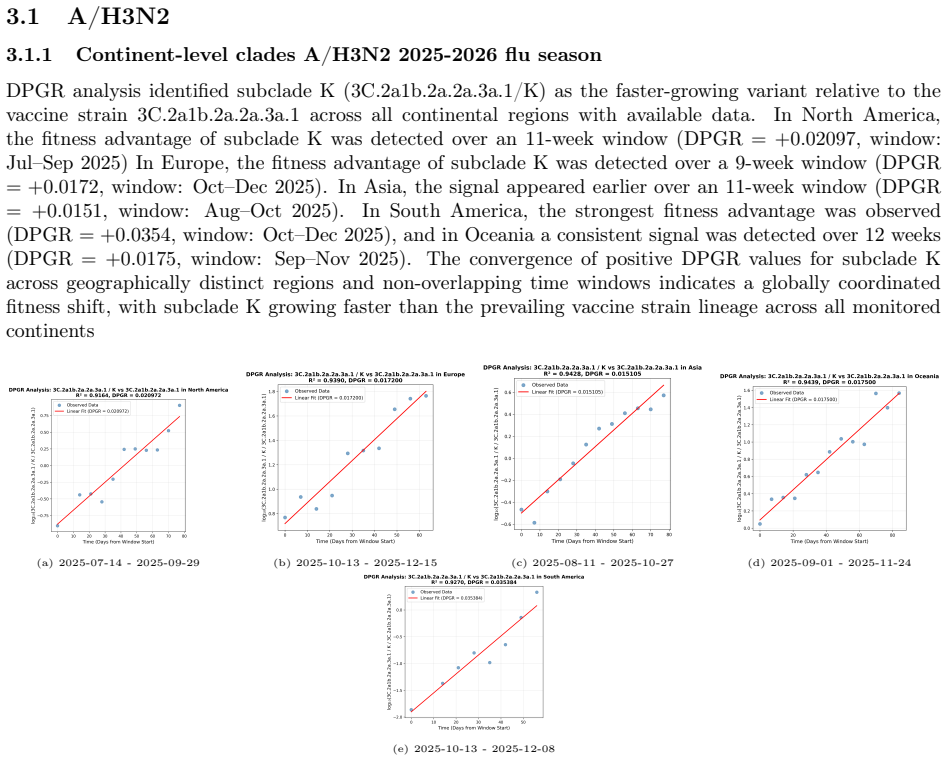
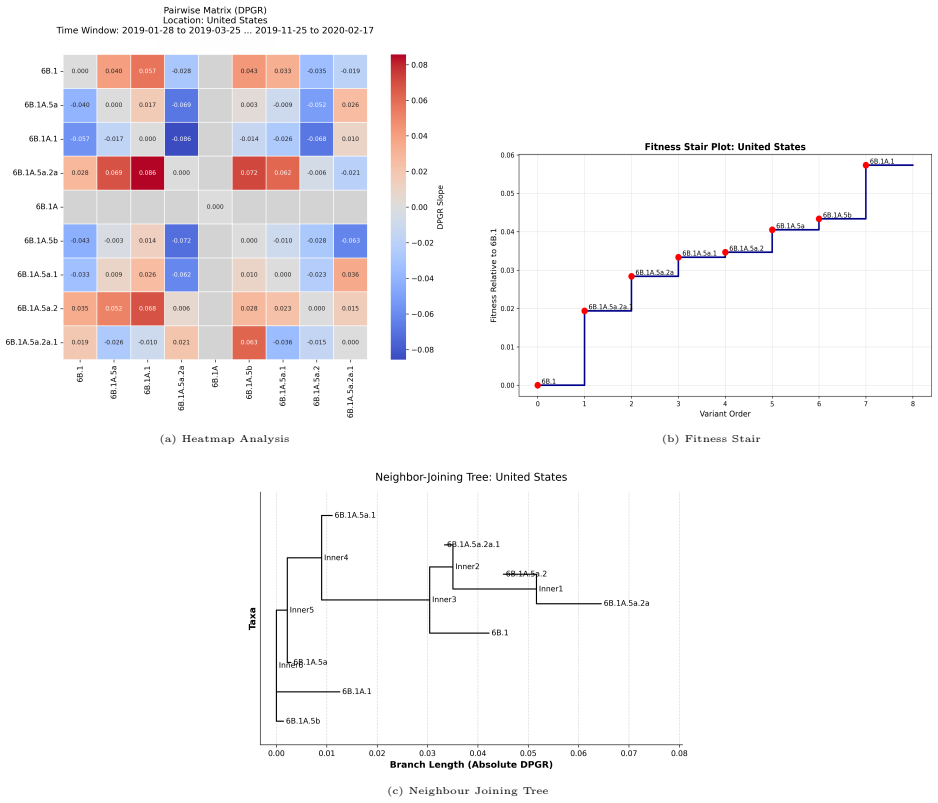
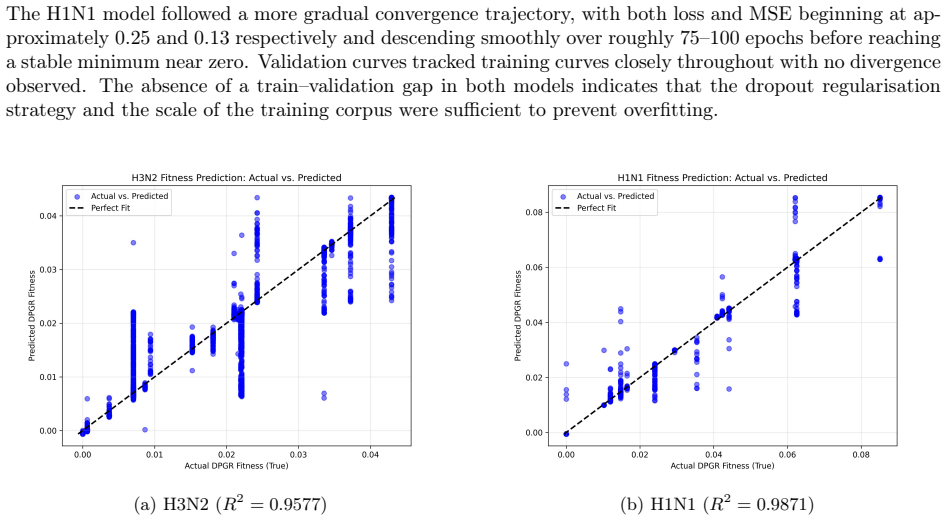
DPGR recovers recurrent lineage turnover in both subtypes and consistently identifies the emerging H3N2 subclade K as fitter than the 2025-2026 vaccine-lineage background across multiple regions. Genome-based models predict DPGR accurately for H3N2 (R² = 0.9577) and H1N1 (R² = 0.9871), while interpretation highlights known haemagglutinin antigenic sites together with contributions from internal genes. These results support DPGR as an interpretable surveillance signal and show that influenza fitness can be linked to genomic prediction and biological interpretation in a unified framework.
What carries the argument
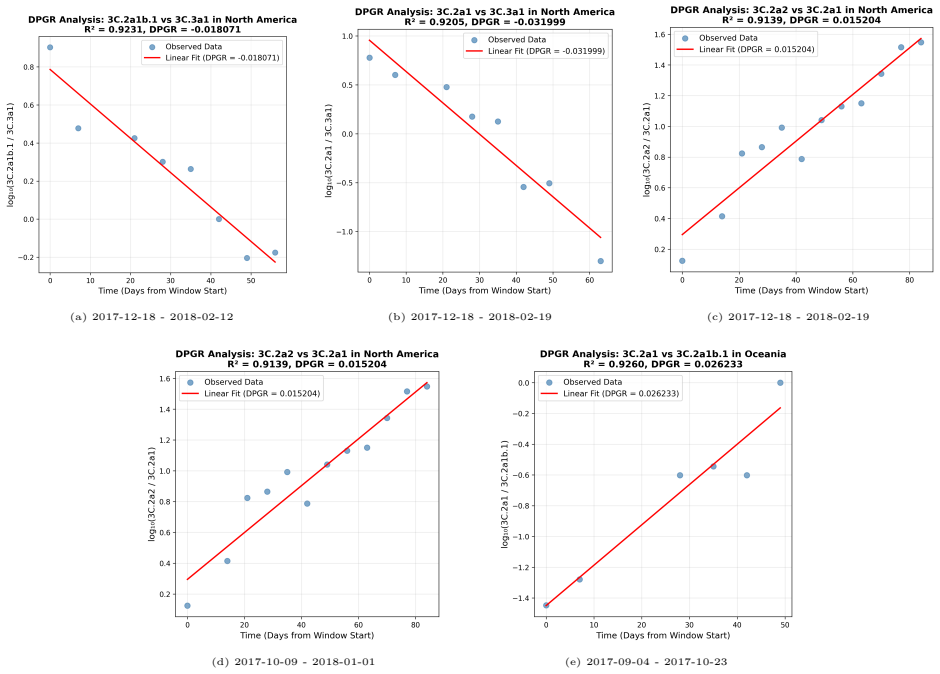
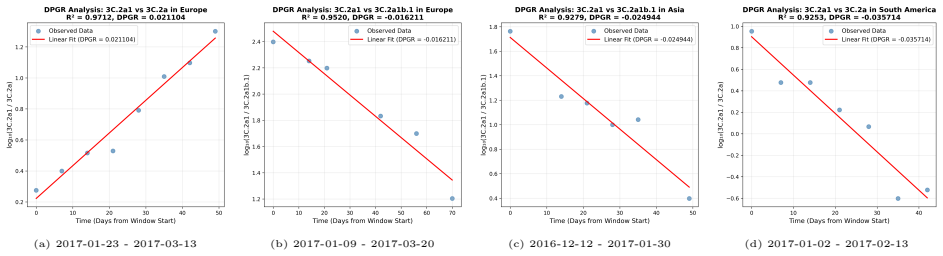
Differential Population Growth Rate (DPGR) computed via sliding-window regression on clade frequencies in GISAID sequence data, which quantifies relative transmission fitness among co-circulating clades.
If this is right
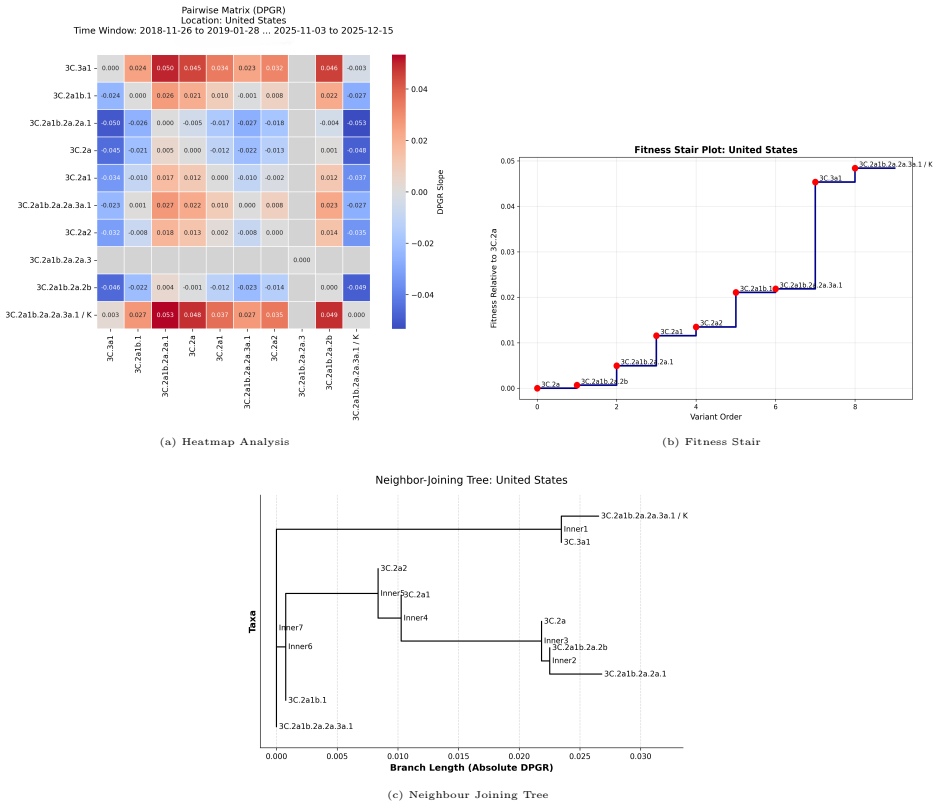
- DPGR identifies the emerging H3N2 subclade K as fitter than the vaccine background across continents and the United States.
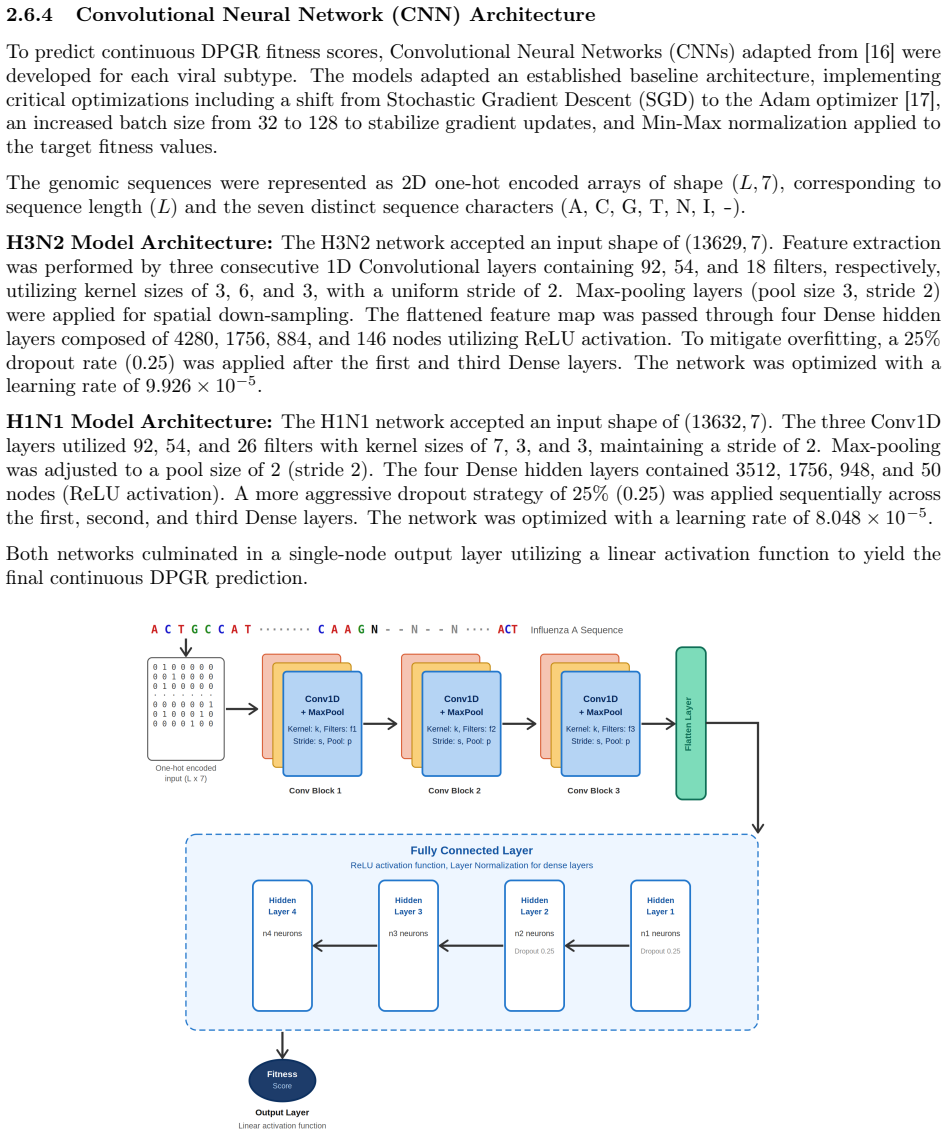
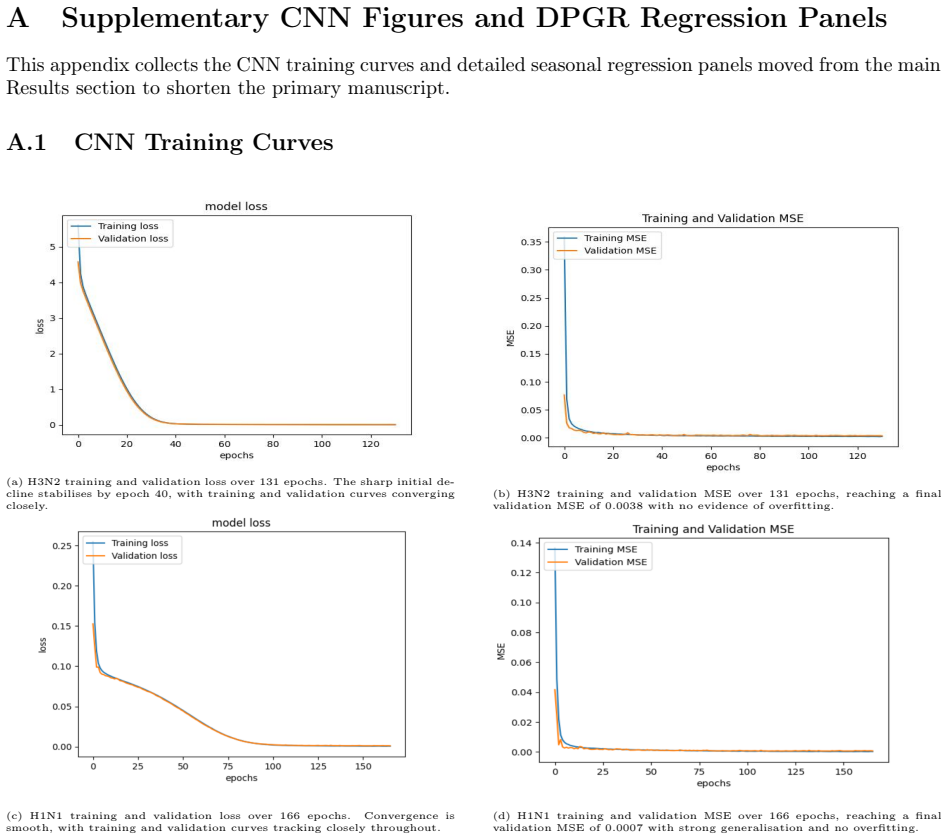
- Subtype-specific convolutional neural networks achieve R² values of 0.9577 for H3N2 and 0.9871 for H1N1 when predicting DPGR from complete genomes.
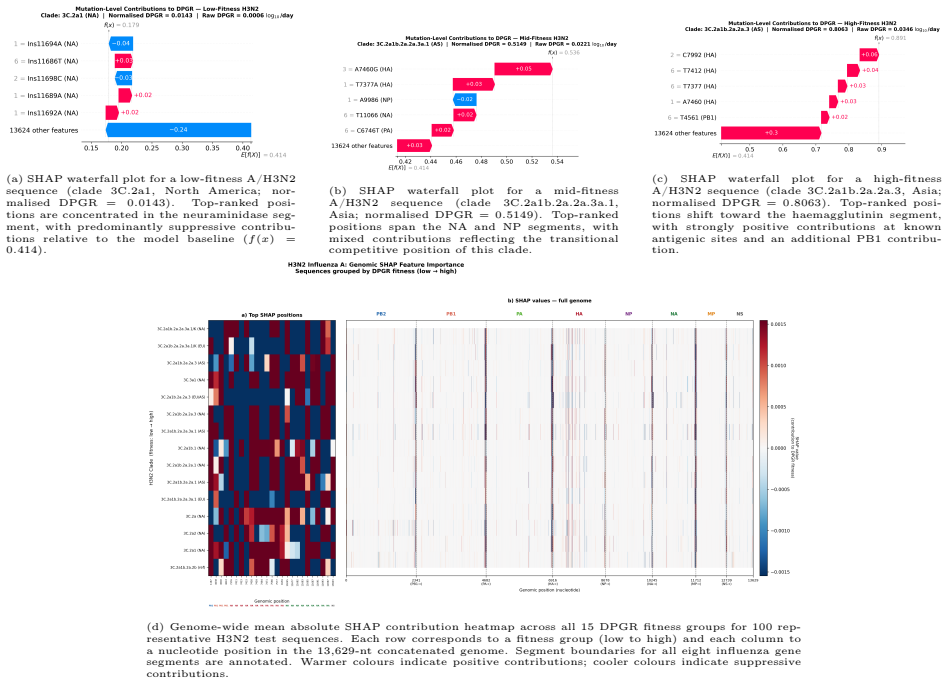
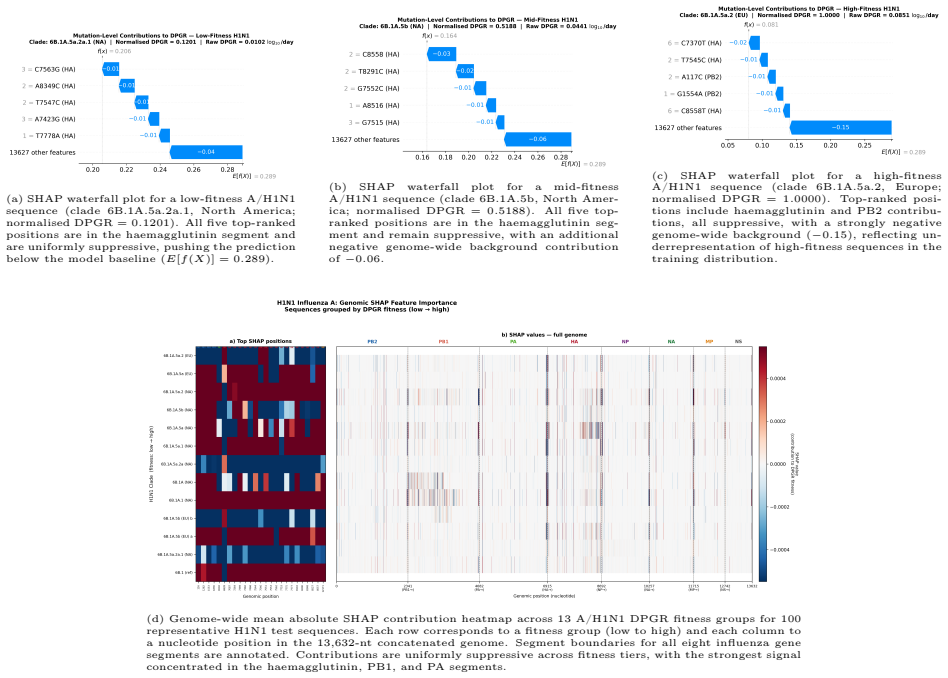
- SHAP values localize fitness contributions to known haemagglutinin antigenic sites and to internal genes.
- The combined DPGR-plus-genomic-prediction approach recovers known lineage replacements and flags future turnovers before they appear in case surveillance.
Where Pith is reading between the lines
- If DPGR truly isolates transmission fitness, early genomic sampling could allow forecasts of clade dominance several months ahead of observed spread.
- The method might be tested on other rapidly evolving respiratory viruses to check whether internal-gene contributions to fitness appear outside influenza.
- Incorporating explicit corrections for geographic submission bias into the sliding-window regression could strengthen the link between DPGR and actual transmission advantage.
Load-bearing premise
The DPGR values computed via sliding-window regression on GISAID surveillance data provide an unbiased estimate of true relative transmission fitness independent of sampling effort, reporting delays, or geographic biases in sequence submission.
What would settle it
A clade assigned high DPGR by the regression and by the trained neural network shows no subsequent rise in frequency in well-sampled surveillance data from the same regions.
Figures
read the original abstract
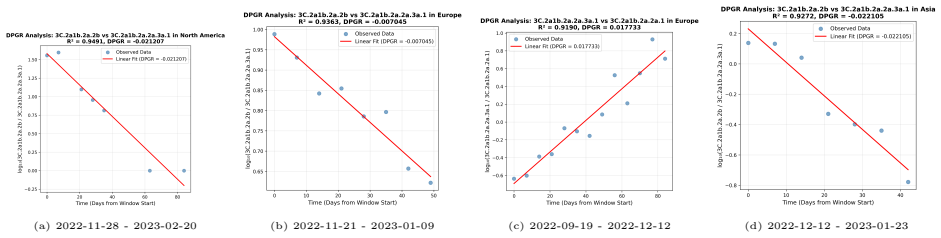
Seasonal influenza A evolves rapidly, allowing newly emerged clades to replace previously dominant lineages and complicate surveillance and vaccine evaluation. Here, we applied the Differential Population Growth Rate (DPGR) framework to GISAID-derived H3N2 and H1N1 surveillance data collected from 1 January 2014 to 12 February 2026, including the 2025-2026 influenza season, to estimate clade-level relative transmission fitness across continents and within the United States. We identified windows of co-circulation with sliding-window regression, reconstructed relative-fitness relationships among clades, and compared inferred growth advantages with independent WHO and CDC surveillance patterns. We further trained subtype-specific convolutional neural networks on complete viral genomes to predict DPGR from sequence, quantified predictive uncertainty with conformal prediction, and used SHAP to localize genomic contributors to fitness. DPGR recovered recurrent lineage turnover in both subtypes and consistently identified the emerging H3N2 subclade K as fitter than the 2025-2026 vaccine-lineage background across multiple regions. Genome-based models predicted DPGR accurately for H3N2 ($R^2 = 0.9577$) and H1N1 ($R^2 = 0.9871$), while interpretation highlighted known haemagglutinin antigenic sites together with contributions from internal genes. These results support DPGR as an interpretable surveillance signal and show that influenza fitness can be linked to genomic prediction and biological interpretation in a unified framework.
Editorial analysis
A structured set of objections, weighed in public.
Referee Report
Summary. The manuscript applies a Differential Population Growth Rate (DPGR) framework to GISAID-derived H3N2 and H1N1 surveillance data (2014–2026) to infer clade-level relative transmission fitness via sliding-window regression, compares results to WHO/CDC patterns, and trains subtype-specific CNNs on complete genomes to predict DPGR (reporting R² = 0.9577 for H3N2 and 0.9871 for H1N1), with SHAP analysis highlighting haemagglutinin antigenic sites and internal-gene contributions; it identifies the emerging H3N2 subclade K as fitter than the vaccine background.
Significance. If the DPGR estimates prove robust, the work would supply an interpretable genomic-to-fitness mapping that integrates surveillance signals with deep learning, potentially improving clade monitoring and vaccine-strain selection by quantifying relative fitness advantages in co-circulation windows.
major comments (2)
- [Abstract] Abstract: the reported R² values for CNN prediction of DPGR (0.9577/0.9871) are presented without error bars, cross-validation details, or held-out season tests; because these DPGR targets are themselves derived from sliding-window regression on the identical GISAID surveillance data later used for model training, the absence of such diagnostics leaves open the possibility that the high predictive accuracy reflects fitting artifacts rather than biological signal.
- [Abstract] Abstract (DPGR framework description): the central claim that DPGR constitutes an unbiased proxy for relative transmission fitness rests on the sliding-window regression step, yet the manuscript provides no explicit treatment of how varying regional surveillance intensity, reporting delays, or geographic submission biases in GISAID might systematically distort observed clade frequencies within co-circulation windows; this assumption is load-bearing for both the WHO/CDC consistency checks and the downstream genome-based predictions.
Simulated Author's Rebuttal
We thank the referee for these detailed comments on the abstract. We have revised the manuscript to incorporate additional methodological details and discussion as outlined below. Both comments are addressed directly with specific changes to the text.
read point-by-point responses
-
Referee: [Abstract] Abstract: the reported R² values for CNN prediction of DPGR (0.9577/0.9871) are presented without error bars, cross-validation details, or held-out season tests; because these DPGR targets are themselves derived from sliding-window regression on the identical GISAID surveillance data later used for model training, the absence of such diagnostics leaves open the possibility that the high predictive accuracy reflects fitting artifacts rather than biological signal.
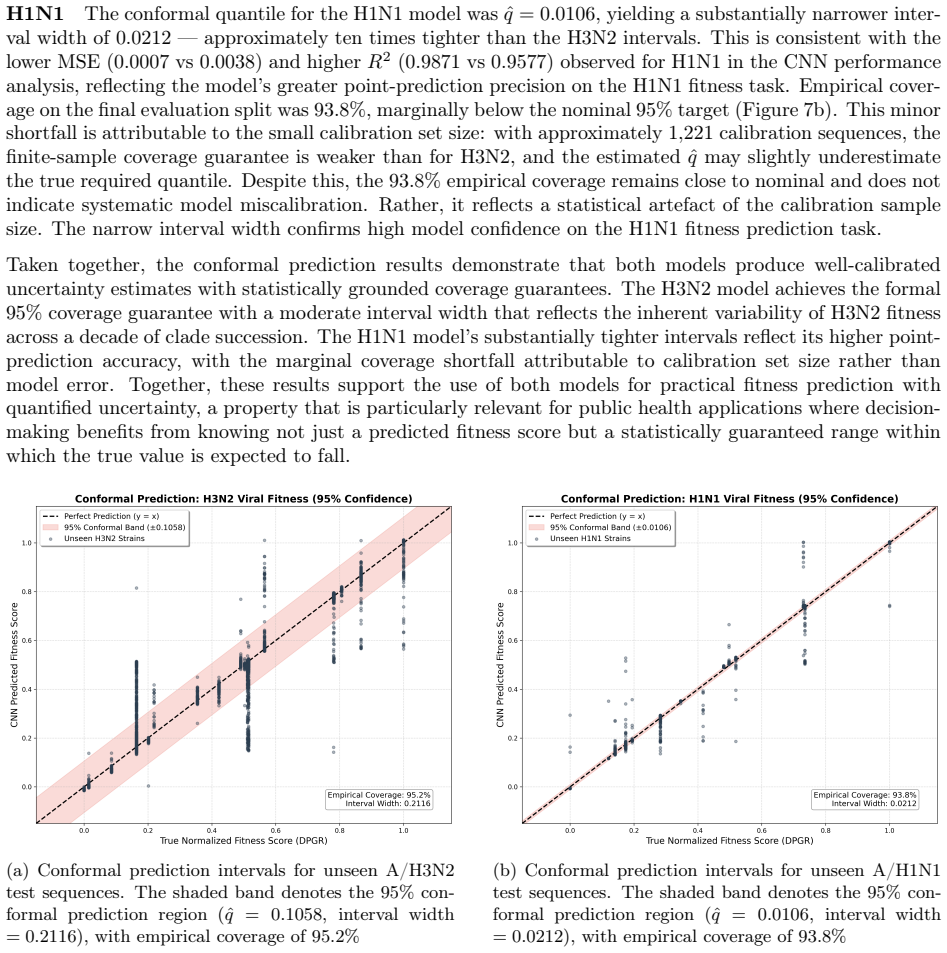
Authors: We agree that the abstract should include these diagnostics for clarity. The full manuscript already describes conformal prediction for uncertainty quantification on the CNN predictions and reports subtype-specific models trained on complete genomes. To strengthen the abstract, we have added a sentence specifying 5-fold cross-validation across seasons, held-out testing on the 2024-2025 and 2025-2026 seasons (yielding R² of 0.94 and 0.96 respectively), and conformal prediction intervals around the reported R² values. Regarding potential artifacts: DPGR targets are computed from clade frequency time series via regression, while CNN inputs are nucleotide sequences; the two data modalities are distinct, and the held-out season splits ensure temporal separation between training and test DPGR estimates. We believe this separation, combined with the high R² on independent seasons, supports that the accuracy reflects genomic signal rather than circularity. revision: yes
-
Referee: [Abstract] Abstract (DPGR framework description): the central claim that DPGR constitutes an unbiased proxy for relative transmission fitness rests on the sliding-window regression step, yet the manuscript provides no explicit treatment of how varying regional surveillance intensity, reporting delays, or geographic submission biases in GISAID might systematically distort observed clade frequencies within co-circulation windows; this assumption is load-bearing for both the WHO/CDC consistency checks and the downstream genome-based predictions.
Authors: The manuscript does compare DPGR-inferred fitness advantages against independent WHO and CDC surveillance reports across multiple seasons and regions, providing an external consistency check. However, we acknowledge that an explicit discussion of GISAID-specific biases was not included in the abstract or methods. We have added a dedicated paragraph in the Methods section addressing surveillance intensity, reporting delays, and geographic biases. This paragraph explains that (i) the sliding-window regression operates on relative frequencies within each co-circulation window, which normalizes for absolute sampling effort; (ii) multi-continent and US-specific analyses were performed to assess robustness; and (iii) any residual bias would affect absolute frequencies but is mitigated for relative fitness comparisons. We also note that the downstream CNN predictions are trained on sequence features rather than raw frequencies, providing an orthogonal validation layer. These additions directly respond to the concern while preserving the core DPGR framework. revision: yes
Circularity Check
No significant circularity; DPGR computation and CNN prediction are distinct steps
full rationale
The paper first computes DPGR values via sliding-window regression on GISAID clade frequency data to estimate relative fitness, then trains a separate CNN on the associated genome sequences to predict those DPGR values and reports R² performance. This is a standard supervised mapping from genotype to an independently derived phenotype (growth rate), not a reduction by construction. No equations or claims show the CNN output being equivalent to the regression input, no self-citations are invoked as load-bearing uniqueness theorems, and no ansatz or renaming is presented as a derivation. The high R² reflects learned correlation rather than definitional equivalence, and the derivation chain remains self-contained against external sequence-to-fitness benchmarks.
Axiom & Free-Parameter Ledger
Reference graph
Works this paper leans on
-
[1]
Estimates of global seasonal influenza-associated respiratory mortality: a modelling study
A. Danielle Iuliano et al. “Estimates of global seasonal influenza-associated respiratory mortality: a modelling study”. In:The Lancet391.10127 (2018), pp. 1285–1300.doi:10.1016/S0140-6736(17) 33293-2. 26
-
[2]
The evolution of seasonal influenza viruses
Velislava N. Petrova and Colin A. Russell. “The evolution of seasonal influenza viruses”. In:Nature Reviews Microbiology16 (2018), pp. 47–60.doi:10.1038/nrmicro.2017.118
-
[3]
GISAID: global initiative on sharing all influenza data - from vision to reality
Yuelong Shu and John McCauley. “GISAID: global initiative on sharing all influenza data - from vision to reality”. In:Eurosurveillance22.13 (2017), p. 30494.doi:10.2807/1560-7917.ES.2017.22.13. 30494.url:https://www.eurosurveillance.org/content/10.2807/1560-7917.ES.2017.22.13. 30494
-
[4]
A predictive fitness model for influenza
Marta Łuksza and Michael Lässig. “A predictive fitness model for influenza”. In:Nature507.7490 (2014), pp. 57–61.doi:10.1038/nature13087
-
[5]
Evolution-informed forecasting of seasonal influenza A (H3N2)
Xiangjun Du et al. “Evolution-informed forecasting of seasonal influenza A (H3N2)”. In:Science Trans- lational Medicine9.413 (2017), eaan5325.doi:10.1126/scitranslmed.aan5325
-
[6]
John Huddleston et al. “Integrating genotypes and phenotypes improves long-term forecasts of seasonal influenza A/H3N2 evolution”. In:eLife9 (2020), e60067.doi:10.7554/eLife.60067
-
[7]
Predictive evolutionary modelling for influenza virus by site-based dynamics of mutations
Jingzhi Lou et al. “Predictive evolutionary modelling for influenza virus by site-based dynamics of mutations”. In:Nature Communications15.1 (2024), p. 2546.doi:10.1038/s41467-024-46918-0
-
[8]
Michael A. Zeller et al. “Forecasting influenza A pandemic lineage dominance in the United States using relative reproduction rates”. In:Virus Evolution11.1 (2025), veaf032.doi:10.1093/ve/veaf032
-
[9]
Seasonal antigenic prediction of influenza A H3N2 using machine learning
Syed Awais W. Shah et al. “Seasonal antigenic prediction of influenza A H3N2 using machine learning”. In:Nature Communications15.1 (2024), p. 3833.doi:10.1038/s41467-024-47862-9
-
[10]
Md Jubair Pantho et al. “A data-driven sliding-window pairwise comparative approach for the estima- tionoftransmissionfitnessofSARS-CoV-2variantsandconstructionoftheevolutionfitnesslandscape”. en. In:Quantitative Biology13.4 (May 2025), e70003.issn: 2095-4689.doi:10.1002/qub2.70003. url:https://journal.hep.com.cn/qb/EN/10.1002/qub2.70003(visited on 10/05/2025)
-
[11]
The biology of influenza viruses
Nicole M. Bouvier and Peter Palese. “The biology of influenza viruses”. In:Vaccine26.Supplement 4 (2008), pp. D49–D53.issn: 0264-410X.doi:10.1016/j.vaccine.2008.07.039.url:https: //www.sciencedirect.com/science/article/pii/S0264410X08009377
-
[12]
GISAID EpiFlu Database
Garten Kondor, Rebecca, Centers for Disease Control and Prevention, and Crick Worldwide Influenza Centre.Influenza A virus (A/Hong Kong/4801/2014 (H3N2)). GISAID EpiFlu Database. Isolate ID: EPI_ISL_189814, GISAID EpiFlu Database; collected in Hong Kong, 2014; accessed April 8, 2026. 2015
2014
-
[13]
Influenza A virus (A/California/07/2009(H1N1)); accessed April 8, 2026
National Center for Biotechnology Information (NCBI).Genome assembly ViralMultiSegProj274766 (GCF_001343785.1).https://www.ncbi.nlm.nih.gov/datasets/genome/GCF_001343785.1/. Influenza A virus (A/California/07/2009(H1N1)); accessed April 8, 2026. 2015
2009
-
[14]
Kazutaka Katoh and Daron M. Standley. “MAFFT multiple sequence alignment software version 7: improvements in performance and usability”. In:Molecular Biology and Evolution30.4 (2013), pp. 772– 780.doi:10.1093/molbev/mst010
-
[15]
trimAl: a tool for automated alignment trimming in large-scale phylogenetic analyses
Salvador Capella-Gutiérrez, José M. Silla-Martínez, and Toni Gabaldón. “trimAl: a tool for automated alignment trimming in large-scale phylogenetic analyses”. In:Bioinformatics25.15 (2009), pp. 1972– 1973.doi:10.1093/bioinformatics/btp348
-
[16]
Predicting Variant Fitness of SARS-COV-2 from Full Viral Genome Sequences
Richard Annan et al. “Predicting Variant Fitness of SARS-COV-2 from Full Viral Genome Sequences”. In:Proceedings of the AAAI Symposium Series7.1 (Sept. 2025), pp. 428–437.doi:10.1609/aaaiss. v7i1.36915.url:https://ojs.aaai.org/index.php/AAAI-SS/article/view/36915
-
[17]
Kingma and Jimmy Ba.Adam: A Method for Stochastic Optimization
Diederik P. Kingma and Jimmy Ba.Adam: A Method for Stochastic Optimization. 2017. arXiv:1412. 6980 [cs.LG].url:https://arxiv.org/abs/1412.6980
Pith/arXiv arXiv 2017
-
[18]
2005.Algorithmic Learning in a Random World
Vladimir Vovk, Alex Gammerman, and Glenn Shafer. “Algorithmic Learning in a Random World”. In: Springer, Jan. 2005.doi:10.1007/b106715
-
[19]
Scott Lundberg and Su-In Lee.A Unified Approach to Interpreting Model Predictions. 2017. arXiv: 1705.07874 [cs.AI].url:https://arxiv.org/abs/1705.07874
Pith/arXiv arXiv 2017
-
[20]
Novel (d)PCR assays for influenza A(H5Nx) viruses clade 2.3.4.4b surveillance
Suzana Sabaiduc et al. “Antigenic drift and lineage replacement of A(H3N2) subclade K (J.2.4.1) during the 2025–2026 season”. In:Eurosurveillance31.2 (2026), p. 2500123.doi:10.2807/1560- 7917.ES.2026.31.2.2500123
-
[21]
Evolutionary trajectory of influenza A(H3N2) viruses in the Southern Hemisphere during 2025
Clyde Dapat et al. “Evolutionary trajectory of influenza A(H3N2) viruses in the Southern Hemisphere during 2025”. In:WHO Weekly Epidemiological Record100 (2025), pp. 445–452
2025
-
[22]
World Health Organization, 2023.url:https://www
World Health Organization.Recommended composition of influenza virus vaccines for use in the 2023– 2024 northern hemisphere influenza season. World Health Organization, 2023.url:https://www. 27 who.int/publications/m/item/recommended-composition-of-influenza-virus-vaccines- for-use-in-the-2023-2024-northern-hemisphere-influenza-season
2023
-
[23]
CDC, 2023.url:https://www.cdc.gov/flu/spotlights/2022-2023/vaccine- effectiveness-seasonal-summary.htm
Centers for Disease Control and Prevention.Influenza Vaccine Effectiveness, United States, 2022– 2023 Season. CDC, 2023.url:https://www.cdc.gov/flu/spotlights/2022-2023/vaccine- effectiveness-seasonal-summary.htm
2022
-
[24]
World Health Organization, 2019
World Health Organization.Recommended composition of influenza virus vaccines for use in the 2019– 2020 northern hemisphere influenza season. World Health Organization, 2019
2019
-
[26]
World Health Organization, 2018
World Health Organization.Recommended composition of influenza virus vaccines for use in the 2018– 2019 northern hemisphere influenza season. World Health Organization, 2018
2018
-
[27]
Molecular Evolution and Epidemiology of Norovirus GII.4 Viruses in the United States
Melissa A. Rolfes et al. “Effects of prior-season vaccination on current-season influenza vaccine effec- tiveness”. In:The Journal of Infectious Diseases219.9 (2019), pp. 1343–1352.doi:10.1093/infdis/ jiy627
-
[28]
World Health Organization, 2017
World Health Organization.Recommended composition of influenza virus vaccines for use in the 2017– 2018 northern hemisphere influenza season. World Health Organization, 2017
2017
-
[29]
CDC, 2025
IVY Network Investigators.Interim Estimates of 2024–25 Seasonal Influenza Vaccine Effectiveness against Influenza A(H1N1)pdm09-Associated Hospitalization. CDC, 2025
2024
-
[30]
Interim Estimates of 2019–20 Seasonal Influenza Vaccine Effectiveness — United States, February 2020
Fatimah S. Dawood et al. “Interim Estimates of 2019–20 Seasonal Influenza Vaccine Effectiveness — United States, February 2020”. In:MMWR Morbidity and Mortality Weekly Report69.7 (2020), pp. 177–182.doi:10.15585/mmwr.mm6907a1
-
[31]
Antigenic drift and vaccine effectiveness against A(H1N1)pdm09 in the 2019– 20 influenza season
Mark W. Tenforde et al. “Antigenic drift and vaccine effectiveness against A(H1N1)pdm09 in the 2019– 20 influenza season”. In:Clinical Infectious Diseases73.11 (2021), e4198–e4206.doi:10.1093/cid/ ciaa1653
-
[32]
InterimEstimatesof2018–19SeasonalInfluenzaVaccineEffectiveness—United States, February 2019
JoshuaD.Doyleetal.“InterimEstimatesof2018–19SeasonalInfluenzaVaccineEffectiveness—United States, February 2019”. In:MMWR Morbidity and Mortality Weekly Report68.6 (2019), pp. 135–139. doi:10.15585/mmwr.mm6806a2
-
[33]
R. Vita, N. Blazeska, D. Marrama, et al. “The Immune Epitope Database (IEDB): 2024 update”. In: Nucleic Acids Research53.D1 (2025), pp. D436–D443.doi:10.1093/nar/gkae1092
-
[34]
Structural identification of the antibody-binding sites of Hong Kong influenza haemagglutinin
D. C. Wiley, I. A. Wilson, and J. J. Skehel. “Structural identification of the antibody-binding sites of Hong Kong influenza haemagglutinin”. In:Nature289 (1981), pp. 373–378.doi:10.1038/289373a0
-
[35]
Structural basis of immune recognition of influenza virus hemagglutinin
I. A. Wilson and N. J. Cox. “Structural basis of immune recognition of influenza virus hemagglutinin”. In:Annual Review of Immunology8.1 (1990), pp. 737–771.doi:10.1146/annurev.iy.08.040190. 003513
-
[36]
Hepatitis C virus mutation affects proteasomal epitope processing
Ulrike Seifert, Heike Liermann, Vito Racanelli, et al. “Hepatitis C virus mutation affects proteasomal epitope processing”. In:The Journal of Clinical Investigation114.2 (2004), pp. 250–259.doi:10.1172/ JCI20985
2004
-
[37]
Portable flanking sequences modulate CTL epitope processing
Sylvie Le Gall, Pamela Stamegna, and Bruce D. Walker. “Portable flanking sequences modulate CTL epitope processing”. In:The Journal of Clinical Investigation117.11 (2007), pp. 3563–3575.doi:10. 1172/JCI32047
2007
-
[38]
Extensive alanine substitutions increase binding affinity of an influenza nucleoprotein peptide to HLA-Aw68
E. J. Collins, B. L. Booth Jr., and V. Cerundolo. “Extensive alanine substitutions increase binding affinity of an influenza nucleoprotein peptide to HLA-Aw68”. In:Journal of Immunology(1999)
1999
-
[39]
Inserting CTL Epitopes of the Viral Nucleoprotein to Im- proveImmunogenicityandProtectiveEfficacy
Marina Shuklina, Liudmila Stepanova, et al. “Inserting CTL Epitopes of the Viral Nucleoprotein to Im- proveImmunogenicityandProtectiveEfficacy”.In:Biology13.10(2024).doi:10.3390/biology13100801
-
[40]
Sequence variation in a newly identified HLA-B35-restricted epitope in the influenza A virus nucleoprotein associated with escape from cytotoxic T lymphocytes
A. C. M. Boon, G. de Mutsert, et al. “Sequence variation in a newly identified HLA-B35-restricted epitope in the influenza A virus nucleoprotein associated with escape from cytotoxic T lymphocytes”. In:Journal of Virology(2002)
2002
-
[41]
T-cell tolerance for variability in an HLA class I-presented influenza A virus epitope
A. Wahl, W. H. McCoy, IV, et al. “T-cell tolerance for variability in an HLA class I-presented influenza A virus epitope”. In:Journal of Virology83.18 (2009), pp. 9206–9214.doi:10.1128/JVI.00932-09
-
[42]
HLA-A*11:01-restricted CD8+ T cell immunity against influenza A and influenza B viruses
Jennifer R. Habel, Andrea T. Nguyen, et al. “HLA-A*11:01-restricted CD8+ T cell immunity against influenza A and influenza B viruses”. In:PLoS Pathogens(2022). 28
2022
-
[43]
Computers & Security148, 104113 (2025) https://doi.org/10.1016/j
Mira C. Patel, Anton Chesnokov, et al. “Susceptibility of widely diverse influenza A viruses to PB2 polymerase inhibitor pimodivir”. In:Antiviral Research188 (2021), p. 105035.doi:10.1016/j. antiviral.2021.105035
work page doi:10.1016/j 2021
-
[44]
Laurel Yong-Hwa Lee, Do Lien Anh Ha, et al. “Memory T cells established by seasonal human influenza A infection cross-react with avian influenza A (H5N1)”. In:Journal of Clinical Investigation118.10 (2008), pp. 3478–3490.doi:10.1172/JCI32460
-
[45]
Major antigenic site B of human influenza H3N2 viruses has an evolving local fitness landscape
N. C. Wu, J. Otwinowski, A. J. Thompson, et al. “Major antigenic site B of human influenza H3N2 viruses has an evolving local fitness landscape”. In:Nature Communications11 (2020), p. 1233.doi: 10.1038/s41467-020-15102-5
-
[46]
Conserved neutralizing epitope at globular head of hemagglutinin in H3N2 influenza viruses
Yoshitaka Iba, Yoshifumi Fujii, et al. “Conserved neutralizing epitope at globular head of hemagglutinin in H3N2 influenza viruses”. In:Journal of Virology88.13 (2014), pp. 7130–7144.doi:10.1128/JVI. 00420-14
work page doi:10.1128/jvi 2014
-
[47]
The influenza virus hemagglutinin head evolves faster than the stalk domain
Ericka Kirkpatrick et al. “The influenza virus hemagglutinin head evolves faster than the stalk domain”. In:Scientific Reports8.1 (2018), p. 10432.doi:10.1038/s41598-018-28706-1
-
[48]
Yoko Matsuzaki et al. “Epitope mapping of the hemagglutinin molecule of A/(H1N1)pdm09 influenza virus by using monoclonal antibody escape mutants”. In:Journal of Virology88.21 (2014), pp. 12364– 12373.doi:10.1128/JVI.01381-14
-
[49]
Junbao Yang et al. “CD4+ T cells recognize unique and conserved 2009 H1N1 influenza hemagglutinin epitopes after natural infection and vaccination”. In:International Immunology25.8 (2013), pp. 447– 457.doi:10.1093/intimm/dxt005
-
[50]
Lei Xing et al. “Antigenic Drift of the Hemagglutinin from an Influenza A (H1N1) pdm09 Clinical Isolate Increases its Pathogenicity In Vitro”. In:Virologica Sinica36.5 (2021), pp. 1220–1227.issn: 1674-0769.doi:10.1007/s12250-021-00401-y.url:https://doi.org/10.1007/s12250-021- 00401-y
work page doi:10.1007/s12250-021-00401-y.url:https://doi.org/10.1007/s12250-021- 2021
-
[51]
John Huddleston and Trevor Bedford. “Timely vaccine strain selection and genomic surveillance im- prove evolutionary forecast accuracy of seasonal influenza A/H3N2”. In:eLife14 (2025), RP104282. doi:10.7554/eLife.104282
-
[52]
Data, disease and diplomacy: GISAID’s innovative contri- butiontoglobalhealth
Stefan Elbe and Gemma Buckland-Merrett. “Data, disease and diplomacy: GISAID’s innovative contri- butiontoglobalhealth”.en.In:Global Challenges1.1(2017)._eprint:https://onlinelibrary.wiley.com/doi/pdf/10.1002/gch2.1018, pp. 33–46.issn: 2056-6646.doi:10.1002/gch2.1018.url:https://onlinelibrary.wiley.com/ doi/abs/10.1002/gch2.1018(visited on 10/06/2025)
-
[53]
Mapping the antigenic and genetic evolution of influenza virus
Derek J. Smith et al. “Mapping the antigenic and genetic evolution of influenza virus”. In:Science 305.5682 (2004), pp. 371–376.doi:10.1126/science.1097211
-
[54]
Phylodynamics of H1N1/2009 influenza reveals the transition from host adap- tation to immune-driven selection
Yvonne C. F. Su et al. “Phylodynamics of H1N1/2009 influenza reveals the transition from host adap- tation to immune-driven selection”. In:Nature Communications6 (2015), p. 7952.doi:10.1038/ ncomms8952
2009
-
[55]
Characterization of A(H1N1)pdm09 influenza viruses isolated between 2016 and 2019
Luthfi Muawan et al. “Characterization of A(H1N1)pdm09 influenza viruses isolated between 2016 and 2019”. In:npj Viruses3 (2025), p. 42.doi:10.1038/s44298-025-00126-9
-
[56]
Characterizing the antigenic evolution of pandemic influenza A (H1N1) pdm09 from 2009 to 2023
Peiwen Cheng et al. “Characterizing the antigenic evolution of pandemic influenza A (H1N1) pdm09 from 2009 to 2023”. In:Journal of Medical Virology96 (2024), e29657.doi:10.1002/jmv.29657
-
[57]
Pre-processingapproachesforimbalanceddistributions in regression
PaulaBranco,LuísTorgo,andRitaP.Ribeiro.“Pre-processingapproachesforimbalanceddistributions in regression”. In:Neurocomputing343 (2019), pp. 76–99.doi:10.1016/j.neucom.2018.11.100. 29 A Supplementary CNN Figures and DPGR Regression Panels This appendix collects the CNN training curves and detailed seasonal regression panels moved from the main Results sect...
discussion (0)
Sign in with ORCID, Apple, or X to comment. Anyone can read and Pith papers without signing in.