REVIEW 3 major objections 5 minor 30 references
Modelling columnarity of pyramidal cells in the human cerebral cortex
T0 review · 3 major / 5 minor · reviewed 2026-08-14 · deepseek-v4-flash
Pith's one-line read This paper argues that the three-dimensional locations of pyramidal cell nucleoli in the human cortex form vertical columns, but that those columns are much smaller than the classical minicolumn hypothesis expects.
desk verdict A real methodological step in 3D point-process modelling, but the boundary simplification and data-driven interaction regions keep the minicolumn-size conclusion from being solid. read the letter →
The pith
A machine-rendered reading of the paper's core claim, the machinery that carries it, and where it could break.
The reading
What carries the argument
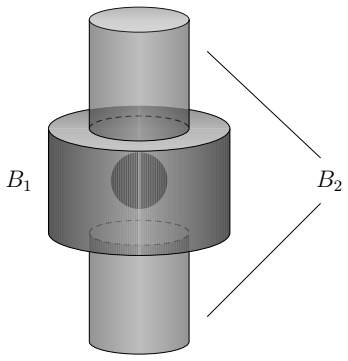
The load-bearing construction is the hierarchical pair $(\mathbf{X}_{xy}, \mathbf{X}_z \mid \mathbf{X}_{xy})$: the projected $xy$-locations form a determinantal Thomas point process, i.e. a generalised shot-noise Cox process whose cluster centres come from a determinantal point process with a jinc-like kernel and whose offspring are dispersed by an isotropic Gaussian density in the plane. Conditioned on those observed $xy$-points, the $z$-coordinates follow a pairwise-interaction Markov random field with density proportional to \[ \prod_{i<j} I(\|(x_i,y_i,z_i)-(x_j,y_j,z_j)\|>h)\, \$gamma_1^{{I(\|(x_i,y_i)-(x_j,y_j)\|\le r_1,\ |z_i-z_j|\le t_1)}}$\, \$gamma_2^{{I(\|(x_i,y_i)-(x_j,y_j)\|\le r_2,\ t_1<|z_i-z_j|\le t_2)}}$. \] Here $h$ is a hard-core distance, the first cylinder is stunted and repulsive ($\gamma_1<1$), the second is an elongated cylindrical shell and attractive ($\gamma_2>1$), and the cylindrical $K$-function—the expected number of further points in a vertical cylinder as a function of radius and half-height—is the diagnostic that exposes anisotropy along the $z$-axis.
What would settle it
Simulate the fitted model with the ignored boundary clusters included (or with a stationary extension of the z-MRF), refit, and compare the parameter estimates and the cylindrical K-function envelope for the fifth-layer data; if including boundary clusters changes the estimates or brings the cylindrical K-function inside the envelope, the paper's conclusions depend on the edge simplification.
Extended reading notes
Core claim
The central claim, stated on the paper's own terms, is that the nucleolus locations in both datasets are adequately described by a hierarchical point process in $\mathbb{R}^3$: a determinantal point process for cluster centres in the $xy$-plane, Gaussian dispersal of points around those centres, and a pairwise-interaction Markov random field for the $z$-coordinates conditioned on the observed $xy$-points. In the fitted model the interaction is threefold: a hard core at distances of about 6–7 µm, repulsion inside a stunted cylinder whose horizontal radius is about 20–24 µm and half-height about 11–15 µm, and attraction in an elongated cylindrical shell at vertical separations between about 11–15 µm and 35–37 µm. The paper concludes that this specifies much smaller columns than expected under the minicolumn hypothesis, and that the same model form, with different parameter values, describes both the layer-3 and layer-5 datasets.
Load-bearing premise
The model for z-coordinates is fitted only to points observed inside the window, ignoring unobserved points from clusters whose centres lie outside the window; if those boundary points interact with observed cells, the fitted repulsion and attraction parameters—and the imperfect fit to the fifth-layer data—could be artifacts of this simplification.
Editorial extensions
If this is right
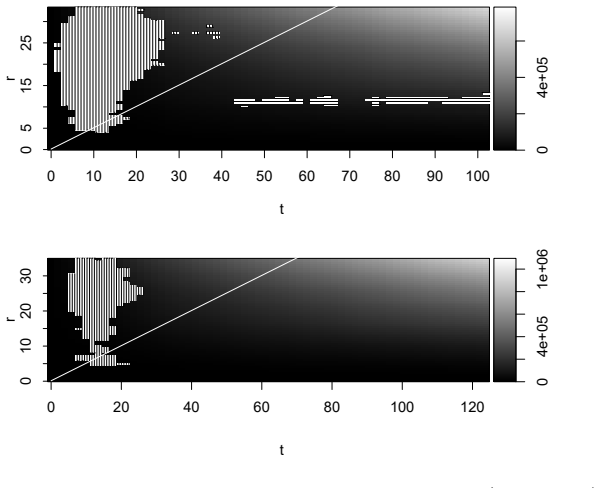
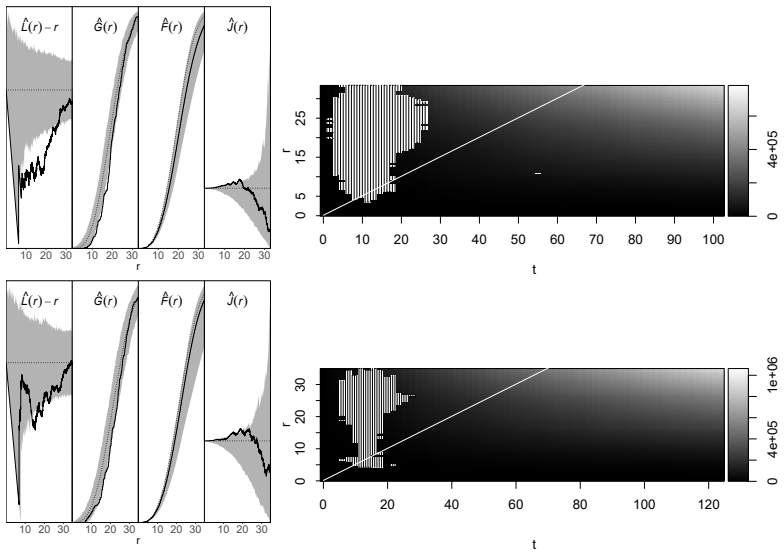
- Complete spatial randomness is decisively rejected for both datasets, and the cylindrical K-function shows excess points in tall narrow cylinders and a deficit in short wide cylinders—exactly the signature of z-directed columnar structure.
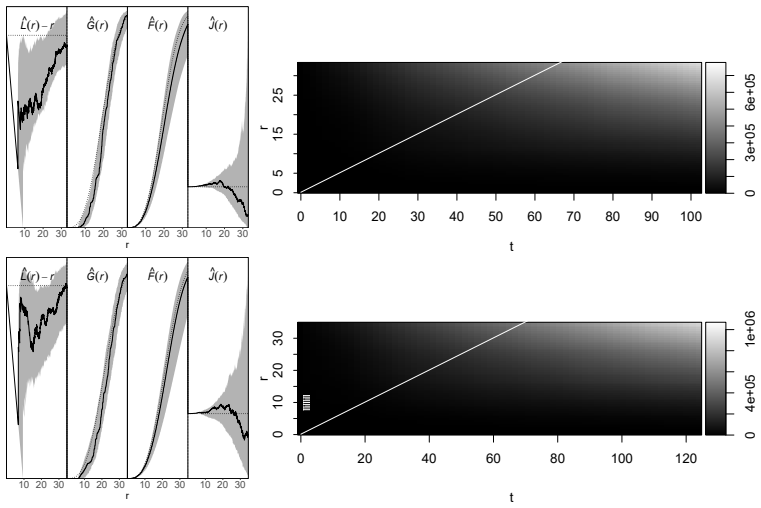
- The simpler Poisson line cluster process, in which z-coordinates are independent and uniform, fails the three-dimensional goodness-of-fit tests; the extra z-interactions in the final model are necessary.
- The fitted columnar structure is much smaller than the textbook minicolumn description, with expected projected cluster sizes of only 2.42 and 3.87 points per cluster in the two datasets.
- The same model form fits both layer-3 and layer-5 data, but the parameter estimates differ, implying that columnar spacing, repulsion, and attraction are layer-dependent.
- Maximum pseudo likelihood for the z-MRF, combined with minimum contrast for the planar cluster process, recovers the true parameters well in the paper's simulation study.
Reading between the lines
- Beyond the paper: the fitted interaction scales—hard core near 6–7 µm, repulsion out to horizontal radii of 20–24 µm, and attraction at vertical offsets up to about 37 µm—are compatible with local microcircuit motifs, so the detected 'columns' might be functional sub-units rather than the classical minicolumns.
- Beyond the paper: the same hierarchical template should transfer to other anisotropic tissues, and the z-model could be made directional if apical dendrite orientation is available as a covariate.
- Beyond the paper: a direct testable extension is to fit the model to pathological samples and compare group-level parameters; the paper notes that group comparison remains future work, so this is a natural next step.
Signed reviews
Editorial analysis
A structured set of objections, weighed in public.
Referee Report
Summary. The paper proposes a hierarchical point process model in R^3 for the locations of pyramidal cell nucleoli in two human cortex datasets (L3 and L5). The xy-coordinates are modelled by a generalised shot-noise Cox process with a jinc-like determinantal point process for cluster centres and Gaussian offspring dispersal; the z-coordinates, conditional on the observed xy-points, are modelled by a pairwise-interaction Markov random field with a hard-core term, a repulsive stunted cylindrical interaction region, and an attractive elongated cylindrical interaction region. Parameter estimation combines minimum contrast for the xy-component with maximum pseudo-likelihood for the z-component, and model adequacy is checked with GERL envelope procedures based on one-dimensional summaries and the cylindrical K-function. The fitted final model (model 5) is reported to describe L3 well and to show 'only slight evidence' against L5, and the authors conclude that the fitted columns are much smaller than those expected under the classical minicolumn hypothesis. An appendix reports a simulation study of the pseudo-likelihood estimator.
Significance. If the modelling conclusions were fully supported, the paper would be a useful methodological contribution to three-dimensional point process modelling of columnar structures: it combines a determinantal centre process with a conditional Markov random field for the remaining coordinate, introduces a pseudo-likelihood fitting procedure, and uses global envelope tests with a large number of simulations. The simulation study in Appendix I is a genuine strength, as it checks the estimator on data generated from the fitted model. However, the paper's central empirical claim is weakened by two load-bearing issues: the explicit neglect of edge effects in the z-conditional model, and the fact that the final model is rejected by the cylindrical K-function GERL test for L5 at p = 0.02. These issues need to be addressed before the adequacy statement and the biological conclusion can be taken as established.
major comments (3)
- [Section 5.2, Eq. (2) and (4)] This is a load-bearing concern because the final adequacy statement and the estimated column sizes depend on interaction parameters fitted under this simplification.
- [Section 5.3.2, Table 4 and Figure 7] This is a load-bearing issue for the paper's main conclusion.
- [Section 5.3.1] This concern affects the interpretation of the p-values in Section 5.3.2.
minor comments (5)
- [Section 2.4]
- [Figure 2 and Figure 3 captions]
- [Section 4, first paragraph]
- [Section 1.3.1]
- [Appendix I]
Circularity Check
No significant circularity: the paper's fitted hierarchical model is an empirical description, not a derivation that reduces to its inputs.
full rationale
The paper's central claim is that a particular hierarchical point process, fitted by minimum contrast and maximum pseudo-likelihood, adequately describes two 3D nucleolus datasets. No claimed result is defined in terms of another claimed result, and no fitted parameter is renamed as an independent prediction. The final model 5 interaction regions (stunted cylinder with repulsion, elongated cylinder with attraction) were indeed chosen after exploratory comparison of simpler models, but the paper is explicit about this search in Section 5.3.1, and the reported interaction parameters are obtained by maximizing the pseudo-likelihood (4) based on the conditional density (2), not by imposing the qualitative conclusion. The GERL envelope checks use functional summaries that are not the fitted criterion: for the xy-model, K-function fitting is checked with G, F, and J, and for the z-model, pseudo-likelihood fitting is checked with L, G, F, J and the cylindrical K-function. Self-citations, such as Møller et al. (2019) for location-orientation independence and Møller and Christoffersen (2018) for the DTPP pair correlation function, are external, independently verifiable results and do not force the present conclusion. The explicit boundary simplification in Section 5.2, which ignores points of Y outside W when modelling Xz given Xxy, is a real modelling limitation that could bias parameter estimates, but it is not a circular step. The statement that the fitted model 'specifies much smaller columns than expected under the minicolumn hypothesis' is a post-fit interpretation of the estimated interaction ranges, not a prediction derived from the model's definition. Overall, the derivation chain is self-contained in the sense required by the circularity analysis, so no substantive circularity is present.
Assumptions & free parameters
free parameters (8)
- kappa (intensity of DPP cluster centres) =
0.0040 (L3), 0.0021 (L5)
- sigma (SD of normal offspring displacement) =
5.45 (L3), 6.53 (L5)
- alpha*a (expected cluster size) =
2.42 (L3), 3.87 (L5)
- gamma1 (repulsion strength in stunted cylinder) =
0.41 (L3), 0.51 (L5)
- gamma2 (attraction strength in elongated cylinder) =
1.78 (L3), 1.68 (L5)
- h (hard core distance) =
6.25 (L3), 6.77 (L5)
- r1, t1 (radius and half-height of repulsive cylinder) =
20, 11.5 (L3); 24.25, 15.5 (L5)
- r2, t2 (radius and outer half-height of attractive cylinder) =
11, 35.5 (L3); 14.75, 37.25 (L5)
assumptions (5)
- standard math The pairwise interaction MRF density (2) with the specified interaction regions and hard core is a valid probability density on Wz^n for the data (normalizing constant finite).
- ad hoc to paper Ignoring edge effects: the z-model conditions only on observed points in W, not on unobserved points from clusters centered outside Wxy that may fall inside W.
- domain assumption Cells cannot overlap, so a hard core distance h is physically meaningful.
- domain assumption Minicolumn hypothesis: columns extend perpendicular to the pial surface (z-axis) with diameters 35 to 60 micrometers and 80 to 100 neurons.
- domain assumption The DPP center process is stationary and the jinc-like kernel is the most repulsive stationary kernel; this choice is made to produce distinguishable clusters.
Cite this review
Pith. "Pith review of Modelling columnarity of pyramidal cells in the human cerebral cortex." pith.science (2026). https://pith.science/paper/HACH4GD4
@misc{pith2026190805065,
  author       = {Pith},
  title        = {Pith review of: Modelling columnarity of pyramidal cells in the human cerebral cortex},
  year         = {2026},
  howpublished = {\url{https://pith.science/paper/HACH4GD4}},
  note         = {Machine review of arXiv:1908.05065}
}
abstract
For modelling the location of pyramidal cells in the human cerebral cortex we suggest a hierarchical point process in $\mathbb{R}^3$ that exhibits anisotropy in the form of cylinders extending along the $z$-axis. The model consists first of a generalised shot noise Cox process for the $xy$-coordinates, providing cylindrical clusters, and next of a Markov random field model for the $z$-coordinates conditioned on the $xy$-coordinates, providing either repulsion, aggregation, or both within specified areas of interaction. Several cases of these hierarchical point processes are fitted to two pyramidal cell datasets, and of these a final model allowing for both repulsion and attraction between the points seem adequate. We discuss how the final model relates to the so-called minicolumn hypothesis in neuroscience.
Figures


Figures from the paper (4 more)

Reference graph
Works this paper leans on
-
[1]
Baddeley, A., Rubak, E., and Turner, R. (2016). Spatial Point Patterns: Methodology and Applications with R . Chapman & Hall/CRC, New York
work page 2016
-
[2]
Besag, J. (1975). Statistical analysis of non-lattice data. The Statistician , 24:179--195
work page 1975
-
[3]
Biscio, C. A. N. and Lavancier, F. (2016). Quantifying repulsiveness of determinantal point processes. Bernoulli , 22:2001--2028
work page 2016
-
[4]
Buxhoeveden, D. P. and Casanova, M. F. (2002). The minicolumn hypothesis in neuroscience. Brain , 125:935--951
work page 2002
-
[5]
Casanova, M. F. (2007). Schizophrenia seen as a deficit in the modulation of cortical minicolumns by monoaminergic systems. International Review of Psychiatry , 19:361--372
work page 2007
-
[6]
Casanova, M. F., van Kooten , I. A. J., Switala, A. E., van Engeland , H., Heinsen, H., Steinbusch, H. W. M., Hof, P. R., Trippe, J., Stone, J., and Schmitz, C. (2006). Minicolumnar abnormalities in autism. Acta Neuropathologica (Berl) , 112:287--303
work page 2006
-
[7]
Daley, D. J. and Vere-Jones, D. (2003). An Introduction to the Theory of Point Processes. Volume I: Elementary Theory and Methods . Springer-Verlag, New York, second edition
work page 2003
-
[8]
Diggle, P. J. (2014). Statistical Analysis of Spatial and Spatio-temporal Point Patterns . Chapman & Hall/CRC, Boca Raton, Florida
work page 2014
Show all 30 references
-
[9]
Diggle, P. J. and Gratton, R. J. (1984). Monte C arlo methods of inference for implicit statistical models (with discussion). Journal of the Royal Statistical Society: Series B (Statistical Methodology) , 46:193--227
1984
-
[10]
Esiri, M. M. and Chance, S. A. (2006). Vulnerability to A lzheimer's pathology in neocortex: the roles of plasticity and columnar organization. Journal of Alzheimer's Disease , 9:79--89
2006
-
[11]
Guan, Y. (2006). A composite likelihood approach in fitting spatial point process models. Journal of the Americal Statistical Association , 101:1502--1512
2006
-
[12]
Guan, Y. (2009). A minimum contrast estimation procedure for estimating the second-order parameters of inhomogeneous spatial point processes. Statistics and Its Interface , 2:91--99
2009
-
[13]
Lavancier, F., M ller, J., and Rubak, E. (2015). Determinantal point process models and statistical inference. Journal of the Royal Statistical Society: Series B (Statistical Methodology) , 77:853--877
2015
-
[14]
Lavancier, F., Poinas, A., and Waagepetersen, R. P. (2018). Adaptive estimating function inference for non-stationary determinantal point processes. Available on arXiv:1806.06231
2018 arXiv
-
[15]
Lieshout van Lieshout , M. N. M. and Baddeley, A. J. (1996). A nonparametric measure of spatial interaction in point pattersn. Statistica Neerlandica , 50:344--361
1996
-
[16]
S., Cuevas-Pacheco, F., and Christoffersen, A
M ller, J., Christensen, H. S., Cuevas-Pacheco, F., and Christoffersen, A. D. (2019). Structured space-sphere point processes and K -functions. Methodology and Computing in Applied Probability . Available at https://doi.org/10.1007/s11009-019-09712-w
2019 doi
-
[17]
and Christoffersen, A
M ller, J. and Christoffersen, A. D. (2018). Pair correlation functions and limiting distributions of iterated cluster point processes. Journal of Applied Probability , 55:789--809
2018
-
[18]
M ller, J., Safavimanesh, F., and Rasmussen, J. G. (2016). The cylindrical K -function and P oisson line cluster point process. Biometrika , 103:937--954
2016
-
[19]
and Torrisi, G
M ller, J. and Torrisi, G. L. (2005). Generalised shot noise C ox processes. Advances in Applied Probability , 37:48--74
2005
-
[20]
and Waagepetersen, R
M ller, J. and Waagepetersen, R. P. (2004). Statistical Inference and Simulation for Spatial Point Processes . Chapman & Hall/CRC, Boca Raton, Florida
2004
-
[21]
Mrkvi c ka, T., Myllym \"a ki, M., and Hahn, U. (2017). Multiple M onte C arlo testing, with applications in spatial point processes. Statistics and Computing , 27:1239--1255
2017
-
[22]
Mrkvi c ka, T., Myllym \"a ki, M., J\' i lek, M., and Hahn, U. (2018). A one-way ANOVA test for functional data with graphical interpretation. Available on arXiv:1612.03608
2018 arXiv
-
[23]
Mrkvi c ka, T., Soubeyrand, S., Myllym \"a ki, M., Grabarnik, P., and Hahn, U. (2016). Monte C arlo testing in spatial statistics, with applications to spatial residuals. Spatial Statistics , 18:40--53
2016
-
[24]
Myllym \"a ki, M., Mrkvi c ka, T., Grabarnik, P., Seijo, H., and Hahn, U. (2017). Global envelope tests for spatial processes. Journal of the Royal Statistical Society: Series B (Statistical Methodology) , 79:381--404
2017
-
[25]
and Katsura, K
Ogata, Y. and Katsura, K. (1991). Maximum likelihood estimates of the fractal dimension for random spatial patterns. Biometrika , 78:463--474
1991
-
[26]
Proke s ov\' a , M., Dvo r \' a k, J., and Jensen, E. B. V. (2016). Two-step estimation procedures for inhomogeneous shot-noise C ox processes. Annals of the Institute of Statistical Mathematics , 69:1--30
2016
-
[27]
H., Safavimanesh, F., Dorph-Petersen, K.-A., Rasmussen, J
Rafati, A. H., Safavimanesh, F., Dorph-Petersen, K.-A., Rasmussen, J. G., M ller, J., and Nyengaard, J. R. (2016). Detection and spatial characterization of minicolumnarity in the human cerebral cortex. Journal of Microscopy , 261:115--126
2016
-
[28]
Ripley, B. D. (1976). The second-order analysis of stationary point processes. Journal of Applied Probability , 13:255--266
1976
-
[29]
Thomas, M. (1949). A generalization of P oisson's binomial limit for use in ecology. Biometrica , 36:18--25
1949
-
[30]
Waagepetersen, R. P. (2007). An estimating function approach to inference for inhomogeneous N eyman- S cott processes. Biometrics , 63:252--258
2007
Reviewed August 14, 2026 · model on record in the stance chip above.
Discussion (0). Continue with ORCID to comment.