REVIEW 4 major objections 6 minor 5 references
Spatial Functional Deep Neural Network Model: A New Prediction Algorithm
T0 review · 4 major / 6 minor · reviewed 2026-08-16 · deepseek-v4-flash
Pith's one-line read A spatial deep network for functional data claims better prediction when locations interact and errors are non-Gaussian.
desk verdict A reasonable SAR-plus-FDNN hybrid whose main empirical claim about nonlinear gains is undermined by a simulation DGP that never generates from the proposed nonlinear model. read the letter →
The pith
A machine-rendered reading of the paper's core claim, the machinery that carries it, and where it could break.
The reading
What carries the argument
The central object is the neuron activation in Eq (4.6), where the first hidden layer applies the spatial inverse matrix $(I_n-\hat{\rho}W)^{-1}$ to the functional principal component integrals before the nonlinear activation $g(\cdot)$ is applied. The spatial parameter $\hat{\rho}$ is estimated once by maximum likelihood from a linear spatial scalar-on-function regression, then treated as fixed; the functional weights are represented as B-spline basis expansions, and Adam optimization trains the network. This two-step construction is what lets the model combine a spatial autoregressive mechanism with a flexible nonlinear functional regression.
What would settle it
A simulation where the response is generated from the nonlinear model in Eq (2.4) with a known link function, known $\rho$, and a spatial weight matrix, and then compared across ML, FDNN, and SFDNN on out-of-sample prediction error; if SFDNN's advantage disappears or the ML estimate of $\rho$ becomes badly biased as the nonlinearity strengthens, the central claim would be undermined.
Extended reading notes
Core claim
The paper's central claim is that the proposed SFDNN model, built from a nonlinear spatial scalar-on-function regression framework, significantly improves predictive accuracy for spatially dependent functional data compared with maximum-likelihood-based spatial functional linear regression (ML) and a functional deep neural network (FDNN) that ignores spatial structure. The improvement is said to be largest when spatial autocorrelation is strong (rho = 0.9) and when errors are heavy-tailed t3 or skewed exponential, conditions under which the comparators degrade sharply. In the COVID-19 application, all models produced similar training mean squared errors, but SFDNN achieved the lowest mean squared prediction error in the test period, which the authors interpret as evidence of superior generalization.
Load-bearing premise
The method assumes that the spatial dependence parameter $\rho$ estimated by maximum likelihood under a linear spatial functional model remains valid when the regression function is actually nonlinear, and that applying the inverse spatial matrix before the activation preserves the true spatial dependence.
Editorial extensions
If this is right
- If SFDNN's reported advantage holds, practitioners with spatially indexed functional predictors can expect materially lower out-of-sample prediction error than linear spatial functional models, particularly under strong spatial autocorrelation.
- The model extends spatial functional regression to multiple functional and scalar covariates simultaneously, which broadens its applicability beyond single-functional-predictor settings.
- The reported robustness to heavy-tailed and skewed errors suggests SFDNN is a candidate default for spatial functional prediction problems where Gaussian assumptions are questionable.
- The two-step estimation strategy, fixing the spatial parameter before network training, offers a computationally tractable way to inject spatial dependence into deep learning without re-estimating the spatial structure in every gradient step.
- In epidemiological forecasting, the COVID-19 results imply that spatial spillover and nonlinear interactions among cases, vaccination, and population can be captured in a single prediction tool.
Reading between the lines
- Editorial inference: The paper's simulations never generate responses from the nonlinear model in Eq (2.4), because no link function appears in the data-generating equations; if the true process is nonlinear, the maximum-likelihood estimate of $\rho$ may become inconsistent, so the reported advantage could depend on the spatial parameter staying valid under misspecification.
- Editorial inference: A natural testable extension is to replace the fixed ML estimate of $\rho$ with an alternating or jointly estimated spatial parameter inside the network; the paper leaves open whether such coupling would improve predictions when spatial dependence and nonlinearity interact.
- Editorial inference: Because the spatial weights in the application are built from k-nearest-neighbor bi-square kernels on great-circle distances, the method's practical performance likely varies with the choice of neighborhood size and weight kernel, which the paper does not systematically explore.
- Editorial inference: The framework could be extended to spatiotemporal functional data by letting the spatial weight matrix and the network inputs evolve over time, a direction the paper explicitly lists as future work.
Signed reviews
Editorial analysis
A structured set of objections, weighed in public.
Referee Report
Summary. The paper proposes a spatial functional deep neural network (SFDNN) for predicting a scalar response from spatially dependent functional and scalar predictors. The model is defined in Eq. (2.4) as a nonlinear scalar-on-function regression with a spatial autoregressive component, estimated in two steps: first the spatial autocorrelation parameter ρ is estimated by maximum likelihood under an underlying linear spatial scalar-on-function model (Section 3), then a functional deep neural network is trained on spatially adjusted covariates (Section 4). The paper presents Monte Carlo simulations comparing SFDNN with an ML-based linear model and a functional deep neural network (FDNN) under Gaussian, t3, and exponential errors at three levels of spatial dependence, and applies the method to Brazilian COVID-19 data. The central claim is that SFDNN significantly outperforms both ML and FDNN in predictive accuracy, especially under strong spatial dependence and non-Gaussian errors.
Significance. If the claimed predictive advantage were valid, SFDNN would be a practically useful addition to the spatial-functional regression literature, combining flexible nonlinear modeling with autoregressive spatial dependence. The paper provides a reproducible-code link and a real-data application, which are strengths. However, the significance is currently limited because the simulation study does not generate data from the proposed nonlinear model in Eq. (2.4), and the reported ML baseline is misspecified in the data-generating process. The empirical evidence for the headline claim is therefore not established; the contribution is a plausible algorithmic idea rather than a validated method.
major comments (4)
- [Section 5, simulation DGP (equation after 'The response variable ... is generated according to')] The data-generating process is Y = (I_n - ρW)^{-1}{β0 1_n + ∫ X(u)β(u) du + ZΓ + (I_n - ρW)^{-1}ε}, which contains no link function g(·) on the conditional mean. This is not a draw from the proposed NSSoFRM in Eq. (2.4), where the conditional mean is g((I_n - ρ̂W)^{-1}(...)). Consequently, none of the Monte Carlo scenarios evaluates the nonlinear component that is claimed to be SFDNN's key advantage. The text at the end of Section 5 explicitly expects superiority 'particularly when nonlinear transformations are present (i.e., under the exponential and sigmoidal link functions)', but such scenarios are never run; only the error distribution changes across Tables 1–3. This is a load-bearing gap: the headline claim of 'significantly outperforms ... particularly in the presence of high spatial dependence and non-Gaussian errors' is supported only by simulations that never exercise a nonlinear regression function.
- [Section 5, simulation DGP and Section 3 likelihood] The error term enters the simulation as (I_n - ρW)^{-1}ε inside the braces, so the conditional error covariance is σ^2 (I_n - ρW)^{-1}(I_n - ρW)^{-T}, not σ^2 I_n. However, the ML estimation in Section 3 is derived under the assumption ε ~ N(0, σ^2 I_n), and the likelihood (Section 3) uses residuals Y - ρWY - X_c θ, which under the simulation DGP equal X_c θ + (I_n - ρW)^{-1}ε. The ML baseline is therefore fitted under a misspecified error covariance, and the very large ML MSPE at ρ = 0.9 (e.g., 37.165 in Table 1 for n_train=100) may reflect this covariance misspecification rather than an inherent advantage of SFDNN. The comparison is unfair to ML. The authors should simulate from the linear SSoFRM (2.3) with iid ε, and separately from the nonlinear model (2.4) with specified link functions, to obtain interpretable comparisons.
- [Section 4.1 and Eq. (2.4)] No consistency or identifiability argument is given for plugging the MLE ρ̂ from the linear SSoFRM into the nonlinear model (2.4). The paper asserts in Section 2 that applying (I_n - ρ̂W)^{-1} before the activation 'ensures that the spatial dependence structure is preserved', but this is not demonstrated. If the true conditional mean is nonlinear, the linear-model MLE of ρ need not be consistent for the autoregressive parameter of the nonlinear process, and the architecture in Eq. (4.6) is not guaranteed to represent E[Y | X, Z]. At minimum, a simulation generated from Eq. (2.4) with known g (e.g., exponential, sigmoidal, or identity) is needed to test whether the two-step estimator recovers the spatial dependence and yields valid predictions. Without this, the estimation procedure rests on an untested assumption that is load-bearing for the method's validity.
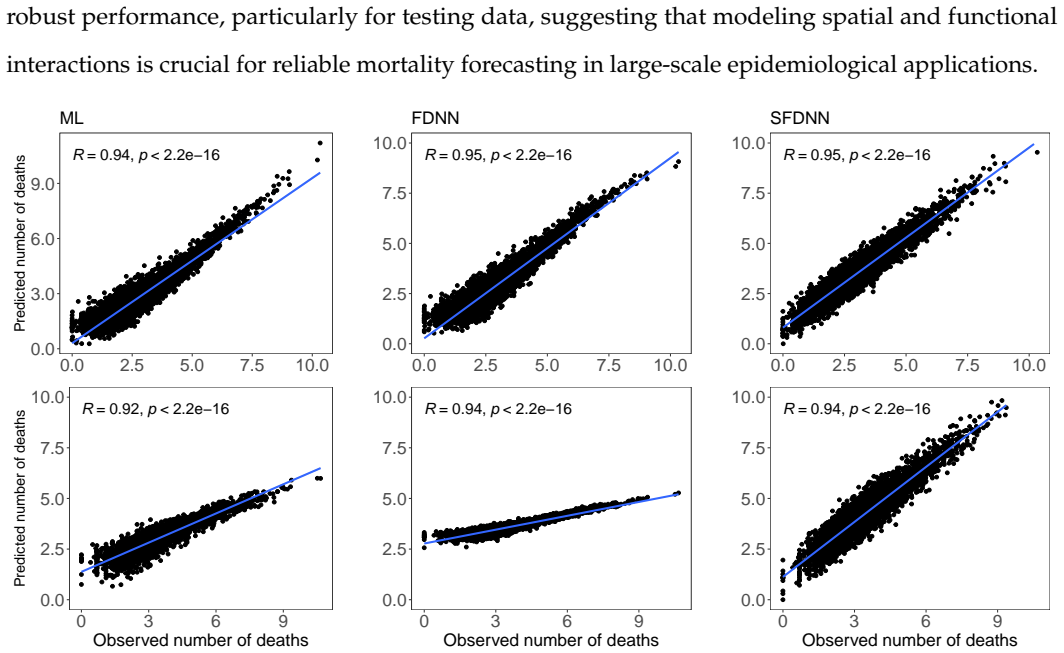
- [Section 6, Brazilian COVID-19 application] The application section contains reporting inconsistencies that obscure the model comparison. The text states SFDNN achieves an MSPE of 0.253, while 'ML and FDNN models exhibit higher RMSE values of 0.708 and 1.106', but MSPE and RMSE are not comparable on the same scale (sqrt(0.253) ≈ 0.503). The text also says the fitted models use 2022 predictors to forecast 'the average number of deaths for 2024', yet the testing period is later described as 2022 and Figure 7 labels the testing data as 2022. The prediction target and the reported error metrics should be clarified and made consistent, otherwise the empirical advantage of SFDNN is not quantitatively interpretable.
minor comments (6)
- [Section 5, Tables 1–3] The column header 'MPSE' in Tables 1–3 should be 'MSPE' to match the text and standard terminology.
- [Section 5, error distributions] The description 't3 (t-distribution with non-centrality parameter' is incomplete and imprecise; the authors should specify that this is a Student t distribution with 3 degrees of freedom and zero noncentrality (or state the noncentrality explicitly).
- [Section 6, spatial weight construction] In the description of the adaptive bandwidth, the text says 'h closest neighbors are identified', then defines H_i as the largest distance among 'these four nearest neighbors'; the 'four' appears to be a leftover and should be 'h' for consistency.
- [References] Reference 'Reiss, P. T., Goldsmith, J., Shang, H. L. and Odgen, R. T. (2017)' and 'Reiss, P. T., Goldsmith, J., Shang, H. L. and Ogden, R. T. (2017)' are duplicates with a typo in the first author name; one should be removed.
- [Section 6, terminology] The abbreviation 'SSFDNN' appears in the paragraph 'The proposed SSFDNN allows us to flexibly model...' and should be 'SFDNN' for consistency with the rest of the paper.
- [Abstract and Section 7] The paper repeatedly claims 'significantly outperforms' without reporting any statistical significance tests for the differences in MSPE across Monte Carlo simulations; adding confidence intervals or tests would strengthen the claim.
Circularity Check
No circular derivation: SFDNN is a two-stage plug-in estimator whose MSPE comparisons are out-of-sample; the identified weaknesses concern simulation validity, not circularity.
full rationale
The paper's derivation chain is an estimation algorithm, not a theorem whose conclusion is its premise. Section 3 estimates ρ by maximum likelihood under the linear SSoFRM (2.3); Section 4 fixes ρ̂, pre-multiplies covariates by (I−ρ̂W)^−1, and trains a B-spline FDNN. Prediction errors are evaluated on independent test data (n_test=1000 in Section 5; the 2022 COVID-19 test period in Section 6), so the claimed predictive advantage is not an algebraic identity or a re-display of fitted values. The self-citations—Beyaztas, Mandal and Shang (2025) for the simulation framework and Beyaztas, Shang and Mandal (2025) for COVID-19 interaction effects—motivate the experimental design and data analysis but are not invoked as a uniqueness theorem or as proof that SFDNN must outperform. The genuine limitation is that the Monte Carlo DGP in Section 5 does not simulate from the nonlinear model (2.4): the written formula Y=(I−ρW)^−1{β0 1n + ∫Xβ du + ZΓ + (I−ρW)^−1 ε} has no link function applied to the conditional mean, and the error is pre-multiplied by an extra (I−ρW)^−1, making the error covariance differ from the iid assumption in the Section 3 likelihood. That is a correctness/support gap for the headline claim, not a circular step, because no equation in the paper reduces the predicted MSPE to an input parameter by construction. Proportionately, the correct circularity score is 0.
Assumptions & free parameters
free parameters (6)
- rho (spatial autocorrelation) =
0.1, 0.5, 0.9 in simulations; estimated via ML in application
- K_p (number of FPCs) =
not reported; chosen by 95% variance criterion
- M (B-spline basis size) =
not reported
- Network hyperparameters =
not fully reported
- h (nearest neighbors in W) =
not reported
- Data transformation =
log transform chosen
assumptions (4)
- standard math Mercer's theorem and Karhunen-Loeve expansion provide a valid finite-dimensional representation of functional predictors.
- domain assumption The spatial weight matrix W is known and correctly specified.
- ad hoc to paper The two-step estimator is valid: the MLE of rho from the linear SSoFRM remains appropriate when the regression function is nonlinear.
- domain assumption Errors in the ML stage are Gaussian and homoskedastic.
Cite this review
Pith. "Pith review of Spatial Functional Deep Neural Network Model: A New Prediction Algorithm." pith.science (2026). https://pith.science/paper/HADRCTBJ
@misc{pith2026250412750,
  author       = {Pith},
  title        = {Pith review of: Spatial Functional Deep Neural Network Model: A New Prediction Algorithm},
  year         = {2026},
  howpublished = {\url{https://pith.science/paper/HADRCTBJ}},
  note         = {Machine review of arXiv:2504.12750}
}
read the original abstract
Accurate prediction of spatially dependent functional data is critical for various engineering and scientific applications. In this study, a spatial functional deep neural network model was developed with a novel non-linear modeling framework that seamlessly integrates spatial dependencies and functional predictors using deep learning techniques. The proposed model extends classical scalar-on-function regression by incorporating a spatial autoregressive component while leveraging functional deep neural networks to capture complex non-linear relationships. To ensure a robust estimation, the methodology employs an adaptive estimation approach, where the spatial dependence parameter was first inferred via maximum likelihood estimation, followed by non-linear functional regression using deep learning. The effectiveness of the proposed model was evaluated through extensive Monte Carlo simulations and an application to Brazilian COVID-19 data, where the goal was to predict the average daily number of deaths. Comparative analysis with maximum likelihood-based spatial functional linear regression and functional deep neural network models demonstrates that the proposed algorithm significantly improves predictive performance. The results for the Brazilian COVID-19 data showed that while all models achieved similar mean squared error values over the training modeling phase, the proposed model achieved the lowest mean squared prediction error in the testing phase, indicating superior generalization ability.
Figures


Figures from the paper (4 more)


Reference graph
Works this paper leans on
-
[1]
Spatial function-on-function regression
Anselin, L. (1995), ‘Local indicators of spatial association–LISA’, Geographical Analysis 27(2), 93–115. Beyaztas, U., Mandal, A. and Shang, H. L. (2025), ‘Enhancing spatial functional linear regression with robust dimension reduction methods’, Journal of Multivariate Analysis in press. Beyaztas, U., Shang, H. L. and Mandal, A. (2025), ‘Robust function-on...
work page Pith review arXiv 1995
-
[18]
Kingma, D. and Ba, J. (2014), Adam: A method for stochastic optimization, Technical report, arXiv. URL: https://arxiv.org/abs/1412.6980. Kokoszka, P . and Reimherr, M. (2017),Introduction to Functional Data Analysis, CRC Press, Boca Raton. Lin, H., Eggesbø, M. and Peddada, S. D. (2022), ‘Linear and nonlinear correlation estimators unveil undescribed taxa ...
arXiv 2014
-
[1680]
Huang, T., Saporta, G., Wang, H. and Wang, S. (2021), ‘A robust spatial autoregressive scalar-on- function regression with t-distribution’, Advances in Data Analysis and Classification 15(470), 57–81. James, G. M. and Silverman, B. W. (2005), ‘Functional adaptive model estimation’, Journal of the American Statistical Association: Theory and Method 100(470...
work page 2021
-
[2376]
Hastie, T. and Mallows, C. (1993), ‘A statistical view of some chemometrics regression tools: Discus- sion’, Technometrics 35(2), 140–143. Hong, X., Mitchell, R. J., Chen, S., Harris, C. J., Li, K. and Irwin, G. W. (2008), ‘Model selection approaches for non-linear system identification: a review’, International journal of systems science 39(10), 925–946....
work page 1993
-
[4946]
Morris, J. S. (2015), ‘Functional regression’, Annual Review of Statistics and Its Application 2(1), 321–359. 31 M ¨uller, H.-G., Wu, Y. and Yao, F. (2013), ‘Continuously additive models for nonlinear functional regression’, Biometrika 100(3), 607–622. Pineda-Rios, W., Giraldo, R. and Porcu, E. (2019), ‘Functional SAR models: with application to spatial e...
arXiv 2015
Reviewed August 16, 2026 · model on record in the stance chip above.
Discussion (0). Continue with ORCID to comment.