REVIEW 3 major objections 8 minor 78 references
ShapeTalk: Combining Natural Language and Sketch for Time-Series Pattern Querying
T0 review · 3 major / 8 minor · reviewed 2026-07-09 · glm-5.2
Pith's one-line read LLM Turns Plain English Into Editable Shape Queries for Time Series
desk verdict Solid system paper with a real evaluation gap: no baseline comparison means the coordination claim is asserted, not shown. read the letter →
The pith
A machine-rendered reading of the paper's core claim, the machinery that carries it, and where it could break.
The reading
What carries the argument
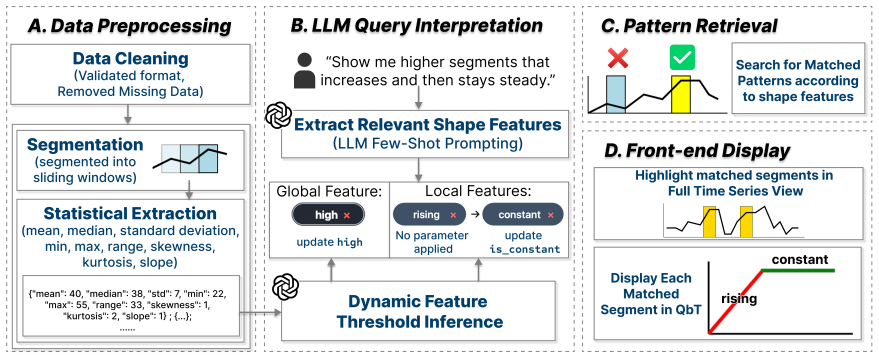
The system has three coupled components. First, an LLM-based parser uses few-shot prompting to extract ordered local shape features (e.g., rising, falling, constant, spiky) and optional global features (high, low, typical, unusual) from free-form natural language, returning a Python dictionary structure. Second, a dynamic threshold inference step sends patch-level statistical summaries (mean, variance, skewness, kurtosis, slope, etc.) to the LLM, which proposes dataset-specific threshold values for each feature predicate rather than using fixed percentiles. Third, a sliding-window matcher partitions each candidate window into equal-length subsegments for ordered local features, evaluates the
What would settle it
If the LLM parser's accuracy on real-world queries were substantially lower than the reported 86%, or if the equal-length partitioning strategy systematically mismatched user intent for composite patterns often enough that sketch-based recovery became the norm rather than the exception, the central claim of effective coordinated cross-modal refinement would weaken considerably.
Extended reading notes
Core claim
The paper's central contribution is the demonstration that an LLM can serve as a semantic compiler mapping colloquial pattern descriptions into an inspectable, editable shape-feature space, and that this representation can be tightly coupled with sketch-based querying through coordinated visual feedback. The LLM does not replace geometric search; it translates language into explicit constraints that users can verify and correct, while sketching provides a direct geometric alternative when the translation is imperfect. The user study shows this workflow works in practice: 84% of participants started with text-based queries, but sketching was selectively used for geometric specification and, 3
Load-bearing premise
The default strategy of splitting a query window into equal-length subsegments for multi-part patterns (e.g., 'rise then fall' splits into two equal halves) is assumed to match user expectations. The paper's own pilot study and failure cases show this fails for patterns with uneven temporal stages, and the workaround—asking users to specify durations in natural language—shifts the alignment burden back to the user.
Editorial extensions
If this is right
- The LLM-as-semantic-compiler pattern could extend beyond time-series to any domain where user intent is qualitative but the matching mechanism requires precise parameters—e.g., searching for spatial patterns in geographic data, or molecular substructures in chemistry.
- The dynamic threshold inference approach suggests that LLMs could replace manual parameter tuning in other interactive analysis systems where dataset-specific calibration is needed, though the latency and reliability of LLM-based thresholding at scale remains an open question.
- The finding that multimodality is opportunistic rather than mandatory challenges the assumption that multimodal interfaces must fuse inputs; keeping pipelines separate but linking outputs through shared context may be a more practical design pattern for human-in-the-loop AI systems.
- The failure cases around result filtering ('narrow down these results') suggest a natural extension toward LLM-driven conversational refinement of result sets, not just initial query specification.
Editorial analysis
A structured set of objections, weighed in public.
Referee Report
Summary. ShapeTalk presents a coordinated natural-language and sketch-based querying system for univariate time-series pattern search. The system uses an LLM-based semantic parsing pipeline to translate free-form natural-language queries into editable shape-feature constraints (adapted from QUTE [22]), while sketch-based queries are matched via Pruned Dynamic Time Warping (PDTW). The two modalities are linked through shared visual context, editable feature representations, and synchronized result views, enabling iterative cross-modal refinement. The evaluation includes two usage scenarios, a 13-participant user study with failure-case analysis, LLM parsing accuracy assessment (86% with few-shot prompting on 138 human queries), and latency benchmarks. The paper is well-motivated and the system design is thoughtful, but the evaluation does not establish the central claim that cross-modal coordination provides measurable benefit over either modality alone.
Significance. The paper addresses a genuine problem: existing time-series query tools struggle with vague, composite, or fuzzy pattern descriptions, and the combination of NL and sketch for iterative refinement is a reasonable approach. The LLM-driven semantic parsing pipeline that produces inspectable, editable feature constraints is a concrete technical contribution. The system's modularity—separate pipelines for text and sketch linked through shared context—is well-motivated by the observation that the two modalities encode different forms of intent. The inclusion of failure-case analysis and latency benchmarks adds practical credibility. The code is publicly available (Appendix F), supporting reproducibility. However, the significance of the coordination claim specifically is not yet established by the evaluation, as discussed below.
major comments (3)
- [§6.2 (User Study)] The user study has no baseline comparison—no text-only arm, no sketch-only arm, no comparison to existing systems like QUTE [22] or ShapeSearch [43]. This means the study cannot isolate the benefit of cross-modal coordination from the benefit of having either modality available. The paper's own data make this acute: in Task 1, 68% of trials were completed using only QbT, and participant P8 completed all Task 1 questions using only NL queries. The paper frames this as 'multimodality is opportunistic rather than mandatory,' but this reframing sidesteps the key question: when users did switch modalities (15 of 27 failure cases), the study never measures whether switching to QbS actually produced better outcomes than simply retrying within QbT. The 27 failure cases required on average 1.63 more operations, but without a control we cannot tell whether cross-modal switching was more effective.
- [§6.3 (LLM Parsing Quality)] The parser accuracy metric (86% with few-shot on human queries) measures exact-match agreement between LLM output and human annotation of the feature mapping, not whether the retrieved segments match user intent. A query can be parsed into the 'correct' features yet still retrieve unsatisfactory segments due to threshold or partitioning issues. The paper acknowledges this indirectly in §6.4 (14 of 27 failure cases involved unsatisfactory QbT results related to dynamic thresholding), but the evaluation does not connect parsing accuracy to end-to-end retrieval quality. Adding a measure of retrieval relevance (e.g., user-rated match quality on a sample of queries) would strengthen the claim that the pipeline is effective end-to-end.
- [§4.4 (Equal-length partitioning)] The default equal-length partitioning for multi-part queries (e.g., 'rise then fall' splits the window into two equal subsegments) is assumed to match user expectations. The paper's own pilot study and failure-case analysis show this assumption fails for patterns with uneven temporal stages (e.g., '5 days constant then 2 days declining' in §6.1). The workaround—asking users to specify durations in natural language—shifts the burden back to the user without a principled alignment mechanism. Appendix I shows that brute-force exhaustive search over all partitions is computationally infeasible (32 seconds for 3 features, L=100). The paper should more explicitly characterize when equal-length partitioning fails and how often users encounter this in practice, or explore a middle-ground alignment strategy that does not require explicit duration specification.
minor comments (8)
- [§4.3, Dynamic Threshold Inference] The comparison between LLM-derived thresholds and fixed percentile thresholds (Appendix G) is qualitative—showing highlighted regions on two datasets. A quantitative comparison (e.g., precision/recall against ground-truth labels, or user ratings of match quality) would make the claim more convincing.
- [§4.3, Patch budget] The patch budget caps (300 for local, 100 for global) are stated without justification for why these specific values were chosen. A brief sensitivity analysis or rationale would help reproducibility.
- [Table 2 (Appendix E)] The model comparison reports latency for three LLMs but does not specify the API endpoint conditions (e.g., whether calls were batched, rate-limited, or run during peak hours). Since network latency is identified as the primary bottleneck (Appendix E, Tables 6–7), these details matter for anyone attempting to reproduce results.
- [§6.2] The post-study survey results (Figure 4, Appendix D) are reported as distributions but not analyzed statistically. Given the small sample (n=13), reporting medians with confidence intervals or non-parametric tests would make the usability assessment more rigorous.
- [§5.4] The PDTW warping window size is fixed at 5 with no sensitivity analysis. A brief note on how this parameter affects match quality would be helpful.
- [Appendix B, Table 1] The 'Falling' feature description says 'Segments that rise monotonically'—this appears to be a copy-paste error and should read 'Segments that fall monotonically.'
- [§2.1] The paper states that prior systems 'can be brittle when users describe patterns in open-ended, compositional, or dataset-specific ways,' but does not provide specific examples of failure modes in these systems. A concrete example would calibrate expectations.
- [Figure 1] The exploration loop annotation (steps 1–4) is somewhat difficult to follow in the current layout. A clearer sequential diagram or numbered callouts on the interface itself would improve readability.
Circularity Check
No circularity found: derivation chain is self-contained against external benchmarks
full rationale
The paper's core pipeline—LLM parsing NL into shape features, dynamic threshold inference from dataset statistics, sliding-window matching—is not circular. (1) The shape-feature vocabulary is adapted from QUTE [22] (external authors), not invented by the present authors. (2) LLM parsing accuracy (86%) is evaluated against independent human annotations of 138 real + 42 synthetic queries, not against the system's own outputs. (3) Dynamic thresholds are inferred from patch-level statistical summaries of the dataset, not fitted to target retrieval results; Appendix G provides an external comparison against fixed percentile thresholds. (4) The pilot studies (§4.4) are formative evaluations used to refine prompts and validate design choices, not self-referential validations. (5) The anti-collision algorithm follows prior work [31], which shares an author (Dongyu Liu), but this is a standard algorithmic reference that is not load-bearing for the central claim of cross-modal coordination. The skeptic's concerns about missing baselines and whether cross-modal switching outperforms same-modal retry are evaluation-rigor concerns, not circularity: the paper does not claim a prediction that reduces by construction to a fitted input. No step in the derivation chain reduces to its own inputs by definition or self-citation.
Assumptions & free parameters
free parameters (5)
- Query window length L =
default 6; user-adjustable
- Dynamic feature thresholds (theta_k) =
inferred per-dataset by LLM from patch statistics
- PDTW warping window size =
5
- Patch budget caps =
300 (local), 100 (global)
- Few-shot prompt examples =
26 examples (after pilot refinement)
assumptions (4)
- domain assumption Shape features adapted from QUTE [22] (rising, falling, constant, etc.) form a sufficient vocabulary for describing time-series patterns that users care about.
- ad hoc to paper Equal-length partitioning of query windows for multi-part patterns matches user expectations as a default.
- domain assumption LLM-inferred thresholds from patch-level statistics produce meaningful cutoffs for shape features.
- domain assumption GPT-4o's parsing behavior is sufficiently stable for interactive use.
invented entities (1)
-
None
independent evidence
Cite this review
Pith. "Pith review of ShapeTalk: Combining Natural Language and Sketch for Time-Series Pattern Querying." pith.science (2026). https://pith.science/paper/HB3OJ65H
@misc{pith2026260707073,
  author       = {Pith},
  title        = {Pith review of: ShapeTalk: Combining Natural Language and Sketch for Time-Series Pattern Querying},
  year         = {2026},
  howpublished = {\url{https://pith.science/paper/HB3OJ65H}},
  note         = {Machine review of arXiv:2607.07073}
}
read the original abstract
Searching for time-series segments that match user-defined patterns is important in domains such as finance, climate science, and healthcare. However, existing visual query tools often struggle to support vague, composite, or fuzzy pattern descriptions, often requiring users to express their intent through precise sketches or rigid structured filters. We present ShapeTalk, a coordinated natural-language and sketch-based querying system for univariate time-series pattern search. Rather than treating text and sketch as a fused input stream, ShapeTalk uses them as complementary representations of analytic intent: natural language supports semantic and compositional pattern descriptions, while sketching supports direct geometric refinement. The two modalities are linked through a shared visual context, editable feature representations, and synchronized result views, enabling users to move between text and sketch during iterative query formulation. At its core is an LLM-based semantic parsing pipeline that translates free-form natural-language queries into interpretable and editable shape-feature constraints. We evaluate ShapeTalk through two usage scenarios, a user study with failure-case analysis, and an assessment of the LLM-based semantic parsing pipeline. The results show that ShapeTalk supports effective time-series pattern search, with natural language serving as an accessible entry point and sketching providing a complementary mechanism for refinement and recovery when textual specifications are insufficient.
Figures


Figures from the paper (1 more)

Reference graph
Works this paper leans on
-
[22]
H. Hochheiser. Interactive querying of time series data. InExtended abstracts of the 2002 Conference on Human Factors in Computing Systems, CHI 2002, pp. 552–553. ACM, 2002. doi: 10.1145/506443.506477 2
-
[43]
K. Ryall, N. Lesh, T. Lanning, D. Leigh, H. Miyashita, and S. Makino. Querylines: approximate query for visual browsing. InCHI ’05 Extended Abstracts on Human Factors in Computing Systems, pp. 1765–1768, 2005. doi: 10.1145/1056808.1057017 2
-
[1]
N. S. Agarwal and S. K. Sonbhadra. A review on large language models for visual analytics.ArXiv, abs/2503.15176, 2025. doi: 10.48550/arXiv. 2503.15176 3
-
[2]
R. Agrawal, G. Psaila, E. L. Wimmers, and M. Zaït. Querying shapes of histories. InProceedings of 21th International Conference on Very Large Data Bases, pp. 502–514, 1995. 2
work page 1995
-
[3]
W. Aigner, S. Miksch, H. Schumann, and C. Tominski.Visualization of time-oriented data, vol. 4. Springer, 2011. doi: 10.1007/978-1-4471-7527 -8 3
-
[4]
A. Alhargan, N. Cooke, and T. Binjammaz. Multimodal affect recognition in an interactive gaming environment using eye tracking and speech signals. InProceedings of the 19th ACM International Conference on Multimodal Interaction, pp. 479–486. Association for Computing Machinery, 2017. doi: 10.1145/3136755.3137016 3
-
[5]
M. Amini, F. Zayeri, and M. Salehi. Trend analysis of cardiovascular disease mortality, incidence, and mortality-to-incidence ratio: results from global burden of disease study 2017.BMC public health, 21(1):401, 2021. doi: 10.1186/s12889-021-10429-0 1
-
[6]
A. Bendeck, D. Bromley, and V . Setlur. Slopeseeker: A search tool for exploring a dataset of quantifiable trends. InProceedings of the 29th International Conference on Intelligent User Interfaces, pp. 817–836,
Show all 78 references
-
[7]
doi: 10.1145/3640543.3645208 2, 3
-
[8]
D. J. Berndt and J. Clifford. Using dynamic time warping to find patterns in time series. InProceedings of the 3rd international conference on knowledge discovery and data mining, pp. 359–370, 1994. 2
1994
-
[9]
put-that-there
R. A. Bolt. “put-that-there”: V oice and gesture at the graphics interface. SIGGRAPH Computer Graphics, 14(3):262–270, 1980. doi: 10.1145/ 965105.807503 3
1980
-
[10]
Brehmer, B
M. Brehmer, B. Lee, B. Bach, N. H. Riche, and T. Munzner. Timelines revisited: A design space and considerations for expressive storytelling. IEEE Transactions on Visualization and Computer Graphics, 23(9):2151– 2164, 2016. doi: 10.1109/TVCG.2016.2614803 3
2016 doi
-
[11]
Brône and B
G. Brône and B. Oben. Mobile eye-tracking FOR multimodal interaction analysis. InThe Routledge Handbook of Experimental Linguistics, pp. 283–298. Routledge, 2023. doi: 10.4324/9781003392972-21 3
2023 doi
-
[12]
Buono, A
P. Buono, A. Aris, C. Plaisant, A. Khella, and B. Shneiderman. Interactive pattern search in time series. InVisualization and Data Analysis 2005, vol. 5669 ofSPIE Proceedings, pp. 175–186, 2005. doi: 10.1117/12.587537 2
2005 doi
-
[13]
J. Chen, J. Wu, J. Guo, V . Mohanty, X. Li, J. P. Ono et al. Interchat: Enhancing generative visual analytics using multimodal interactions. In Computer Graphics Forum, p. e70112. Wiley Online Library, 2025. doi: 10.1111/cgf.70112 3
2025 doi
- [14]
-
[15]
Correll and M
M. Correll and M. Gleicher. The semantics of sketch: Flexibility in visual query systems for time series data. In2016 IEEE Conference on Visual Analytics Science and Technology (VAST), pp. 131–140. IEEE, 2016. doi: 10.1109/V AST.2016.7883519 2
2016 doi
-
[16]
V . Dibia. LIDA: A tool for automatic generation of grammar-agnostic visualizations and infographics using large language models. InProceed- ings of the 61st Annual Meeting of the Association for Computational Linguistics (Volume 3: System Demonstrations), pp. 113–126, 2023. d...
2023 doi
-
[17]
R. D. Edwards, J. Magee, and C. B. W. H.˙Technical Analysis of Stock Trends. CRC Press, Boca Raton, 11th ed., 2018. doi: 10.4324/ 9781315115719 1
2018
-
[18]
C. Fan, K. Matkovi ´c, and H. Hauser. Sketch-based fast and accurate querying of time series using parameter-sharing lstm networks.IEEE Transactions on Visualization and Computer Graphics, 27(12):4495–4506,
-
[19]
doi: 10.1109/TVCG.2020.3002950 2
2020 doi
-
[20]
Fuchs, F
J. Fuchs, F. Fischer, F. Mansmann, E. Bertini, and P. Isenberg. Evaluation of alternative glyph designs for time series data in a small multiple setting. InProceedings of the CHI Conference on Human Factors in Computing Systems, pp. 3237–3246, 2013. doi: 10.1145/2470654.2466443 3
2013 doi
-
[21]
Geler, V
Z. Geler, V . Kurbalija, M. Ivanovi´c, M. Radovanovi´c, and W. Dai. Dy- namic time warping: Itakura vs sakoe-chiba. In2019 IEEE International Symposium on INnovations in Intelligent SysTems and Applications (IN- ISTA), pp. 1–6. IEEE, 2019. doi: 10.1109/INISTA.2019.8778300 7
2019 doi
-
[23]
Hoque and M
E. Hoque and M. S. Islam. Natural language generation for visualizations: State of the art, challenges and future directions. InComputer Graphics Forum, vol. 44, p. e15266. Wiley Online Library, 2025. doi: 10.1111/cgf. 15266 3
2025 doi
-
[24]
Imani, S
S. Imani, S. Alaee, and E. Keogh. Qute: Query by text search for time series data. InProceedings of the Future Technologies Conference (FTC) 2020, Volume 2, pp. 412–427. Springer International Publishing, 2021. doi: 10.1007/978-3-030-63089-8_27 2, 3, 4
2020 doi
-
[25]
Javed, B
W. Javed, B. McDonnel, and N. Elmqvist. Graphical perception of multiple time series.IEEE Transactions on Visualization and Computer Graphics, 16(6):927–934, 2010. doi: 10.1109/TVCG.2010.162 3
2010 doi
-
[26]
Kavaz, A
E. Kavaz, A. Puig, and I. Rodríguez. Chatbot-based natural language interfaces for data visualisation: A scoping review.Applied Sciences, 13(12), 2023. doi: 10.3390/app13127025 3
2023 doi
-
[27]
Y .-H. Kim, B. Lee, A. Srinivasan, and E. K. Choe. Data@Hand: Fostering visual exploration of personal data on smartphones leveraging speech and touch interaction. InProceedings of the CHI Conference on Human Factors in Computing Systems. Association for Computing Machinery,
-
[28]
doi: 10.1145/3411764.3445421 3
-
[29]
D. J.-L. Lee, J. Lee, T. Siddiqui, J. Kim, K. Karahalios, and A. Parameswaran. You can’t always sketch what you want: Understanding sensemaking in visual query systems.IEEE transactions on visualization and computer graphics, 26(1):1267–1277, 2019. doi: 10.1109/TVCG. 2019.2934666 2
2019 doi
-
[30]
S. Y .-T. Lee, C. Ji, S. Wen, L. Huang, D. Liu, and K.-L. Ma. Videe: Visual and interactive decomposition, execution, and evaluation of text analytics with intelligent agents.arXiv preprint arXiv:2506.21582, 2025. doi: 10. 48550/arXiv.2506.21582 3
2025 arXiv
-
[31]
Lekschas, B
F. Lekschas, B. Peterson, D. Haehn, E. Ma, N. Gehlenborg, and H. Pfister. Peax: Interactive visual pattern search in sequential data using unsuper- vised deep representation learning. InComputer Graphics Forum, vol. 39, pp. 167–179. Wiley Online Library, 2020. doi: 10.1111/CGF.13971 2
2020 doi
-
[32]
L. Li, X. Su, Y . Zhang, Y . Lin, and Z. Li. Trend modeling for traffic time series analysis: An integrated study.IEEE Transactions on Intelligent Transportation Systems, 16(6):3430–3439, 2015. doi: 10.1109/TITS.2015 .2457240 1
2015 doi
- [33]
-
[34]
D. Liu, S. Alnegheimish, A. Zytek, and K. Veeramachaneni. MTV: visual analytics for detecting, investigating, and annotating anomalies in multi- variate time series.Proc. ACM Hum. Comput. Interact., 6(CSCW1):103:1– 103:30, 2022. doi: 10.1145/3512950 3, 6
2022 doi
-
[35]
S. Liu, Y . Tian, Z. Deng, W. Cui, H. Zhang, D. Weng et al. Relation-driven query of multiple time series.IEEE Transactions on Visualization and Computer Graphics, 2024. doi: 10.1109/TVCG.2024.3397554 2
2024 doi
-
[36]
Mannino and A
M. Mannino and A. Abouzied. Expressive time series querying with hand- drawn scale-free sketches. InProceedings of the 2018 CHI Conference on Human Factors in Computing Systems, pp. 1–13, 2018. doi: 10.1145/ 3173574.3173962 2
2018
-
[37]
Masson, S
D. Masson, S. Malacria, G. Casiez, and D. V ogel. DirectGPT: A direct manipulation interface to interact with Large Language Models. InPro- ceedings of the 2024 CHI Conference on Human Factors in Computing Systems (CHI ’24), art. no. 975, 16 pages, 2024. doi: 10.1145/3613904. ...
2024 doi
-
[38]
Mudelsee
M. Mudelsee. Trend analysis of climate time series: A review of methods. Earth-Science Reviews, 190:310–322, 2019. doi: 10.1016/j.earscirev.2018 .12.005 1
2019 doi
-
[39]
Narechania, A
A. Narechania, A. Srinivasan, and J. Stasko. Nl4dv: A toolkit for gener- ating analytic specifications for data visualization from natural language queries.IEEE Transactions on Visualization and Computer Graphics, 27(2):369–379, 2021. doi: 10.1109/TVCG.2020.3030378 3
2021 doi
-
[40]
T. Qiu, F. Wang, S. Huang, M. Guo, Y . Zhao, J. Li et al. Smartmlvs: Llm-enabled multiple linked views generation for interactive visualization. 2025 IEEE 18th Pacific Visualization Conference (PacificVis), pp. 58–68,
2025
-
[41]
doi: 10.1109/PacificVis64226.2025.00012 3
2025 doi
-
[42]
N. Ruta, N. Sawada, K. McKeough, M. Behrisch, and J. Beyer. Sax navigator: Time series exploration through hierarchical clustering. In 2019 IEEE Visualization Conference (VIS), pp. 236–240. IEEE, 2019. doi: 10.1109/VISUAL.2019.8933618 3
2019 doi
-
[44]
L. Shen, E. Shen, Y . Luo, X. Yang, X. Hu, X. Zhang et al. Towards natural language interfaces for data visualization: A survey.IEEE Transactions on Visualization and Computer Graphics, 29(6):3121–3144, 2023. doi: 10 .1109/TVCG.2022.3148007 3
2023
-
[45]
L. Shen, Y . Zhang, H. Zhang, and Y . Wang. Data player: Automatic gener- ation of data videos with narration-animation interplay.IEEE Transactions on Visualization and Computer Graphics, 30(1):109–119, 2024. doi: 10. 1109/TVCG.2023.3327197 3
2024
-
[46]
C. Shi, W. Cui, C. Liu, C. Zheng, H. Zhang, Q. Luo et al. Nl2color: Refining color palettes for charts with natural language.IEEE Transactions on Visualization and Computer Graphics, 30(1):814–824, 2024. doi: 10. 1109/TVCG.2023.3326522 3
2024
-
[47]
Siddiqui, P
T. Siddiqui, P. Luh, Z. Wang, K. Karahalios, and A. Parameswaran. Shape- search: A flexible and efficient system for shape-based exploration of trendlines. InProceedings of the 2020 ACM SIGMOD International Con- ference on Management of Data, SIGMOD ’20, pp. 51–65, 2020. doi: ...
2020
-
[48]
Sultanum and A
N. Sultanum and A. Srinivasan. Datatales: Investigating the use of large language models for authoring data-driven articles. In2023 IEEE Visu- alization and Visual Analytics (VIS), pp. 231–235. IEEE, 2023. doi: 10. 1109/VIS54172.2023.00055 3
2023
-
[49]
B. Tang, A. Boggust, and A. Satyanarayan. VisText: A benchmark for semantically rich chart captioning. InProceedings of the 61st Annual Meeting of the Association for Computational Linguistics, pp. 7268–7298,
-
[50]
doi: 10.18653/v1/2023.acl-long.401 3
2023 doi
-
[51]
Y . Tian, W. Cui, D. Deng, X. Yi, Y . Yang, H. Zhang et al. Chartgpt: Leveraging llms to generate charts from abstract natural language.IEEE Transactions on Visualization and Computer Graphics, 31(3):1731–1745,
-
[52]
doi: 10.1109/TVCG.2024.3368621 3
2024 doi
-
[53]
M. A. Turk. Multimodal interaction: A review.Pattern Recognition Letters, 36:189–195, 2014. doi: 10.1016/J.PATREC.2013.07.003 3
2014 doi
-
[54]
J. J. Van Wijk and E. R. Van Selow. Cluster and calendar based visu- alization of time series data. In1999 InfoVis, pp. 4–9, 1999. doi: 10. 1109/INFVIS.1999.801851 3
1999
-
[55]
P.-P. Vázquez. Are llms ready for visualization? In2024 IEEE 17th Pacific Visualization Conference (PacificVis), pp. 343–352, 2024. doi: 10. 1109/PacificVis60374.2024.00049 3
2024
-
[56]
F. Wang, B. Wang, X. Shu, Z. Liu, Z. Shao, C. Liu et al. Chartinsighter: An approach for mitigating hallucination in time-series chart summary generation with a benchmark dataset.IEEE Transactions on Visualization and Computer Graphics, 2025. doi: 10.1109/TVCG.2025.3567122 5
2025 doi
-
[57]
J. Wang, S. Liu, and W. Zhang. Visual analytics for machine learning: A data perspective survey.IEEE Transactions on Visualization and Computer Graphics, 30(12):7637–7656, 2024. doi: 10.1109/TVCG.2024.3357065 3
2024 doi
-
[58]
L. Wang, S. Zhang, Y . Wang, E.-P. Lim, and Y . Wang. Llm4vis: Explain- able visualization recommendation using chatgpt. pp. 675–692, 01 2023. doi: 10.18653/v1/2023.emnlp-industry.64 3
2023 doi
-
[59]
Y . Wang, Z. Hou, L. Shen, T. Wu, J. Wang, H. Huang et al. Towards natural language-based visualization authoring.IEEE Transactions on Visualization and Computer Graphics, 29(1):1222–1232, 2023. doi: 10. 1109/TVCG.2022.3209357 3
2023
-
[60]
Weber, M
M. Weber, M. Alexa, and W. Müller. Visualizing time-series on spirals. In 2001 InfoVis, vol. 1, pp. 7–14, 2001. doi: 10.1109/INFVIS.2001.963273 3
2001 doi
-
[61]
S. Xiao, S. Huang, Y . Lin, Y . Ye, and W. Zeng. Let the chart spark: Embedding semantic context into chart with text-to-image generative model.IEEE Transactions on Visualization and Computer Graphics, 30(1):284–294, 2024. doi: 10.1109/TVCG.2023.3326913 3
2024 doi
-
[62]
J. J. Yang, T. Chen, F. Qin, M. S. Lam, and J. A. Landay. HybridTrak: Adding full-body tracking to vr using an off-the-shelf webcam. InPro- ceedings of the CHI Conference on Human Factors in Computing Sys- tems. Association for Computing Machinery, 2022. doi: 10.1145/3491102 ....
2022 doi
-
[63]
Y . Ye, J. Hao, Y . Hou, Z. Wang, S. Xiao, Y . Luo et al. Generative ai for visualization: State of the art and future directions.Visual Informatics, 8(2):43–66, 2024. doi: 10.1016/j.visinf.2024.04.003 3
2024 doi
-
[64]
Y . Yu, T. Becker, P. Schichtel, W. Aigner, A. Telea, and M. Behrisch. Noops: Nonmyopic feedback-driven pattern search in multivariate time series.Available at SSRN 5193693, 2025. doi: 10.2139/ssrn.5180352 2, 3
2025 doi
-
[65]
Y . Yu, Y . Wang, Y . Zhang, H. Qu, and D. Liu. Inclusiviz : Visual analytics of human mobility data for understanding and mitigating urban segregation. IEEE Transactions on Visualization and Computer Graphics, 31(6):3836– 3849, 2025. doi: 10.1109/TVCG.2025.3567117 3
2025 doi
-
[66]
Zhang, Z
Z. Zhang, Z. Shao, and A. Crotty. Deepsketch: A query sketching interface for deep time series similarity search.Proc. VLDB Endow., 17(12):4369–4372, Aug. 2024. doi: 10.14778/3685800.3685877 2
2024 doi
-
[67]
Y . Zhao, J. Wang, L. Xiang, X. Zhang, Z. Guo, C. Turkay et al. LightV A: Lightweight visual analytics with LLM agent-based task planning and execution.IEEE Transactions on Visualization and Computer Graphics, pp. 1–13, 2024. doi: 10.1109/TVCG.2024.3496112 3
2024 doi
-
[68]
rising
Y . Zhao, Y . Zhang, Y . Zhang, X. Zhao, J. Wang, Z. Shao et al. Leva: Using large language models to enhance visual analytics.IEEE Transactions on Visualization and Computer Graphics, pp. 1–17, 2024. doi: 10.1109/ TVCG.2024.3368060 3 Appendix Table of Contents Appendix A: Pro...
2024
-
[69]
global
Global features MUST be placed only in the " global " key in the dictionary at most 1 feature per query : " high ", "low", " typical ", " unusual "
-
[70]
local " key in the dictionary :
Local features MUST be placed only in the " local " key in the dictionary : " rising ", " falling ", " concave ", " convex ", " linear ", "non - linear ", " constant ", " smooth ", " noisy ", " complex ", " simple ", " spiky ", " dropout ", " periodic ", " aperiodic ", " symme...
-
[71]
high ",
Global features must only appear under the ’global ’ key , and local features must only appear under the ’local ’ key. 22" high ", "low", " typical ", " unusual " CANNOT appear in ’local ’ key like the following
-
[72]
Do not include any explanations , commentary , or reasoning
-
[73]
query ":
Do not wrap the dictionary in any formatting (e.g., no triple backticks , no python label , no quotation marks around the entire dictionary ). 25 26After reading this instruction , do not generate new queries or paraphrase the input . 27Your response must consist of only a val...
2021
-
[74]
Find segments where volume is high and then falls
-
[75]
Identify phases of steady temperature rise followed by a sudden drop
-
[76]
Track periods of high consumer interest followed by a sudden drop
-
[77]
Identify when energy consumption spikes to high levels and stabilizes
-
[78]
Find segments where data is generally low with an increase and then a decrease
Show parts where there is a symmetrical rise and fall. We use a medium-sized time-series dataset, Sacramento weather dataset. Each query is executed four times per model (20 runs per model in total). We record the total end-to-end latency per run and then compute the mean, min...
Reviewed July 9, 2026 · model on record in the stance chip above.
Discussion (0). Continue with ORCID to comment.