REVIEW 5 major objections 5 minor 122 references
Perception-aware Sampling for Scatterplot Visualizations
T0 review · 5 major / 5 minor · reviewed 2026-08-16 · deepseek-v4-flash
Pith's one-line read Perception-aware sampling for scatterplots selects points by weighting saliency and density inside a greedy farthest-point heuristic, yielding samples that the paper shows are perceptually closer to the original data than five prior…
desk verdict Useful new sampling method for scatterplots, but the headline outperformance claim rests on a self-referential DVS evaluation and a too-thin user study. read the letter →
The pith
A machine-rendered reading of the paper's core claim, the machinery that carries it, and where it could break.
The reading
What carries the argument
The load-bearing object is the per-point perception weight $w_p = \max(q_s, \gamma \cdot q_d)$, which turns a saliency heatmap into a sampling score: $q_s$ says where attention is predicted to go, $q_d$ adds the density information that saliency models miss, and the $\max$ ensures either can elevate a point. PAwS plugs this weight into a greedy farthest-first traversal, scoring candidates as $w_y \cdot \min_{x \in D'} d(y, x)$; the multiplicative combination is what balances perception with coverage, so the sample does not collapse onto attention hotspots. ApproPAwS adds a second mechanism: a quad-tree partition splits any cell whose Chamfer distance to uniform random points exceeds $\lambda$ or whose perception-weight variance exceeds $\sigma$, yielding a compressed box representation from which representative points are drawn uniformly, so the approximate visualization never touches the original data.
What would settle it
Run an eye-tracking study where participants view the full scatterplot and then pairs of samples; if fixation maps on PAwS samples are not systematically closer to fixation maps on the full data than the baselines' fixation maps are, the perception-preservation claim fails. A cheaper test is to swap the DVS model for a different saliency model or for human-fixation maps inside the pipeline and re-run the same five metrics; if the reported gains vanish, PAwS's advantage is an artifact of self-evaluation with the same model family.
Extended reading notes
Core claim
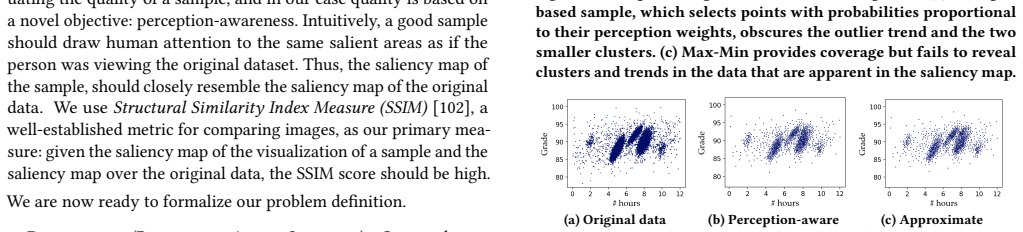
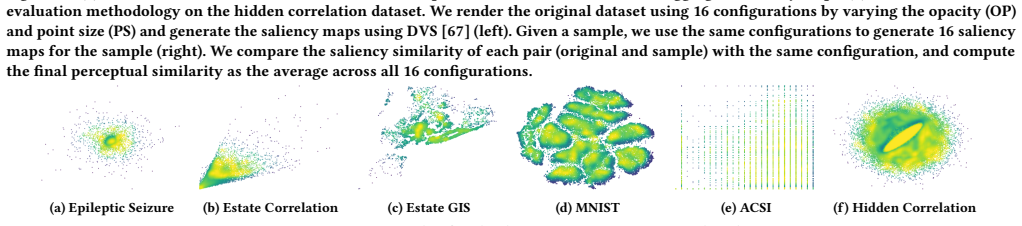
The central claim is that the best scatterplot sample is the one that distorts the original image's saliency map least, and that this objective can be chased with a greedy farthest-point heuristic. PAwS assigns each point a perception weight $w_p = \max(q_s, \gamma \cdot q_d)$, where $q_s$ is the saliency value from the Data Visualization Saliency model aggregated across 16 rendering configurations and $q_d$ is a kernel-density estimate, with $\gamma$ set adaptively from the variance of densities. It then iteratively adds the point maximizing $w_y \cdot \min_{x \in D'} d(y, x)$, a multiplicative score that forces the sample to favor salient and dense regions while still covering the whole point cloud. The paper reports that PAwS consistently outscores five baselines on SSIM, CC, SIM, 1-JSD, and EMD across six datasets, reaches a given perceptual similarity at far smaller sample sizes, and that ApproPAwS, sampling from a quad-tree-compressed representation, matches PAwS's saliency scores while running up to 100x faster on a 3.5-million-point dataset.
Load-bearing premise
The paper's quantitative case assumes that the DVS saliency model's predicted attention maps faithfully mirror what humans actually see in scatterplots, because all five evaluation metrics compare saliency maps produced by that same model family and the paper explicitly declines to test this assumption.
Editorial extensions
If this is right
- PAwS needs fewer points to reach a target perceptual similarity: with 844 points it averages a 0.75 SSIM score where VAS needs roughly five times as many points.
- PAwS is orders of magnitude faster than VAS and blue-noise on large data, reducing sample generation from hours to minutes on a 3.5-million-point dataset.
- ApproPAwS's compressed representation lets analysts generate approximate visualizations without re-reading the original data, with reported speedups up to 100x and saliency-similarity scores close to PAwS.
- Because the saliency model is a plug-in black box, future improvements in visualization saliency prediction should carry over directly to better perception-aware samples.
Reading between the lines
- The evaluation scores samples with the same saliency-model family that builds the sampling weights; a human-fixation benchmark would give a fairer test, and the paper's own 17-participant study shows blue-noise slightly ahead in the 'best overall' category.
- PAwS's advantage is concentrated on datasets with hidden or mixed structure, such as the synthetic Hidden Correlation; on uniformly clustered data like MNIST all methods converge, suggesting perception-aware sampling matters most when structure is easily missed.
- ApproPAwS's boxes could serve as a spatial index for interactive exploration, allowing re-sampling at new zoom levels or filtered regions from the same compressed representation without recomputing saliency.
- The aggregation of saliency across rendering configurations (currently the per-pixel maximum) is an arbitrary choice; testing other fusion rules or replacing DVS with another model would reveal how much of the gain depends on that choice.
Signed reviews
Editorial analysis
A structured set of objections, weighed in public.
Referee Report
Summary. The paper introduces perception-aware sampling for scatterplots. It proposes a perception-augmented database that stores aggregated Data Visualization Saliency (DVS) maps, augments them with density information to define per-point perception weights w_p = max(q_s, gamma*q_d), and then runs a greedy Max-Min-style algorithm (PAwS) that selects points maximizing weight times distance to the current sample. A second algorithm, ApproPAwS, uses a quad-tree compression of the canvas into boxes with approximately uniform data and similar perception weights, then samples representative points from boxes instead of the true data, claiming up to 100x speedups with minimal perceptual loss. The paper evaluates PAwS and ApproPAwS against Random, DBS, Max-Min, VAS, and Blue-noise on six datasets using five saliency-map similarity metrics (SSIM, CC, SIM, JSD, EMD) and reports a 17-participant user study in which PAwS is often preferred.
Significance. If the perception premise is externally validated, the work is a meaningful step: it is, to my knowledge, a clean and modular proposal for making sampling objectives perception-aware rather than purely geometric or statistical. PAwS is a simple O(kn) greedy extension of Max-Min, ApproPAwS addresses scalability in a principled way, and the paper is honest in Section 2.4 that it treats DVS as a black-box component. The evaluation design, with five metrics, six datasets, and aggregate saliency over multiple visual configurations, is thorough on its own terms. However, the significance of the central claim is conditional on the DVS saliency model being a faithful proxy for human perception of scatterplots, and that premise is not independently established in the paper.
major comments (5)
- [Section 5 and Section 3.1] The quantitative evaluation is self-referential: the five metrics (SSIM, CC, SIM, JSD, EMD) all compare DVS saliency maps of the sample against DVS saliency maps of the original data (Section 5, Figure 18b), while PAwS derives its perception weights from the same aggregate DVS saliency with w_p = max(q_s, gamma*q_d) (Section 3.1). Optimizing and scoring with the same model family can produce systematic advantages that reflect fitting DVS rather than preserving what humans perceive. Section 2.4 explicitly disclaims evaluating how well saliency models capture visual attention, so the user study is the only independent check in the paper. The central claim of consistent outperformance will be load-bearing only if the paper adds external validation, such as eye-tracking or a larger user study covering all methods and ApproPAwS, or a sensitivity analysis that varies the saliency model to show the conclusions are not an artifact of the DVS choice.
- [Section 6.1, Figure 15] The user study is too weak to carry the central perception claim alone. It has 17 participants and roughly 50 trials per comparison pair, reports no significance tests or confidence intervals, and in the 'best overall' category Blue-noise is slightly preferred over PAwS, which is the opposite of the paper's overall narrative. Since this is the only external evidence connecting the sampling objective to human perception, the paper should report per-dataset effect sizes with statistical tests (including multiple-comparison correction), and the inconclusive best-overall result should be discussed rather than minimized.
- [Section 6.2, Figure 16, Appendix A] The claim that ApproPAwS achieves 'minimal loss in visual fidelity' is supported only by the same DVS-based metrics used to construct the method, and ApproPAwS was not included in the user study. In addition, the compression thresholds for ACSI are adjusted differently from the other datasets 'to observe notable differences across compression schemes' (Section 6.2 and Appendix A), which is a post hoc selection that weakens the robustness claim. The paper should provide a sensitivity analysis over lambda, sigma, and C, and ideally independent evaluation of ApproPAwS outputs, before claiming comparable fidelity to PAwS.
- [Section 6, footnote 8] For Hidden Correlation, the largest dataset (~3.5M points), the density component of the perception weight was not computed with the kernel density estimator but approximated by rendering the data with a small point size and opacity. Because Hidden Correlation is also a dataset where PAwS shows particularly large reported gains, this substitution should be disclosed prominently in the main evaluation section and its effect on the density term in w_p should be analyzed.
- [Algorithm 2] Algorithm 2 as written is not well-defined: line 6 initializes D' with 'a random point in P', but P is the set of partitions/boxes, not data points, so the distance d(r,x) in line 8 and the membership test in line 10 are not defined as printed. This should be corrected (e.g., initialize from the representative set R) before the ApproPAwS runtime and results can be reproduced.
minor comments (5)
- [Section 5, JSD formula] The Jensen-Shannon Divergence formula has a typo: the second term should be D_KL(q_D || mu), not D_KL(p_D' || mu), otherwise the expression is not symmetric as claimed.
- [Figure 15 caption] The caption states that 'Vas is slightly preferred in the best overall category', while the body text says Blue-noise slightly overtakes PAwS in that category; the reported result should be made consistent between the caption and the text.
- [Section 3.1] The adaptive setting of gamma via a sigmoid mapping of density variance is described only verbally; the paper should give the concrete mapping and any default parameter values so that the method is reproducible.
- [Figure 10] The labeling of low, medium, and high compression in Figure 10 is confusing because the lower-right panel is described as the highest compression in the caption but the relative order of the panels is not labeled directly in the figure; please add explicit labels.
- [Algorithm 2] Line 10 says 'where v in b', but v is a representative point, not a box; please clarify that b is the box from which v was originally drawn.
Circularity Check
Quantitative evaluation is self-referential: PAwS is built from DVS saliency weights and scored by DVS saliency similarity; the user study provides independent but limited support.
-
self definitional
[Section 2.1 (Measuring quality), Section 3.1 (Deriving perception weights), Section 5 (Perceptual Similarity Metrics)]
"Saliency maps ... predict areas of a visualization that attract viewers' attention ... The system derives a per-tuple saliency score q_s on the fly ... The perception-augmented DB then derives a perception weight for each point as w_p = max(q_s, γ·q_d) ... We use well-established image- and distribution-based metrics to measure how similar the saliency of a sample is to the saliency of the original data."
PAwS's selection score is w_p = max(q_s, γ·q_d), where q_s is read from the DVS saliency map, and all five quantitative metrics (SSIM, CC, SIM, JSD, EMD) compare DVS saliency maps of the sample and the original data. A method that deliberately places points where DVS predicts saliency will, by construction, tend to make the DVS saliency map of its sample resemble the DVS saliency map of the original, so the reported quantitative outperformance over methods that do not use DVS is partly an artifact of the same model appearing on both sides.
full rationale
The algorithmic derivation of PAwS itself is not circular: it is a genuine greedy Max-Min variant with a multiplicative perception-weight/distance objective, and its runtime and coverage behavior are independently defined. The circularity is in the evaluation of the central perceptual-quality claim. The perception weights are derived from the aggregate DVS saliency map, and the quantitative quality metrics compare DVS saliency maps; thus the benchmark rewards exactly the model family used to build the method. This is a real, quotable reduction: w_p = max(q_s, γ·q_d) and the metrics both use DVS. However, the paper also conducts a user study with human participants, which is an external check on the claim that humans prefer PAwS samples, so the central claim has independent content beyond the self-referential metrics. That independent content is limited: 17 participants, roughly 50 trials per matchup, no inferential statistics, and Blue-noise slightly overtaking PAwS in the 'best overall' category. The paper's explicit disclaimer that it does not evaluate saliency-model validity (Section 2.4) further shows that the load-bearing premise of the quantitative evaluation is assumed rather than tested. On balance, the quantitative superiority claim is partially circular, but the user study keeps the paper from being wholly self-referential; hence a score of 4 rather than 6 or higher.
Assumptions & free parameters
free parameters (4)
- gamma density influence =
adaptive via sigmoid of density variance; exact mapping unspecified
- compression thresholds lambda and sigma =
0.001 to 0.01; changed for ACSI to 0.005 and 0.01
- representatives per box C =
not specified
- saliency aggregation mode =
maximum across 16 configurations
assumptions (5)
- domain assumption DVS saliency maps are a valid proxy for human visual attention in scatterplots.
- domain assumption Saliency-map similarity metrics measure perceptual similarity of samples.
- ad hoc to paper Weighted Max-Min greedy sampling approximates the optimal perception-aware sample.
- domain assumption Humans cannot perceive small perturbations in scatterplots, so approximate visualizations are acceptable.
- ad hoc to paper Quad-tree boxes with low Chamfer distance and low perception-weight variance contain data that can be approximated by uniform random draws.
invented entities (1)
-
perception-augmented database
Cite this review
Pith. "Pith review of Perception-aware Sampling for Scatterplot Visualizations." pith.science (2026). https://pith.science/paper/HDWMFHFM
@misc{pith2026250420369,
  author       = {Pith},
  title        = {Pith review of: Perception-aware Sampling for Scatterplot Visualizations},
  year         = {2026},
  howpublished = {\url{https://pith.science/paper/HDWMFHFM}},
  note         = {Machine review of arXiv:2504.20369}
}
read the original abstract
Visualizing data is often a crucial first step in data analytics workflows, but growing data sizes pose challenges due to computational and visual perception limitations. As a result, data analysts commonly down-sample their data and work with subsets. Deriving representative samples, however, remains a challenge. This paper focuses on scatterplots, a widely-used visualization type, and introduces a novel sampling objective -- perception-awareness -- aiming to improve sample efficacy by targeting humans' perception of a visualization. We make the following contributions: (1) We propose perception-augmented databases and design PAwS: a novel perception-aware sampling method for scatterplots that leverages saliency maps -- a computer vision tool for predicting areas of attention focus in visualizations -- and models perception-awareness via saliency, density, and coverage objectives. (2) We design ApproPAwS: a fast, perception-aware method for approximate visualizations, which exploits the fact that small visual perturbations are often imperceptible to humans. (3) We introduce the concept of perceptual similarity as a metric for sample quality, and present a novel method that compares saliency maps to measure it. (4) Our extensive experimental evaluation shows that our methods consistently outperform prior art in producing samples with high perceptual similarity, while ApproPAwS achieves up to 100x speed-ups with minimal loss in visual fidelity. Our user study shows that PAwS is often preferred by humans, validating our quantitative findings.
Figures


Figures from the paper (19 more)









Reference graph
Works this paper leans on
-
[1]
Mirrokni, and Mayur Thakur
Zeinab Abbassi, Vahab S. Mirrokni, and Mayur Thakur. 2013. Diversity Maxi- mization Under Matroid Constraints. InKDD ’13. 32–40
2013
-
[2]
Swarup Acharya, Phillip B Gibbons, and Viswanath Poosala. 1999. Aqua: A fast decision support systems using approximate query answers. InProceedings of the 25th International Conference on Very Large Data Bases. 754–757
1999
-
[3]
Panos Achlioptas, Olga Diamanti, Ioannis Mitliagkas, and Leonidas Guibas
-
[4]
Raghavendra Addanki, Andrew McGregor, Alexandra Meliou, and Zafeiria Moumoulidou. 2022. Improved Approximation and Scalability for Fair Max- Min Diversification. In25th International Conference on Database Theory (ICDT) (LIPIcs, Vol. 220). Schloss Dagstuhl - Leibniz-Zentrum für Informatik, 7:1–7:21. https://doi.org/10.4230/LIPIcs.ICDT.2022.7
-
[5]
Sameer Agarwal, Barzan Mozafari, Aurojit Panda, Henry Milner, Samuel Mad- den, and Ion Stoica. 2013. BlinkDB: queries with bounded errors and bounded response times on very large data. InProceedings of the 8th ACM European conference on computer systems. 29–42
2013
-
[6]
Daniel Alabi and Eugene Wu. 2016. Pfunk-h: Approximate query processing using perceptual models. InProceedings of the workshop on human-in-the-loop data analytics. 1–6
2016
-
[7]
Robert Amar, James Eagan, and John Stasko. 2005. Low-level components of analytic activity in information visualization. InIEEE Symposium on Information Visualization, 2005. INFOVIS 2005.IEEE, 111–117
2005
-
[8]
Ralph G Andrzejak, Klaus Lehnertz, Florian Mormann, Christoph Rieke, Peter David, and Christian E Elger. 2001. Indications of nonlinear deterministic and finite-dimensional structures in time series of brain electrical activity: Dependence on recording region and brain state.Physical Review E(2001)
2001
Show all 122 references
-
[9]
Hirojiro Aoyama. 1954. A study of stratified random sampling.Ann. Inst. Stat. Math6, 1 (1954), 1–36
1954
-
[10]
Leilani Battle, Remco Chang, and Michael Stonebraker. 2016. Dynamic prefetch- ing of data tiles for interactive visualization. InProceedings of the 2016 Interna- tional Conference on Management of Data. 1363–1375
2016
-
[11]
Leilani Battle, Michael Stonebraker, and Remco Chang. 2013. Dynamic reduction of query result sets for interactive visualizaton. In2013 IEEE International Conference on Big Data. IEEE, 1–8
2013
-
[12]
Jon Louis Bentley. 1975. Multidimensional binary search trees used for associa- tive searching.Commun. ACM18, 9 (1975), 509–517
1975
-
[13]
Enrico Bertini and Giuseppe Santucci. 2004. By chance is not enough: pre- serving relative density through nonuniform sampling. InProceedings. Eighth International Conference on Information Visualisation, 2004. IV 2004.IEEE, 622– 629
2004
-
[14]
Enrico Bertini and Giuseppe Santucci. 2006. Give chance a chance: model- ing density to enhance scatter plot quality through random data sampling. Information Visualization5, 2 (2006), 95–110
2006
-
[15]
Ayan Biswas, Soumya Dutta, Han-Wei Shen, and Jonathan Woodring. 2013. An information-aware framework for exploring multivariate data sets.IEEE Transactions on Visualization and Computer Graphics19, 12 (2013), 2683–2692
2013
-
[16]
Corinna E Bonhage, Jutta L Mueller, Angela D Friederici, and Christian J Fiebach
-
[17]
Allan Borodin, Aadhar Jain, Hyun Chul Lee, and Yuli Ye. 2017. Max-sum diversification, monotone submodular functions, and dynamic updates.ACM Transactions on Algorithms (TALG)13, 3 (2017), 1–25
2017
-
[18]
Zoya Bylinskii, Tilke Judd, Aude Oliva, Antonio Torralba, and Frédo Durand
-
[19]
Zoya Bylinskii, Adrià Recasens, Ali Borji, Aude Oliva, Antonio Torralba, and Frédo Durand. 2016. Where should saliency models look next?. InComputer Vision–ECCV 2016: 14th European Conference, Amsterdam, The Netherlands, October 11-14, 2016, Proceedings, Part V 14. Springer, 809–824
2016
-
[20]
Surajit Chaudhuri, Gautam Das, and Vivek Narasayya. 2007. Optimized strati- fied sampling for approximate query processing.ACM Transactions on Database Systems (TODS)32, 2 (2007), 9–es
2007
-
[21]
What do different evaluation metrics tell us about saliency models?IEEE transactions on pattern analysis and machine intelligence41, 3 (2018), 740–757
2018
-
[22]
Min Chen and Heike Jäenicke. 2010. An information-theoretic framework for visualization.IEEE transactions on visualization and computer graphics16, 6 (2010), 1206–1215
2010
-
[23]
Xin Chen, Tong Ge, Jian Zhang, Baoquan Chen, Chi-Wing Fu, Oliver Deussen, and Yunhai Wang. 2019. A recursive subdivision technique for sampling multi- class scatterplots.IEEE transactions on visualization and computer graphics26, 1 (2019), 729–738
2019
-
[24]
Min Chen and Amos Golan. 2015. What may visualization processes optimize? IEEE transactions on visualization and computer graphics22, 12 (2015), 2619– 2632
2015
-
[25]
Robert L Cook. 1986. Stochastic sampling in computer graphics.ACM Transac- tions on Graphics (TOG)5, 1 (1986), 51–72
1986
-
[26]
Graham Cormode, Minos Garofalakis, Peter J Haas, Chris Jermaine, et al. 2011. Synopses for massive data: Samples, histograms, wavelets, sketches.Foundations and Trends®in Databases4, 1–3 (2011), 1–294
2011
-
[27]
Kathy Conklin and Ana Pellicer-Sánchez. 2016. Using eye-tracking in applied linguistics and second language research.Second Language Research32, 3 (2016), 453–467
2016
-
[28]
Kyriaki Dimitriadou, Olga Papaemmanouil, and Yanlei Diao. 2016. AIDE: an ac- tive learning-based approach for interactive data exploration.IEEE Transactions on Knowledge and Data Engineering28, 11 (2016), 2842–2856
2016
-
[29]
Bolin Ding, Silu Huang, Surajit Chaudhuri, Kaushik Chakrabarti, and Chi Wang
-
[30]
Çağatay Demiralp, Michael S Bernstein, and Jeffrey Heer. 2014. Learning perceptual kernels for visualization design.IEEE transactions on visualization and computer graphics20, 12 (2014), 1933–1942
2014
-
[31]
Marina Drosou, Hosagrahar V Jagadish, Evaggelia Pitoura, and Julia Stoy- anovich. 2017. Diversity in big data: A review.Big data5, 2 (2017), 73–84
2017
-
[32]
Marina Drosou and Evaggelia Pitoura. 2013. Diverse set selection over dynamic data.IEEE Transactions on Knowledge and Data Engineering26, 5 (2013), 1102– 1116
2013
-
[33]
Soumya Dutta, Ayan Biswas, and James Ahrens. 2019. Multivariate pointwise information-driven data sampling and visualization.Entropy21, 7 (2019), 699
2019
-
[34]
Frances Ding, Moritz Hardt, John Miller, and Ludwig Schmidt. 2021. Retiring adult: New datasets for fair machine learning.Advances in neural information processing systems34 (2021), 6478–6490
2021
-
[35]
Yuval Eldar, Michael Lindenbaum, Moshe Porat, and Yehoshua Y Zeevi. 1997. The farthest point strategy for progressive image sampling.IEEE transactions on image processing6, 9 (1997), 1305–1315
1997
-
[36]
Geoffrey Ellis and Alan Dix. 2007. A taxonomy of clutter reduction for infor- mation visualisation.IEEE transactions on visualization and computer graphics 13, 6 (2007), 1216–1223
2007
-
[37]
Haoqiang Fan, Hao Su, and Leonidas J Guibas. 2017. A point set generation network for 3d object reconstruction from a single image. InProceedings of the IEEE conference on computer vision and pattern recognition. 605–613
2017
-
[38]
Muhammad El-Hindi, Zheguang Zhao, Carsten Binnig, and Tim Kraska. 2016. Vistrees: fast indexes for interactive data exploration. InProceedings of the Workshop on Human-In-the-Loop Data Analytics. 1–6
2016
-
[39]
Steven L Franconeri, Lace M Padilla, Priti Shah, Jeffrey M Zacks, and Jessica Hullman. 2021. The science of visual data communication: What works.Psy- chological Science in the public interest22, 3 (2021), 110–161
2021
-
[40]
Shaddy Garg, Subrata Mitra, Tong Yu, Yash Gadhia, and Arjun Kashettiwar
-
[41]
Saheli Ghosh and Ahmed Eldawy. 2020. Aid*: a spatial index for visual explo- ration of geo-spatial data.IEEE Transactions on Knowledge and Data Engineering 34, 8 (2020), 3569–3582
2020
-
[42]
Danyel Fisher, Igor Popov, Steven Drucker, and MC Schraefel. 2012. Trust me, I’m partially right: incremental visualization lets analysts explore large datasets faster. InProceedings of the SIGCHI conference on human factors in computing systems. 1673–1682
2012
-
[43]
Lane Harrison, Fumeng Yang, Steven Franconeri, and Remco Chang. 2014. Ranking visualizations of correlation using weber’s law.IEEE transactions on visualization and computer graphics20, 12 (2014), 1943–1952
2014
-
[44]
Christopher Healey and James Enns. 2011. Attention and visual memory in visualization and computer graphics.IEEE transactions on visualization and computer graphics18, 7 (2011), 1170–1188
2011
-
[45]
Joseph M Hellerstein, Ron Avnur, Andy Chou, Christian Hidber, Chris Olston, Vijayshankar Raman, Tali Roth, and Peter J Haas. 1999. Interactive data analysis: The control project.Computer32, 8 (1999), 51–59
1999
-
[46]
Ralph H Henderson and Thalanayar Sundaresan. 1982. Cluster sampling to as- sess immunization coverage: a review of experience with a simplified sampling method.Bulletin of the World Health Organization60, 2 (1982), 253
1982
-
[47]
Phillip B Gibbons and Yossi Matias. 1998. New sampling-based summary statistics for improving approximate query answers. InProceedings of the 1998 ACM SIGMOD international conference on Management of data. 331–342
1998
-
[48]
Laurent Itti and Christof Koch. 2001. Computational modelling of visual atten- tion.Nature reviews neuroscience2, 3 (2001), 194–203. 13 Zafeiria Moumoulidou, Hamza Elhamdadi, Ke Yang, Subrata Mitra, Cindy Xiong Bearfield, and Alexandra Meliou
2001
-
[49]
Laurent Itti, Christof Koch, and Ernst Niebur. 1998. A model of saliency-based visual attention for rapid scene analysis.IEEE Transactions on pattern analysis and machine intelligence20, 11 (1998), 1254–1259
1998
-
[50]
Paulo Joia, Fabiano Petronetto, and Luis Gustavo Nonato. 2015. Uncovering representative groups in multidimensional projections. InComputer Graphics Forum, Vol. 34. Wiley Online Library, 281–290
2015
-
[51]
Daniel A Keim, Ming C Hao, Umeshwar Dayal, Halldor Janetzko, and Peter Bak
-
[52]
Ruizhen Hu, Tingkai Sha, Oliver Van Kaick, Oliver Deussen, and Hui Huang
-
[53]
Jang-Hyun Kim, Wonho Choo, and Hyun Oh Song. 2020. Puzzle Mix: Exploiting Saliency and Local Statistics for Optimal Mixup. InProceedings of the 37th International Conference on Machine Learning (Proceedings of Machine Learning Research, Vol. 119), Hal Daumé III and Aarti Singh...
2020
-
[54]
Nam Wook Kim, Zoya Bylinskii, Michelle A Borkin, Krzysztof Z Gajos, Aude Oliva, Fredo Durand, and Hanspeter Pfister. 2017. Bubbleview: an interface for crowdsourcing image importance maps and tracking visual attention.ACM Transactions on Computer-Human Interaction (TOCHI)24, 5...
2017
-
[55]
Younghoon Kim and Jeffrey Heer. 2018. Assessing effects of task and data distribution on the effectiveness of visual encodings. InComputer Graphics Forum, Vol. 37. Wiley Online Library, 157–167
2018
-
[56]
Matthäus Kleindessner, Pranjal Awasthi, and Jamie Morgenstern. 2019. Fair k- center clustering for data summarization. InInternational Conference on Machine Learning. PMLR, 3448–3457
2019
-
[57]
Bum Chul Kwon, Janu Verma, Peter J Haas, and Cagatay Demiralp. 2017. Sam- pling for scalable visual analytics.IEEE computer graphics and applications37, 1 (2017), 100–108
2017
-
[58]
Yann LeCun, Léon Bottou, Yoshua Bengio, and Patrick Haffner. 1998. Gradient- based learning applied to document recognition.Proc. IEEE86, 11 (1998), 2278–2324
1998
-
[59]
Albert Kim, Eric Blais, Aditya Parameswaran, Piotr Indyk, Sam Madden, and Ronitt Rubinfeld. 2015. Rapid sampling for visualizations with ordering guar- antees. InProceedings of the vldb endowment international conference on very large data bases, Vol. 8. NIH Public Access, 521
2015
-
[60]
Sanghyeok Lee, Minkyu Jeon, Injae Kim, Yunyang Xiong, and Hyunwoo J Kim. 2022. SageMix: Saliency-Guided Mixup for Point Clouds. InAdvances in Neural Information Processing Systems, S. Koyejo, S. Mohamed, A. Agar- wal, D. Belgrave, K. Cho, and A. Oh (Eds.), Vol. 35. Curran Asso...
2022
-
[61]
Jia Li, Changqun Xia, Yafei Song, Shu Fang, and Xiaowu Chen. 2015. A data- driven metric for comprehensive evaluation of saliency models. InProceedings of the IEEE international conference on computer vision. 190–198
2015
-
[62]
Yiqun Lin, Lichang Chen, Haibin Huang, Chongyang Ma, Xiaoguang Han, and Shuguang Cui. 2022. Task-aware sampling layer for point-wise analysis.IEEE Transactions on Visualization and Computer Graphics(2022)
2022
-
[63]
Shixia Liu, Jiannan Xiao, Junlin Liu, Xiting Wang, Jing Wu, and Jun Zhu. 2017. Visual diagnosis of tree boosting methods.IEEE transactions on visualization and computer graphics24, 1 (2017), 163–173
2017
-
[64]
Zhicheng Liu and Jeffrey Heer. 2014. The effects of interactive latency on exploratory visual analysis.IEEE transactions on visualization and computer graphics20, 12 (2014), 2122–2131
2014
-
[65]
William G Madow and Lillian H Madow. 1944. On the theory of systematic sampling, I.The Annals of Mathematical Statistics15, 1 (1944), 1–24
1944
-
[66]
Christian Ledig, Lucas Theis, Ferenc Huszár, Jose Caballero, Andrew Cunning- ham, Alejandro Acosta, Andrew Aitken, Alykhan Tejani, Johannes Totz, Zehan Wang, et al. 2017. Photo-realistic single image super-resolution using a gen- erative adversarial network. InProceedings of t...
2017
-
[67]
Laura E Matzen, Michael J Haass, Kristin M Divis, Zhiyuan Wang, and Andrew T Wilson. 2017. Data visualization saliency model: A tool for evaluating abstract data visualizations.IEEE transactions on visualization and computer graphics24, 1 (2017), 563–573
2017
-
[68]
Adrian Mayorga and Michael Gleicher. 2013. Splatterplots: Overcoming over- draw in scatter plots.IEEE transactions on visualization and computer graphics 19, 9 (2013), 1526–1538
2013
-
[69]
Luana Micallef, Gregorio Palmas, Antti Oulasvirta, and Tino Weinkauf. 2017. Towards perceptual optimization of the visual design of scatterplots.IEEE transactions on visualization and computer graphics23, 6 (2017), 1588–1599
2017
-
[70]
NG Minos and BG Philip. 2011. Approximate Query Processing: Taming the TeraBytes.processdings of SIGMOD(2011)
2011
-
[71]
Dominik Moritz, Danyel Fisher, Bolin Ding, and Chi Wang. 2017. Trust, but verify: Optimistic visualizations of approximate queries for exploring big data. InProceedings of the 2017 CHI conference on human factors in computing systems. 2904–2915
2017
-
[72]
Zafeiria Moumoulidou, Andrew McGregor, and Alexandra Meliou. 2021. Diverse Data Selection under Fairness Constraints. InICDT 2021. 13:1–13:25
2021
-
[73]
Moeti M Masiane, Anne Driscoll, Wuchun Feng, John Wenskovitch, and Chris North. 2020. Towards insight-driven sampling for big data visualisation.Be- haviour & Information Technology39, 7 (2020), 788–807
2020
-
[74]
Christopher R Palmer and Christos Faloutsos. 2000. Density biased sampling: An improved method for data mining and clustering. InProceedings of the 2000 ACM SIGMOD international conference on Management of data. 82–92
2000
-
[75]
Yongjoo Park, Michael Cafarella, and Barzan Mozafari. 2016. Visualization- aware sampling for very large databases. In2016 IEEE 32nd International Con- ference on Data Engineering (ICDE). IEEE, 755–766
2016
-
[76]
Emanuel Parzen. 1962. On estimation of a probability density function and mode.The annals of mathematical statistics33, 3 (1962), 1065–1076
1962
-
[77]
Fabian Pedregosa, Gaël Varoquaux, Alexandre Gramfort, Vincent Michel, Bertrand Thirion, Olivier Grisel, Mathieu Blondel, Peter Prettenhofer, Ron Weiss, Vincent Dubourg, et al. 2011. Scikit-learn: Machine learning in Python. the Journal of machine Learning research12 (2011), 2825–2830
2011
-
[78]
Ofir Pele and Michael Werman. 2008. A linear time histogram metric for im- proved sift matching. InComputer Vision–ECCV 2008: 10th European Conference on Computer Vision, Marseille, France, October 12-18, 2008, Proceedings, Part III
2008
-
[79]
Ofir Pele and Michael Werman. 2009. Fast and robust earth mover’s distances. In2009 IEEE 12th International Conference on Computer Vision. IEEE, 460–467
2009
-
[80]
Jim Nilsson and Tomas Akenine-Möller. 2020. Understanding ssim.arXiv preprint arXiv:2006.13846(2020)
2020 arXiv
-
[81]
Vibhor Porwal, Subrata Mitra, Fan Du, John Anderson, Nikhil Sheoran, Anup Rao, Tung Mai, Gautam Kowshik, Sapthotharan Nair, Sameeksha Arora, et al
-
[82]
Xin Qian, Ryan A Rossi, Fan Du, Sungchul Kim, Eunyee Koh, Sana Malik, Tak Yeon Lee, and Joel Chan. 2021. Learning to recommend visualizations from data. InProceedings of the 27th ACM SIGKDD Conference on Knowledge Discovery & Data Mining. 1359–1369
2021
-
[83]
Xuedi Qin, Yuyu Luo, Nan Tang, and Guoliang Li. 2020. Making data visual- ization more efficient and effective: a survey.The VLDB Journal29, 1 (2020), 93–117
2020
-
[84]
Ghulam Jilani Quadri, Jennifer Adorno Nieves, Brenton M Wiernik, and Paul Rosen. 2022. Automatic scatterplot design optimization for clustering identifi- cation.IEEE Transactions on Visualization and Computer Graphics(2022)
2022
-
[85]
Ghulam Jilani Quadri and Paul Rosen. 2020. Modeling the influence of visual density on cluster perception in scatterplots using topology.IEEE Transactions on Visualization and Computer Graphics27, 2 (2020), 1829–1839
2020
-
[86]
Ghulam Jilani Quadri and Paul Rosen. 2021. A survey of perception-based visualization studies by task.IEEE transactions on visualization and computer graphics28, 12 (2021), 5026–5048
2021
-
[87]
R Doyle Portugal and Benar Fux Svaiter. 2011. Weber-Fechner law and the optimality of the logarithmic scale.Minds and Machines21 (2011), 73–81
2011
-
[88]
S. S. Ravi, D. J. Rosenkrantz, and G. K. Tayi. 1994. Heuristic and Special Case Algorithms for Dispersion Problems.Oper. Res.42, 2 (April 1994), 299–310
1994
-
[89]
Adria Recasens, Petr Kellnhofer, Simon Stent, Wojciech Matusik, and Antonio Torralba. 2018. Learning to zoom: a saliency-based sampling layer for neural networks. InProceedings of the European conference on computer vision (ECCV). 51–66
2018
-
[90]
Ronald A Rensink and Gideon Baldridge. 2010. The perception of correlation in scatterplots. InComputer graphics forum, Vol. 29. Wiley Online Library, 1203–1210
2010
-
[91]
Julian A Ramos Rojas, Mary Beth Kery, Stephanie Rosenthal, and Anind Dey
-
[92]
Alper Sarikaya and Michael Gleicher. 2017. Scatterplots: Tasks, data, and designs. IEEE transactions on visualization and computer graphics24, 1 (2017), 402–412
2017
-
[93]
2015.Multivariate density estimation: theory, practice, and visualization
David W Scott. 2015.Multivariate density estimation: theory, practice, and visualization. John Wiley & Sons
2015
-
[94]
Karthikeyan Shanmuga Vadivel, Thuyen Ngo, Miguel Eckstein, and BS Manju- nath. 2015. Eye tracking assisted extraction of attentionally important objects from videos. InProceedings of the IEEE Conference on Computer Vision and Pattern Recognition. 3241–3250
2015
-
[95]
Sajjadur Rahman, Maryam Aliakbarpour, Ha Kyung Kong, Eric Blais, Karrie Karahalios, Aditya Parameswaran, and Ronitt Rubinfield. 2017. I’ve seen" enough" incrementally improving visualizations to support rapid decision mak- ing.Proceedings of the VLDB Endowment10, 11 (2017), 1262–1273
2017
-
[96]
Sungbok Shin, Sunghyo Chung, Sanghyun Hong, and Niklas Elmqvist. 2022. A scanner deeply: Predicting gaze heatmaps on visualizations using crowdsourced eye movement data.IEEE Transactions on Visualization and Computer Graphics 29, 1 (2022), 396–406
2022
-
[97]
Ben Shneiderman. 1984. Response time and display rate in human performance with computers.ACM Computing Surveys (CSUR)16, 3 (1984), 265–285. 14 Perception-aware Sampling for Scatterplot Visualizations
1984
-
[98]
2018.Density estimation for statistics and data analysis
Bernard W Silverman. 2018.Density estimation for statistics and data analysis. Routledge
2018
-
[99]
Danielle Albers Szafir. 2017. Modeling color difference for visualization design. IEEE transactions on visualization and computer graphics24, 1 (2017), 392–401
2017
-
[100]
Manasi Vartak, Sajjadur Rahman, Samuel Madden, Aditya Parameswaran, and Neoklis Polyzotis. 2015. Seedb: Efficient data-driven visualization recommen- dations to support visual analytics. InProceedings of the VLDB Endowment International Conference on Very Large Data Bases, Vol...
2015
-
[101]
Yue Wang, Alexandra Meliou, and Gerome Miklau. 2018. Rc-index: Diversifying answers to range queries.Proceedings of the VLDB Endowment11, 7 (2018), 773–786
2018
-
[102]
Zhou Wang, Alan C Bovik, Hamid R Sheikh, and Eero P Simoncelli. 2004. Image quality assessment: from error visibility to structural similarity.IEEE transactions on image processing13, 4 (2004), 600–612
2004
-
[103]
Li-Yi Wei. 2010. Multi-class blue noise sampling.ACM Transactions on Graphics (TOG)29, 4 (2010), 1–8
2010
-
[104]
Ran Shi, Ngi King Ngan, and Hongliang Li. 2017. Gaze-based object segmenta- tion.IEEE Signal Processing Letters24, 10 (2017), 1493–1497
2017
-
[105]
Shouxing Xiang, Xi Ye, Jiazhi Xia, Jing Wu, Yang Chen, and Shixia Liu. 2019. Interactive correction of mislabeled training data. In2019 IEEE Conference on Visual Analytics Science and Technology (V AST). IEEE, 57–68
2019
-
[106]
Dong-Ming Yan, Jian-Wei Guo, Bin Wang, Xiao-Peng Zhang, and Peter Wonka
-
[107]
Jun Yuan, Shouxing Xiang, Jiazhi Xia, Lingyun Yu, and Shixia Liu. 2020. Evalu- ation of sampling methods for scatterplots.IEEE Transactions on Visualization and Computer Graphics27, 2 (2020), 1720–1730
2020
-
[108]
Richard Zhang, Phillip Isola, Alexei A Efros, Eli Shechtman, and Oliver Wang
-
[109]
Hang Zhao, Orazio Gallo, Iuri Frosio, and Jan Kautz. 2016. Loss functions for image restoration with neural networks.IEEE Transactions on computational imaging3, 1 (2016), 47–57
2016
-
[110]
Yan Zheng, Jeffrey Jestes, Jeff M Phillips, and Feifei Li. 2013. Quality and efficiency for kernel density estimates in large data. InProceedings of the 2013 ACM SIGMOD International Conference on Management of Data. 433–444
2013
-
[111]
Kostas Zoumpatianos, Stratos Idreos, and Themis Palpanas. 2014. Indexing for interactive exploration of big data series. InProceedings of the 2014 ACM SIGMOD international conference on Management of data. 1555–1566. A Appendix Overview of experimental design.Figure 18 provide...
2014
-
[113]
Tong Wu, Liang Pan, Junzhe Zhang, Tai Wang, Ziwei Liu, and Dahua Lin. 2021. Density-aware chamfer distance as a comprehensive metric for point cloud completion.arXiv preprint arXiv:2111.12702(2021)
2021 arXiv
-
[116]
A survey of blue-noise sampling and its applications.Journal of Computer Science and Technology30, 3 (2015), 439–452
2015
-
[119]
InProceedings of the IEEE conference on computer vision and pattern recognition
The unreasonable effectiveness of deep features as a perceptual metric. InProceedings of the IEEE conference on computer vision and pattern recognition. 586–595
-
[2010]
Generalized scatter plots.Information Visualization9, 4 (2010), 301–311
2010
-
[2015]
Combined eye tracking and fMRI reveals neural basis of linguistic predic- tions during sentence comprehension.Cortex68 (2015), 33–47
2015
-
[2016]
InProceedings of the 2016 International Conference on Management of Data
Sample+ seek: Approximating aggregates with distribution precision guarantee. InProceedings of the 2016 International Conference on Management of Data. 679–694
2016
-
[2017]
In2017 IEEE 7th symposium on large data analysis and visualization (LDA V)
Sampling techniques to improve big data exploration. In2017 IEEE 7th symposium on large data analysis and visualization (LDA V). IEEE, 26–35
-
[2018]
In International conference on machine learning
Learning representations and generative models for 3d point clouds. In International conference on machine learning. PMLR, 40–49
-
[2019]
Data sampling in multi-view and multi-class scatterplots via set cover optimization.IEEE Transactions on Visualization and Computer Graphics26, 1 (2019), 739–748
2019
-
[2022]
InProceedings of the 2022 International Conference on Management of Data
Efficient Insights Discovery through Conditional Generative Model based Query Approximation. InProceedings of the 2022 International Conference on Management of Data. 2397–2400
2022
-
[2023]
InProceedings of the AAAI Conference on Artificial Intelligence, Vol
Reinforced approximate exploratory data analysis. InProceedings of the AAAI Conference on Artificial Intelligence, Vol. 37. 7660–7669
Reviewed August 16, 2026 · model on record in the stance chip above.
Discussion (0). Continue with ORCID to comment.