REVIEW 4 major objections 5 minor 65 references
Contrasting and comparing the efficacy of non-pharmaceutical interventions on air-borne and vector-borne diseases
T0 review · 4 major / 5 minor · reviewed 2026-08-12 · deepseek-v4-flash
Pith's one-line read The paper claims that mobility-based NPIs that reduce airborne-disease vulnerability can nearly double vector-borne vulnerability, and that an area-ratio-tuned rerouting rule lowers both.
desk verdict A clean model-based trade-off result with a useful synthetic explanation, but the Cali both-beneficial strategy rests on a synthetic uniform redistribution and needs code/data and sensitivity work before it can carry public-health weight. read the letter →
The pith
A machine-rendered reading of the paper's core claim, the machinery that carries it, and where it could break.
The reading
What carries the argument
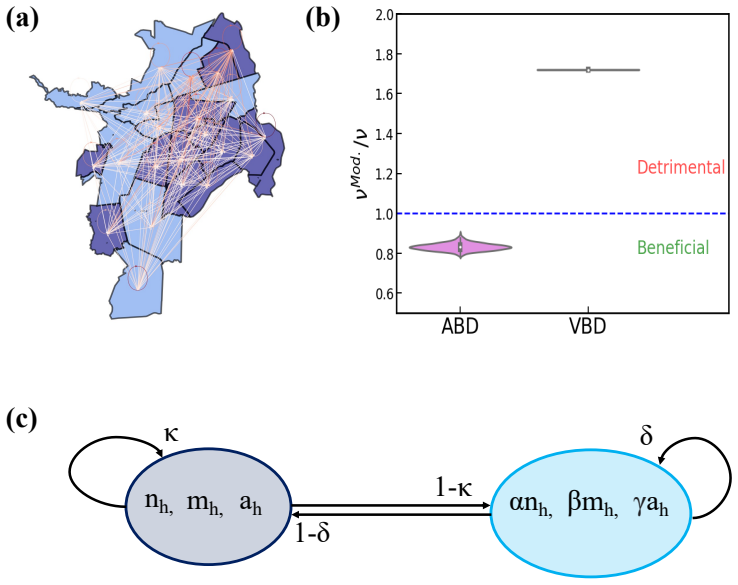
The engine of the analysis is a metapopulation vulnerability framework: each patch has a human population, an area, and a vector population, connected by an origin–destination mobility matrix $R$, and epidemic vulnerability is the inverse of the largest eigenvalue of a critical matrix derived from SIR dynamics (airborne) and Ross–Macdonald dynamics (vector-borne). Hotspots are selected by a density-threshold method (the LouBar method). To make the problem analytically tractable, the city is coarse-grained into one hub and one leaf with scaling parameters $\alpha$, $\beta$, $\gamma$ and mobility fractions $\kappa$, $\delta$; explicit vulnerability formulas from this toy model yield the optimum and are then re-imposed on the full 22-comuna Cali network.
What would settle it
Take the full 22-comuna origin–destination matrix for Cali without hub-leaf aggregation, set $\kappa = 1/(\gamma+1)$ and $\delta = \gamma/(\gamma+1)$ with $\gamma = 1.2$ and Gaussian noise of standard deviation 0.2, and compute the distribution of $\nu_{\mathrm{Mod}}/\nu$ for airborne and vector-borne diseases. If the distribution is not below 1 for both disease classes, the central claim is falsified; so is it if replacing the recipient-index mosquito data with a different entomological survey reverses the sign of the effect.
Extended reading notes
Core claim
The paper's central claim is that epidemic vulnerability—the inverse of the epidemic threshold—responds in opposite directions to the same mobility intervention for airborne and vector-borne diseases, and that the two optima can nonetheless be aligned. Closed-form solutions of a one-hub-one-leaf metapopulation show airborne vulnerability is minimized near $\kappa = 1/(\gamma+1)$ and $\delta = \gamma/(\gamma+1)$, while vector-borne vulnerability is minimized on the line $\delta = 1-\kappa$, which contains the airborne optimum. In Cali, the previously proposed hotspot-to-suburb rerouting reduces airborne vulnerability by about 20% but nearly doubles vector-borne vulnerability; reshaping mobility to the area-ratio-tuned values reduces vulnerability ratios below 1 for both disease types. The main discovery is a single mobility-rescheduling rule that is beneficial for both transmission modes, provided it is scaled by the suburban-to-hotspot area ratio $\gamma$.
Load-bearing premise
The result assumes that all hotspots and all suburbs can be treated as interchangeable, so the optimal mobility fractions from a one-hub-one-leaf model transfer unchanged to every patch in Cali; if real network topology or within-group differences in vector density matter, the both-beneficial outcome may not survive.
Editorial extensions
If this is right
- Strategy II ($\kappa = 1/(\gamma+1)$, $\delta = \gamma/(\gamma+1)$) should reduce both airborne and vector-borne vulnerability in cities whose hotspot–suburb structure resembles Cali's, not only in the synthetic model.
- The hotspot-to-suburb rerouting widely proposed for airborne diseases should be re-examined wherever vector-borne diseases circulate, because the paper's result indicates it can create a vector-borne hotspot at the destination.
- The optimal mobility parameters depend only on the area ratio $\gamma$, so cities can estimate an intervention target from aggregate hotspot and suburban areas without running a full per-patch epidemic simulation.
- Because vulnerability is defined as the inverse epidemic threshold, these policies raise the level of infectiousness needed for an outbreak to establish, which translates to a higher bar for both airborne and vector-borne pathogens.
- Applying Strategy II with Gaussian noise around the target values (standard deviation 0.2) still yields beneficial outcomes, suggesting the policy is robust to imperfect implementation.
Reading between the lines
- Beyond the paper: if the two-patch optimal rule transfers to other cities, the same area-ratio calculation could serve as a first-pass screening tool for combined airborne/vector-borne NPI packages before detailed network simulation.
- Beyond the paper: the model assumes vectors stay in their patches and that mosquito burden is proportional to the recipient index; coupling this with vector-control measures such as larval source reduction could shift the optimal mobility balance, since reducing $\beta$ lowers vector-borne vulnerability independently of mobility.
- Beyond the paper: a testable extension would be to run the same vulnerability-ratio computation on a second city with different hotspot geometry; the universality of $\kappa = 1/(\gamma+1)$, $\delta = \gamma/(\gamma+1)$ would be strengthened if the both-beneficial region persists there.
- Beyond the paper: the trade-off result implies that disease surveillance after a mobility intervention should monitor both pathogen classes, because tracking only airborne disease burden could miss a growing vector-borne risk in the same population.
Editorial analysis
A structured set of objections, weighed in public.
Referee Report
Summary. The paper introduces a metapopulation framework, built on previously published ABD and VBD models, that represents epidemic vulnerability through the largest eigenvalue of disease-specific critical matrices. Using mobility and entomological data for Cali, Colombia, the authors first show that a hotspot-to-suburb mobility rerouting previously proposed for airborne diseases reduces ABD vulnerability by about 20% but nearly doubles VBD vulnerability. They then coarse-grain the city into a one-hub-one-leaf model, derive closed-form vulnerability expressions for both disease types, and identify two reshuffling strategies: Strategy I constrains mobility to δ = 1 − κ, and Strategy II fixes κ = 1/(γ+1) and δ = γ/(γ+1). The paper reports that Strategy II reduces vulnerability for both ABDs and VBDs in synthetic networks and, when applied to Cali, produces vulnerability ratios below 1 for both disease types.
Significance. If the central claims held for the actual Cali mobility network, the paper would provide a useful design principle for coordinating NPIs across diseases with different transmission routes. The analytical eigenvalue derivations in Supplementary S3-S4 are a genuine strength: they are explicit, internally consistent, and give falsifiable conditions for when a mobility reshuffling helps or hurts each disease class. The empirical trade-off result in Section III A, which uses the measured mobility matrix and only reweights destination shares, is a valuable cautionary finding. However, the headline both-beneficial result for Cali is presently demonstrated only on a synthetic uniform redistribution of flows, not on Cali's actual origin-destination structure, and the paper's 'validation' language overstates what a self-consistency check can establish. With a re-analysis on the empirical matrix, the central idea would be publishable; as it stands, the Cali application needs substantial additional work.
major comments (4)
- [Section III F and Supplementary S8] The Cali implementation of Strategy II does not use Cali's empirical origin-destination matrix. Supplementary S8 states that sampled κ and δ values are 'redistributed equally among hotspot patches' and 'distributed equally among suburban patches,' with the inter-group outflow divided uniformly among patches of the other group. Figure 5b therefore evaluates a synthetic uniform hub-leaf network parameterized by Cali's patch sizes, populations, and vector data, not a mobility reshuffling of the measured commuting matrix. The central claim that Strategy II reduces both ABD and VBD vulnerability in Cali is not established by this figure. Please recompute the vulnerability ratios using the empirical R with per-patch retention parameters κ_i and δ_i, or provide a sensitivity analysis over destination-preserving reshufflings. This is load-bearing because the Discussion explicitly invokes the Cali result as validation.
- [Sections III B-III D and Supplementary S8] The transfer of the two-patch optimum to Cali assumes that all hotspot patches are interchangeable with the hub and all suburban patches with the leaf. The derivations of Eqs. (1), (2), S26, and S30 contain no parameters for within-group heterogeneity in population size, area, vector density, or destination preferences. A concrete test would be to apply the group-level (κ, δ) values to the empirical matrix while preserving each patch's actual outgoing destination shares (renormalized to the desired total outflow), and compare the resulting vulnerability ratios with the uniform-redistribution result. Without such a test, the both-beneficial outcome in Fig. 5b could be an artifact of equalizing effective populations across patches.
- [Discussion and Section III F] The paper states that applying the framework to Cali 'validated the model's findings,' but the vulnerability ratios are computed from the same critical-matrix equations (S3, S13) that generated the strategy; no independent epidemiological outcome or out-of-sample prediction is involved. Figure 5 is therefore a self-consistency check rather than an external validation. Please soften this language and explicitly acknowledge that the Cali analysis demonstrates model consistency on real demographic and entomological inputs, unless an independent validation is added.
- [Section III D and Fig. 3] The VBD analysis fixes β = 0.01 by hand, and the optimality claim along δ = 1 − κ is derived in the β << 1 limit (Section III D). No sensitivity analysis is provided for β, and the empirical value of β for Cali is never computed from Table I or the recipient-index data. Since β multiplies the leaf vulnerability term in Eq. (2), the range of β for which Strategy II remains beneficial for both disease types should be reported, together with the measured β for Cali.
minor comments (5)
- [Fig. 5 caption] The caption contains a typo: 'Application of NPI strategies to to Cali, Colombia' should read 'to Cali, Colombia.'
- [Supplementary S3.2] In the first sentence of S3.2, 'the contagion dynamics of ABD can be described as follows' should read 'the contagion dynamics of VBD,' since the equations that follow are the vector-borne model.
- [Section III F] The sentence 'In the synthetic model, this strategy corresponds to setting κ = 0' is inconsistent with the definition of Strategy I in Section III E (δ = 1 − κ), since κ = 0 is only a special case (with δ = 1); please clarify which strategy is actually applied in Fig. 5a.
- [Eq. (2)] Equation (2) in the main text contains literal rendering artifacts ('/radicaltp/radicalvertex/radicalvertex√'), indicating a failed typesetting; the equation should be displayed correctly.
- [Supplementary S8] Gaussian sampling with σ = 0.2 around κ = 1/(γ+1) and δ = γ/(γ+1) can produce values outside [0,1] with small probability; please state whether sampled values are truncated or renormalized.
Circularity Check
No circular derivation: the optimal mobility parameters are mathematical minimizers of independently derived vulnerability formulas, and the Cali application uses empirical mobility and vector inputs without fitting any parameter to the reported vulnerability ratios.
full rationale
The paper's core derivation is self-contained and non-circular. The vulnerability expressions for ABDs and VBDs (Eqs. 1 and 2, with full forms in Supplementary Eqs. S26 and S30) are obtained from the stated SIR and Ross–Macdonald metapopulation assumptions, not from the outcomes being predicted. The mobility parameters κ = 1/(γ+1) and δ = γ/(γ+1) are presented as minimizers of those derived expressions, not fitted to empirical vulnerability data. The synthetic-network tests in Figs. 4 and 5 are internal consistency checks of the same model, but the Cali implementation in Supplementary Section S8 uses independent empirical inputs—the origin–destination mobility matrix, the recipient index for vector distribution, and census areas—and no parameter is calibrated against the vulnerability ratios it reports. The central empirical observation that hotspot-to-suburb rerouting reduces ABD vulnerability by about 20% while nearly doubling VBD vulnerability is computed from the measured Cali matrix rather than imported from the cited prior work. The reduction to a one-hub-one-leaf model is an acknowledged simplification, explicitly flagged in the Discussion as omitting spatial and demographic complexity; that is a limitation on generalizability, not a circular step. Self-citations such as [55] and [45] provide modeling context, but the equations are rederived in the supplement rather than invoked as unverified load-bearing theorems. Therefore, no claimed result reduces by construction to its own inputs or to a fitted parameter renamed as a prediction.
Assumptions & free parameters
free parameters (2)
- β (leaf-to-hub mosquito population ratio) =
0.01
- σ (Gaussian spread in Cali Strategy II implementation) =
0.2
assumptions (6)
- domain assumption Contact frequency in each patch scales with population density, f_l ≈ n_l^eff / a_l, for airborne diseases.
- domain assumption Vectors are confined to their resident patches and interact with all humans present in the patch according to vector density m_l/n_l^eff.
- domain assumption Human movement is recurrent and captured by the probability matrix R with all healthy individuals moving (p=1) and infected individuals moving as much as healthy (α*=1).
- domain assumption The ratio of vectors to humans in each comuna is proportional to the 2015 recipient index.
- ad hoc to paper All hotspot patches are equivalent to a single hub and all suburbs to a single leaf, and the two-patch optimal mobility parameters apply uniformly to the real network.
- domain assumption Hotspot classification by the LouBar density threshold captures the disease-relevant distinction between high- and low-vulnerability areas for both ABD and VBD.
Cite this review
Pith. "Pith review of Contrasting and comparing the efficacy of non-pharmaceutical interventions on air-borne and vector-borne diseases." pith.science (2026). https://pith.science/paper/HFDNRCES
@misc{pith2026241116682,
  author       = {Pith},
  title        = {Pith review of: Contrasting and comparing the efficacy of non-pharmaceutical interventions on air-borne and vector-borne diseases},
  year         = {2026},
  howpublished = {\url{https://pith.science/paper/HFDNRCES}},
  note         = {Machine review of arXiv:2411.16682}
}
read the original abstract
Non-pharmaceutical interventions (NPIs) aimed at limiting human mobility have demonstrated success in curbing the transmission of airborne diseases. However, their effectiveness in managing vector-borne diseases remains less clear. In this study, we introduce a framework that integrates mobility data with vulnerability matrices to evaluate the differential impacts of mobility-based NPIs on both airborne and vector-borne pathogens. Focusing on the city of Santiago de Cali in Colombia, our analysis illustrates how mobility-based policies previously proposed to contain airborne disease can make cities more prone to the spread of vector-borne diseases. By proposing a simplified synthetic model, we explain the limitations of the latter policies and exploit the synergies between both types of diseases to find new interventions reshaping the mobility network for their simultaneous control. Our results thus offer valuable insights into the epidemiological trade-offs of concurrent disease management, providing a foundation for the design and assessment of targeted interventions that reshape human mobility.
Figures


Figures from the paper (2 more)


Reference graph
Works this paper leans on
-
[1]
Strategy-I: Constraining mobility parameters to the range δ = 1− κ Strategy I involves modifying the mobility flows from the leaf such that δ = 1− κ. Based on our earlier analysis, this intervention is anticipated to reduce vulnerability for VBDs; however, its effectiveness for ABDs is less certain. By performing multiple random iterations across syntheti...
-
[2]
NextGenerationEU
Strategy-II: Fixing mobility parameters to κ = 1 γ+1 & δ = γ γ+1 Our analysis of contagion dynamics reveals that vulnerability to ABDs is minimized at specific mobility parameter values: κ = 1 γ+1 and δ = γ γ+1. Notably, these optimal parameters for ABDs fall within the constrained range δ = 1− κ, where vulnerability to VBDs is also minimized. Consequentl...
-
[3]
Human mobility: Models and applications,
Hugo Barbosa, Marc Barthelemy, Gourab Ghoshal, Charlotte R James, Maxime Lenormand, Thomas Louail, Ronaldo Menezes, José J Ramasco, Filippo Simini, and Marcello Tomasini, “Human mobility: Models and applications,” Physics Reports 734, 1–74 (2018)
work page 2018
-
[4]
Infectious disease in an era of global change,
Rachel E Baker, Ayesha S Mahmud, Ian F Miller, Malavika Rajeev, Fidisoa Rasambainarivo, Benjamin L Rice, Saki Takahashi, Andrew J Tatem, Caroline E Wagner, Lin-Fa Wang,et al., “Infectious disease in an era of global change,” Nature Reviews Microbiology 20, 193–205 (2022)
work page 2022
-
[5]
Analysis and control of epidemics: A survey of spreading processes on complex networks,
Cameron Nowzari, Victor M Preciado, and George J Pappas, “Analysis and control of epidemics: A survey of spreading processes on complex networks,” IEEE Control Systems Magazine 36, 26–46 (2016)
work page 2016
-
[6]
Effect of the interconnected network structure on the epidemic threshold,
Huijuan Wang, Qian Li, Gregorio D’Agostino, Shlomo Havlin, H Eugene Stanley, and Piet Van Mieghem, “Effect of the interconnected network structure on the epidemic threshold,” Physical Review E 88, 022801 (2013)
work page 2013
-
[7]
Creighton Connolly, Roger Keil, and S Harris Ali, “Extended urbanisation and the spatialities of infectious disease: Demographic change, infrastructure and governance,” Urban studies 58, 245–263 (2021)
work page 2021
-
[8]
Ayyoob Sharifi and Amir Reza Khavarian-Garmsir, “The covid-19 pandemic: Impacts on cities and major lessons for urban planning, design, and management,” Science of the total environment 749, 142391 (2020)
work page 2020
Show all 65 references
-
[9]
Economic growth, urbanization, globalization, and the risks of emerging infectious diseases 19 in china: A review,
Tong Wu, Charles Perrings, Ann Kinzig, James P Collins, Ben A Minteer, and Peter Daszak, “Economic growth, urbanization, globalization, and the risks of emerging infectious diseases 19 in china: A review,” Ambio 46, 18–29 (2017)
2017
-
[10]
Nested and teleconnected vulner- abilities to environmental change,
W Neil Adger, Hallie Eakin, and Alexandra Winkels, “Nested and teleconnected vulner- abilities to environmental change,” Frontiers in Ecology and the Environment 7, 150–157 (2009)
2009
-
[11]
Human mobility and spatial disease dynamics,
Dirk Brockmann, “Human mobility and spatial disease dynamics,” Reviews of nonlinear dynamics and complexity 2, 1–24 (2009)
2009
-
[12]
World Health Organization et al., Vector-borne diseases, Tech. Rep. (WHO Regional Office for South-East Asia, 2014)
2014
-
[13]
The interconnected and cross-border nature of risks posed by infectious diseases,
Jonathan E Suk, Thomas Van Cangh, Julien Beaute, Cornelius Bartels, Svetla Tsolova, Anasta- sia Pharris, Massimo Ciotti, and Jan C Semenza, “The interconnected and cross-border nature of risks posed by infectious diseases,” Global health action 7, 25287 (2014)
2014
-
[14]
Assessing the interplay between human mobility and mosquito borne diseases in urban environments,
Emanuele Massaro, Daniel Kondor, and Carlo Ratti, “Assessing the interplay between human mobility and mosquito borne diseases in urban environments,” Scientific reports 9, 16911 (2019)
2019
-
[15]
Uncovering the socioeconomic facets of human mobility,
Hugo Barbosa, Surendra Hazarie, Brian Dickinson, Aleix Bassolas, Adam Frank, Henry Kautz, Adam Sadilek, José J Ramasco, and Gourab Ghoshal, “Uncovering the socioeconomic facets of human mobility,” Scientific reports11, 8616 (2021)
2021
-
[16]
Morphology of travel routes and the organization of cities,
Minjin Lee, Hugo Barbosa, Hyejin Youn, Petter Holme, and Gourab Ghoshal, “Morphology of travel routes and the organization of cities,” Nature communications 8, 2229 (2017)
2017
-
[17]
Connecting intercity mobility with urban welfare,
Sayat Mimar, David Soriano-Paños, Alec Kirkley, Hugo Barbosa, Adam Sadilek, Alex Arenas, Jesus Gómez-Gardeñes, and Gourab Ghoshal, “Connecting intercity mobility with urban welfare,” PNAS Nexus 1, pgac178 (2022)
2022
-
[18]
Characterizing network circuity among heterogeneous urban amenities,
Bibandhan Poudyal, Gourab Ghoshal, and Alec Kirkley, “Characterizing network circuity among heterogeneous urban amenities,” Journal of The Royal Society Interface 20, 20230296 (2023)
2023
-
[19]
Effectiveness assessment of non-pharmaceutical interventions: lessons learned from the covid-19 pandemic,
Adrian Lison, Nicolas Banholzer, Mrinank Sharma, Sören Mindermann, H Juliette T Unwin, Swapnil Mishra, Tanja Stadler, Samir Bhatt, Neil M Ferguson, Jan Brauner,et al., “Effectiveness assessment of non-pharmaceutical interventions: lessons learned from the covid-19 pandemic,” T...
2023
-
[20]
Non-pharmaceutical interventions during the covid-19 pandemic: A review,
Nicola Perra, “Non-pharmaceutical interventions during the covid-19 pandemic: A review,” Physics Reports 913, 1–52 (2021). 20
2021
-
[21]
Nonpharmaceutical interventions implemented by us cities during the 1918-1919 influenza pandemic,
Howard Markel, Harvey B Lipman, J Alexander Navarro, Alexandra Sloan, Joseph R Michalsen, Alexandra Minna Stern, and Martin S Cetron, “Nonpharmaceutical interventions implemented by us cities during the 1918-1919 influenza pandemic,” Jama298, 644–654 (2007)
2007
-
[22]
A simple criterion to design optimal non-pharmaceutical interventions for mitigating epidemic outbreaks,
Marco Tulio Angulo, Fernando Castaños, Rodrigo Moreno-Morton, Jorge X Velasco- Hernández, and Jaime A Moreno, “A simple criterion to design optimal non-pharmaceutical interventions for mitigating epidemic outbreaks,” Journal of the Royal Society Interface 18, 20200803 (2021)
2021
-
[23]
Pandemics depress the economy, public health interventions do not: Evidence from the 1918 flu,
Sergio Correia, Stephan Luck, and Emil Verner, “Pandemics depress the economy, public health interventions do not: Evidence from the 1918 flu,” The Journal of Economic History 82, 917–957 (2022)
2022
-
[24]
The unequal effects of the health–economy trade-off during the covid-19 pandemic,
Marco Pangallo, Alberto Aleta, R Maria del Rio-Chanona, Anton Pichler, David Martín-Corral, Matteo Chinazzi, François Lafond, Marco Ajelli, Esteban Moro, Yamir Moreno, et al., “The unequal effects of the health–economy trade-off during the covid-19 pandemic,” Nature Human Beha...
2024
-
[25]
Gdp and employment flash estimates for the second quarter of 2020: Gdp down by 12.1% and employment down by 2.8% in the euro area - products euro indicators - eurostat,
“Gdp and employment flash estimates for the second quarter of 2020: Gdp down by 12.1% and employment down by 2.8% in the euro area - products euro indicators - eurostat,” https:// ec.europa.eu/eurostat/web/products-euro-indicators/-/2-14082020-ap , (Accessed on 05/27/2024)
2020
-
[26]
Annual report on european smes,
Patrice Muller, Cecilia Caliandro, Viktoriya Peycheva, Dimitri Gagliardi, Chiara Marzoc- chi, Ronald Ramlogan, and Deborah Cox, “Annual report on european smes,” European Commission 5, 36–48 (2015)
2015
-
[27]
Gross domestic product, 2nd quarter 2020 (advance estimate) and annual up- date | u.s. bureau of economic analysis (bea),
“Gross domestic product, 2nd quarter 2020 (advance estimate) and annual up- date | u.s. bureau of economic analysis (bea),” https://www.bea.gov/news/2020/ gross-domestic-product-2nd-quarter-2020-advance-estimate-and-annual-update , (Accessed on 05/27/2024)
2020
-
[28]
Quantifying the heterogeneous impact of lockdown policies on different socioe- conomic classes during the first covid-19 wave in colombia,
Pablo Valgañón, Andrés F. Useche, David Soriano-Paños, Gourab Ghoshal, and Jesús Gómez- Gardeñes, “Quantifying the heterogeneous impact of lockdown policies on different socioe- conomic classes during the first covid-19 wave in colombia,” Scientific Reports 13, 16481 (2023)
2023
-
[29]
Impact of covid-19 outbreaks and interventions 21 on influenza in china and the united states,
Luzhao Feng, Ting Zhang, Qing Wang, Yiran Xie, Zhibin Peng, Jiandong Zheng, Ying Qin, Muli Zhang, Shengjie Lai, Dayan Wang,et al., “Impact of covid-19 outbreaks and interventions 21 on influenza in china and the united states,” Nature communications 12, 3249 (2021)
2021
-
[30]
Impact of the covid-19 nonpharmaceutical interventions on influenza and other respiratory viral infections in new zealand,
Q Sue Huang, Tim Wood, Lauren Jelley, Tineke Jennings, Sarah Jefferies, Karen Daniells, Annette Nesdale, Tony Dowell, Nikki Turner, Priscilla Campbell-Stokes,et al., “Impact of the covid-19 nonpharmaceutical interventions on influenza and other respiratory viral infections in ...
2021
-
[31]
Impact of non- pharmaceutical interventions targeted at covid-19 pandemic on influenza burden–a systematic review,
Lara Marleen Fricke, Stephan Glöckner, Maren Dreier, and Berit Lange, “Impact of non- pharmaceutical interventions targeted at covid-19 pandemic on influenza burden–a systematic review,” Journal of Infection 82, 1–35 (2021)
2021
-
[32]
What is the impact of lockdowns on dengue?
Oliver Brady and Annelies Wilder-Smith, “What is the impact of lockdowns on dengue?” Current infectious disease reports 23, 1–8 (2021)
2021
-
[33]
Implications of the covid-19 lockdown on dengue transmission in malaysia,
Song-Quan Ong, Hamdan Ahmad, and Ahmad Mohiddin Mohd Ngesom, “Implications of the covid-19 lockdown on dengue transmission in malaysia,” Infectious disease reports 13, 148–160 (2021)
2021
-
[34]
Pandemic-associated mobility restrictions could cause increases in dengue virus transmission,
Sean M Cavany, Guido España, Gonzalo M Vazquez-Prokopec, Thomas W Scott, and T Alex Perkins, “Pandemic-associated mobility restrictions could cause increases in dengue virus transmission,” PLoS neglected tropical diseases 15, e0009603 (2021)
2021
-
[35]
Measuring the effects of covid-19-related disruption on dengue transmission in southeast asia and latin america: a statistical modelling study,
Yuyang Chen, Naizhe Li, José Lourenço, Lin Wang, Bernard Cazelles, Lu Dong, Bingying Li, Yang Liu, Mark Jit, Nikos I Bosse, et al., “Measuring the effects of covid-19-related disruption on dengue transmission in southeast asia and latin america: a statistical modelling study,”...
2022
-
[36]
Does covid-19 lockdowns have impacted on global dengue burden? a special focus to india,
Hemlata Sharma, Ashal Ilyas, Abhiroop Chowdhury, Nitesh Kumar Poddar, Anis Ahmad Chaudhary, Sireen Abdul Rahim Shilbayeh, Alnada Abdalla Ibrahim, and Shahanavaj Khan, “Does covid-19 lockdowns have impacted on global dengue burden? a special focus to india,” BMC Public Health 2...
2022
-
[37]
Dengue outbreaks in the covid-19 era: Alarm raised for asia,
Xinting Lu, Hilary Bambrick, Puntani Pongsumpun, Pandji Wibawa Dhewantara, Do Thi Thanh Toan, and Wenbiao Hu, “Dengue outbreaks in the covid-19 era: Alarm raised for asia,” PLoS neglected tropical diseases 15, e0009778 (2021)
2021
-
[38]
Reduced dengue incidence during the covid-19 move- ment restrictions in sri lanka from march 2020 to april 2021,
SN Surendran, R Nagulan, K Sivabalakrishnan, S Arthiyan, A Tharsan, TTP Jayadas, S Raveen- dran, T Kumanan, and R Ramasamy, “Reduced dengue incidence during the covid-19 move- ment restrictions in sri lanka from march 2020 to april 2021,” BMC public health 22, 388 (2022). 22
2022
-
[39]
Implication of social restrictions on covid-19 pandemic towards dengue control: Literature review,
Wahyu Widyantoro, Nurjazuli Nurjazuli, and Yusniar Hanani Darundiati, “Implication of social restrictions on covid-19 pandemic towards dengue control: Literature review,” in E3S Web of Conferences, Vol. 317 (EDP Sciences, 2021) p. 01086
2021
-
[40]
Zimbabwe faces malaria outbreak as it locks down to counter coronavirus | global devel- opment | the guardian,
“Zimbabwe faces malaria outbreak as it locks down to counter coronavirus | global devel- opment | the guardian,” https://www.theguardian.com/global-development/2020/apr/ 21/zimbabwe-faces-malaria-outbreak-as-it-locks-down-to-counter-coronavirus , (Accessed on 05/27/2024)
2020
-
[41]
Vector control and surveillance under lockdown: Covid-19 and future pandemics,
Jose del Rosario Loaiza Rodríguez, Gillian Eastwood, and Luis F Chaves Sanabria, “Vector control and surveillance under lockdown: Covid-19 and future pandemics,” in Planetary health approaches to understand and control vector-borne diseases (Wageningen Academic, 2023) pp. 206–225
2023
-
[42]
Priori- tizing mosquito-borne diseases during and after the covid-19 pandemic,
Shahmshad Ahmed Khan, Cameron Ewart Webb, and Nur Faeza Abu Kassim, “Priori- tizing mosquito-borne diseases during and after the covid-19 pandemic,” Western Pacific Surveillance and Response Journal: WPSAR 12, 40 (2021)
2021
-
[43]
Epidemic processes in complex networks,
Romualdo Pastor-Satorras, Claudio Castellano, Piet Van Mieghem, and Alessandro Vespig- nani, “Epidemic processes in complex networks,” Reviews of modern physics 87, 925 (2015)
2015
-
[44]
Modeling communicable diseases, human mobility, and epidemics: A review,
David Soriano-Paños, Wesley Cota, Silvio C Ferreira, Gourab Ghoshal, Alex Arenas, and Jesús Gómez-Gardeñes, “Modeling communicable diseases, human mobility, and epidemics: A review,” Annalen der Physik 534, 2100482 (2022)
2022
-
[45]
Critical regimes driven by recurrent mobility patterns of reaction–diffusion processes in networks,
Jesús Gómez-Gardeñes, David Soriano-Panos, and Alex Arenas, “Critical regimes driven by recurrent mobility patterns of reaction–diffusion processes in networks,” Nature Physics14, 391–395 (2018)
2018
-
[46]
Perspectives on the role of mobility, behavior, and time scales in the spread of diseases,
Carlos Castillo-Chavez, Derdei Bichara, and Benjamin R Morin, “Perspectives on the role of mobility, behavior, and time scales in the spread of diseases,” Proceedings of the National Academy of Sciences 113, 14582–14588 (2016)
2016
-
[47]
Vector-borne epidemics driven by human mobility,
David Soriano-Paños, Juddy Heliana Arias-Castro, Adriana Reyna-Lara, Hector J Martínez, Sandro Meloni, and Jesús Gómez-Gardeñes, “Vector-borne epidemics driven by human mobility,” Physical Review Research2, 013312 (2020)
2020
-
[48]
Impact of urban structure on infectious disease spreading,
Javier Aguilar, Aleix Bassolas, Gourab Ghoshal, Surendra Hazarie, Alec Kirkley, Mattia Mazzoli, Sandro Meloni, Sayat Mimar, Vincenzo Nicosia, JoséJ. Ramasco, and Adam Sadilek, “Impact of urban structure on infectious disease spreading,” Scientific Reports 12, 3816 (2022). 23
2022
-
[49]
Multiscale mobility networks and the spatial spreading of infectious diseases,
Duygu Balcan, Vittoria Colizza, Bruno Gonçalves, Hao Hu, José J Ramasco, and Alessandro Vespignani, “Multiscale mobility networks and the spatial spreading of infectious diseases,” Proceedings of the national academy of sciences 106, 21484–21489 (2009)
2009
-
[50]
Natural human mobility patterns and spatial spread of infectious diseases,
Vitaly Belik, Theo Geisel, and Dirk Brockmann, “Natural human mobility patterns and spatial spread of infectious diseases,” Physical Review X 1, 011001 (2011)
2011
-
[51]
Modeling the spatial spread of infectious diseases: The global epidemic and mobility computational model,
Duygu Balcan, Bruno Gonçalves, Hao Hu, José J Ramasco, Vittoria Colizza, and Alessandro Vespignani, “Modeling the spatial spread of infectious diseases: The global epidemic and mobility computational model,” Journal of computational science 1, 132–145 (2010)
2010
-
[52]
The impact of human mobility networks on the global spread of covid-19,
Marian-Gabriel Hâncean, Mitja Slavinec, and Matjaž Perc, “The impact of human mobility networks on the global spread of covid-19,” Journal of Complex Networks 8, cnaa041 (2020)
2020
-
[53]
Human mobility and time spent at destination: impact on spatial epidemic spreading,
Chiara Poletto, Michele Tizzoni, and Vittoria Colizza, “Human mobility and time spent at destination: impact on spatial epidemic spreading,” Journal of theoretical biology 338, 41–58 (2013)
2013
-
[54]
Temporal dynamics and network analysis,
Benjamin Blonder, Tina W Wey, Anna Dornhaus, Richard James, and Andrew Sih, “Temporal dynamics and network analysis,” Methods in Ecology and Evolution 3, 958–972 (2012)
2012
-
[55]
Temporal network structures controlling disease spreading,
Petter Holme, “Temporal network structures controlling disease spreading,” Physical Review E 94, 022305 (2016)
2016
-
[56]
Spatial-temporal dynamics in nonlocal epidemiological models,
Shigui Ruan, “Spatial-temporal dynamics in nonlocal epidemiological models,” inMathematics for life science and medicine (Springer, 2007) pp. 97–122
2007
-
[57]
Interplay between population density and mobility in determining the spread of epidemics in cities,
Surendra Hazarie, David Soriano-Paños, Alex Arenas, Jesús Gómez-Gardeñes, and Gourab Ghoshal, “Interplay between population density and mobility in determining the spread of epidemics in cities,” Communications Physics 4, 191 (2021)
2021
-
[58]
Spatiotemporal dynamics of epidemics: synchrony in metapopulation models,
Alun L Lloyd and Vincent AA Jansen, “Spatiotemporal dynamics of epidemics: synchrony in metapopulation models,” Mathematical biosciences 188, 1–16 (2004)
2004
-
[59]
Effect of population density on epi- demics,
Ruiqi Li, Peter Richmond, and Bertrand M Roehner, “Effect of population density on epi- demics,” Physica A: Statistical Mechanics and its Applications 510, 713–724 (2018)
2018
-
[60]
Hierarchical organization of urban mobility and its connection with city livability,
Aleix Bassolas, Hugo Barbosa-Filho, Brian Dickinson, Xerxes Dotiwalla, Paul Eastham, Ric- cardo Gallotti, Gourab Ghoshal, Bryant Gipson, Surendra A Hazarie, Henry Kautz, et al., “Hierarchical organization of urban mobility and its connection with city livability,” Nature commu...
2019
-
[61]
Cali en cifras 2013,
Guido Escobar-Morales et al. , “Cali en cifras 2013,” Departamento Administrativo de Planeación. Alcaldia de Santiago de Cali 42, 95 (2013)
2013
-
[62]
Secretaria de salud pública municipal de cali,
“Secretaria de salud pública municipal de cali,” Análisis de Situación Integrada de Salud (Municipio Santiago de Cali) , 132 (2016)
2016
-
[63]
Ross, macdonald, and a theory for the dynamics and control of mosquito-transmitted pathogens,
Smith DL, Battle KE, Hay SI, Barker CM, Scott TW, and McKenzie FE, “Ross, macdonald, and a theory for the dynamics and control of mosquito-transmitted pathogens,” PLoS Pathog 8, e1002588 (2012)
2012
-
[64]
Aedes aegypti survival and dispersal in relation to houses in cairns, queensland, australia,
L. E. Muir and B. H. Kay, “Aedes aegypti survival and dispersal in relation to houses in cairns, queensland, australia,” Journal of the American Mosquito Control Association 14, 297–300 (1998)
1998
-
[65]
Dynamic predictability and activity-location contexts in human mobility,
Bibandhan Poudyal, Diogo Pacheco, Marcos Oliveira, Zexun Chen, Hugo S Barbosa, Ronaldo Menezes, and Gourab Ghoshal, “Dynamic predictability and activity-location contexts in human mobility,” Royal Society Open Science 11, 240115 (2024). 25 Supplementary Information Contrasting...
2024 arXiv
Reviewed August 12, 2026 · model on record in the stance chip above.
Discussion (0). Continue with ORCID to comment.