REVIEW 4 major objections 4 minor 1 cited by
Stellar Dynamics in Open Clusters Increases the Binary Fraction and Mass Ratios: Evidence from Photometric Binaries in 35 Open Clusters
T0 review · 4 major / 4 minor · reviewed 2026-08-06 · deepseek-v4-flash
Pith's one-line read Binary fractions and mass ratios in open clusters rise with dynamical age.
desk verdict A careful, data-rich extension to 35 clusters whose binary-fraction trend looks robust, but whose q-shape correlation with dynamical age is exposed to a distance-dependent completeness confound that needs a real test before the dynamical interpretation is accepted. read the letter →
The pith
A machine-rendered reading of the paper's core claim, the machinery that carries it, and where it could break.
The reading
What carries the argument
The load-bearing tool is BASE-9, a Bayesian code that fits PARSEC isochrones through all 11 photometric bands simultaneously and returns posterior probabilities for each star's membership, primary mass, secondary mass, and binarity. The comparison sample is then defined carefully: main-sequence stars with primary mass 0.7–1.1 solar masses (slightly lowered for the two oldest clusters), binaries with $q > 0.5$, and members within three King-model core radii, with at least 100 such stars per cluster (31 of 35 clusters). Dynamical age is the cluster age in units of the half-mass relaxation time, $t_{\rm rh} = 0.346 N r_{c,3D}^{3/2}/\sqrt{G M_{\rm tot} \ln \Lambda}$, which quantifies how many relaxation timescales the cluster has experienced. The $q$-distribution shapes are diagnosed with the Hartigan Dip test for unimodality and compared with Kolmogorov–Smirnov and Anderson–Darling tests.
What would settle it
Inject synthetic binary populations with a fixed input binary fraction and mass-ratio distribution into the observed color-magnitude diagrams of these clusters across the full distance and age range, then run the same BASE-9 recovery; if the recovered binary fraction and mass-ratio distribution still rise with dynamical age, the trends are real, while if the trends vanish or shrink to the injected population, they are selection effects. A complementary check is a radial-velocity survey of the same clusters, which detects binaries independently of photometric mass ratio.
Extended reading notes
Core claim
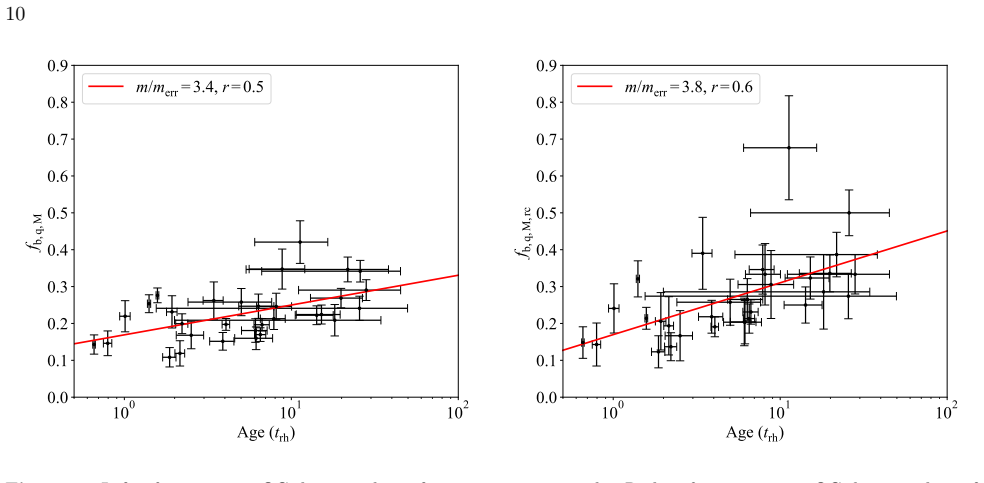
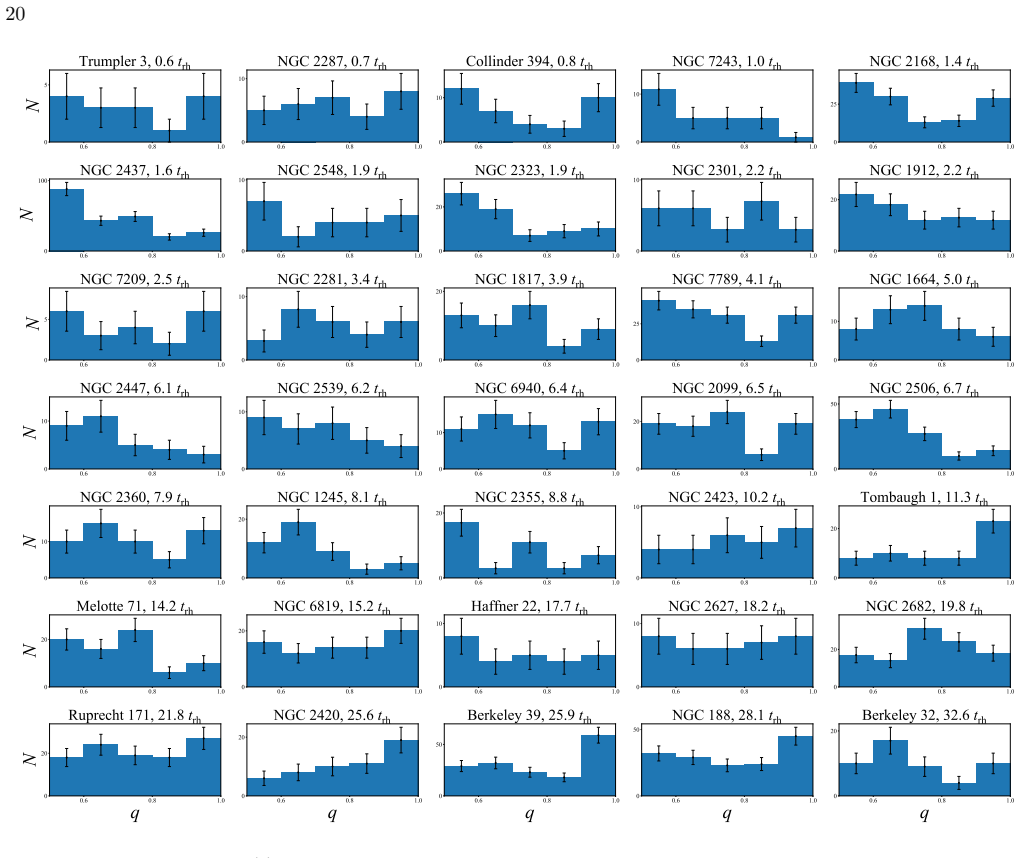
On the authors' own terms, the central discovery is a statistical connection between how dynamically evolved an open cluster is and what its binary population looks like. Across 35 clusters, both the global binary fraction and the core binary fraction correlate with dynamical age (Pearson r = 0.5 and 0.6, respectively), and the median mass ratio of main-sequence binaries also rises with dynamical age (r = 0.5, or 0.6 in the core). The mass-ratio distributions of dynamically young clusters (less than about 2 half-mass relaxation times) and old clusters (greater than about 15) are statistically distinct: young clusters show multi-modal $q$ distributions rising toward $q = 1$ and toward the survey limit $q = 0.5$, while old clusters show a uniform distribution with a peak near $q = 1$ that matches field solar-type binaries. The paper interprets these patterns as evidence that dynamical encounters preferentially disrupt or evaporate low-$q$ binaries and that exchange encounters favor similar-mass companions, pushing binary populations toward higher mass ratios as clusters age.
Load-bearing premise
The analysis assumes that the mass-limited main-sequence sample (primary masses 0.7–1.1 solar masses, mass ratios above 0.5, within three core radii) is equally complete in all 35 clusters; if older or more distant clusters systematically miss faint, low-mass-ratio binaries, the correlations with dynamical age could be selection artifacts rather than dynamical processing.
Editorial extensions
If this is right
- If the trend is real, the binary fraction of an open cluster is not set at birth; it grows over relaxation timescales, most rapidly in the core.
- The mass-ratio distribution of dynamically old clusters matching the field suggests many solar-type field binaries were dynamically processed inside clusters before dispersal.
- Cluster mass matters: lower-mass clusters retain multi-modal $q$ distributions, while higher-mass clusters show unimodal distributions, meaning total mass acts as a proxy for how much dynamical processing has occurred.
- The $q \approx 1$ 'twin' peak seen in old clusters and in the field may be partly built by stellar exchanges rather than being purely primordial.
Reading between the lines
- A sharper test of the dynamical-processing interpretation would compare clusters of similar dynamical age but very different central density: if encounters drive the effect, denser clusters should show more extreme shifts in the mass-ratio distribution.
- The photometric method cannot distinguish a true $q \approx 1$ binary from a triple whose combined light mimics one; if hidden tertiaries are common, part of the twin peak in old clusters could be unidentified triples, a possibility the paper itself notes.
- The same approach applied to globular clusters or to clusters closer than 500 pc could reveal whether the shift toward high $q$ saturates once clusters are dynamically old or continues to strengthen.
- One could test whether the binary-fraction trend with dynamical age is driven by evaporation of low-mass single stars rather than by binary creation; measuring the mass functions of the same clusters should show that low-mass single stars are depleted in dynamically old systems.
Signed reviews
Editorial analysis
A structured set of objections, weighed in public.
Referee Report
Summary. This manuscript uses the BASE-9 Bayesian code on Gaia DR3, Pan-STARRS, and 2MASS photometry for 35 open clusters to identify photometric binaries, derive cluster parameters, and constrain binary mass ratios. After restricting the sample to main-sequence primaries of 0.7-1.1 solar masses, q > 0.5, and r < 3 core radii, the authors report that the binary fraction increases with cluster dynamical age (r = 0.5, and r = 0.6 for the core), that the mass-ratio distributions of dynamically young and old clusters are statistically distinct, and that the median mass ratio increases with dynamical age (r = 0.5, and r = 0.6 for the core). They interpret these trends as evidence that dynamical encounters, mass segregation, and exchange interactions increase both the binary fraction and the mass ratios of binaries in open clusters, and they connect the old-cluster and field q distributions.
Significance. If the reported trends are real, this would be an important observational result for our understanding of binary evolution in open clusters, providing one of the largest photometric samples to constrain how the mass-ratio distribution changes with dynamical age. The authors should be credited for combining 11 photometric bands, validating their BASE-9 parameters against APOGEE metallicities and literature values, comparing their binary fractions with previous work, and making their data publicly available on Zenodo. However, the central q-shape claim is vulnerable to a distance-dependent completeness artifact: Table 1 shows that dynamically old clusters tend to be more distant, while Section 3.2 shows that 2MASS photometry, which is the shallowest band set used, is especially important for recovering low-q binaries. No injection-recovery test or completeness map is presented. The binary-fraction correlation is less susceptible to this particular artifact, but its significance is also not fully established because uncertainties on the binary fractions and dynamical ages are not propagated into the correlation statistics.
major comments (4)
- [Section 3.4, Figures 6 and 8] The Pearson correlations in Figure 6 (r = 0.5, t = 3.4; core r = 0.6, t = 3.8) and Figure 8 (median q versus Age/trh, r = 0.5; core r = 0.6) are computed from point estimates without propagating the asymmetric uncertainties listed in Table 1. Binary fractions carry errors as large as about ±0.08 in some clusters, and the dynamical ages often have uncertainties of tens of percent (for example, NGC 2627 has Age/trh = 18.2 with +16.2/-16.2). Consequently, the reported t-statistics do not measure the statistical significance of these correlations; the authors should provide confidence intervals or p-values obtained by bootstrap or Monte Carlo propagation that incorporates the measurement uncertainties.
- [Section 3.2, Table 1, Figures 7-8] The central mass-ratio result may be a distance-dependent selection artifact. Section 3.2 demonstrates that adding 2MASS photometry improves binary recovery and that the improvement is largest for low-q binaries, yet 2MASS is the shallowest of the three surveys. Table 1 shows a strong confound: clusters with Age/trh > 15 are mostly at 1.5-4 kpc (e.g., NGC 2506 at 3058 pc, Berkeley 32 at 3333 pc, Berkeley 39 at 4042 pc), while clusters with Age/trh < 2 are mostly at 0.6-1.2 kpc. At 3-4 kpc, a 0.7-1.1 solar mass primary with q near 0.5 has a secondary near or below the 2MASS limit, removing exactly the photometric information that most helps BASE-9 identify low-q binaries. The observed shift toward q near 1 in dynamically old clusters is precisely the signature this selection would produce. The manuscript does not include an injection-recovery test or completeness map, so this alternative explanation remains open and must be addressed before the dynamical interpretation can be accepted.
- [Section 3.5, Figure 7] The K-S and Anderson-Darling tests compare seven clusters with Age/trh < 2 to nine clusters with Age/trh > 15, groups that were selected after inspecting the q distributions shown in Figure 12. Because the grouping is post-hoc and uses the same data used to define the hypothesis, the reported p-values (about 9e-12 and 0.001) are not valid significance levels. In addition, individual stars within a cluster are not independent draws, so tests that pool stars across clusters inflate the apparent significance. A cluster-level permutation test, or a pre-specified split with bootstrap resampling over clusters, is needed to support the claim that the q distributions differ with dynamical age.
- [Section 3.3] Several sample-definition choices are data-driven: the lower primary-mass cut of 0.7 solar masses is chosen where the observed fb,q(M1)/fb,q ratio is lowest, the upper cut of 1.1 solar masses is set by the turnoff of most clusters, the q > 0.5 cut follows from the claimed completeness limit, and the N >= 100 and r < 3rc cuts are motivated by the same dataset used for the trend analysis. This does not invalidate the trends by itself, but it means the reported Pearson coefficients should be tested for robustness to reasonable alternative cuts (for example, q > 0.6, M1 = 0.8-1.0 solar masses, or r < 2.5rc). Without such robustness checks, part of the observed correlation could reflect the optimization of the sample cuts rather than the underlying physical relation.
minor comments (4)
- [Section 2.1] The phrase 'low-redenning' should be 'low-reddening'.
- [Section 3.4, Eq. (2)] The text refers to 'Coulombs constant' where the Coulomb logarithm is meant; also, the quantities N, M_Tot, and the three-dimensional core radius r_{c,3D} used in Eq. (2) are not fully defined in the text.
- [Table 1 caption] The caption begins with 'T able' and should read 'Table'.
- [Abstract and Section 4] The phrase 'strong correlation' is used without reporting confidence intervals; adding the intervals from the propagated uncertainties would make the strength of the evidence easier to assess.
Circularity Check
No significant circularity: binary fractions and mass-ratio trends are compared against independently derived dynamical ages and external literature benchmarks.
full rationale
The central correlations (binary fraction and median q versus dynamical age) are not constructed from the fitted values they are meant to predict. Dynamical age is computed from independently fitted King-model core radii, cluster mass, and the standard half-mass relaxation time formula (Eq. 2), none of which is defined in terms of the binary fraction or mass-ratio distribution. The binary fractions and q distributions come from BASE-9 fits to the photometry, but the paper validates the cluster parameters against external data: APOGEE metallicities, Hunt & Reffert (2023) and Dias et al. (2021) distances/ages/reddenings, and literature binary fractions (Figures 2-4). The q distributions of old clusters are compared to the field q distribution from Raghavan et al. (2010), an external benchmark. The reliance on Paper I (Childs et al. 2024) and Cohen et al. (2020) for the BASE-9 methodology is a normal methodological self-citation, not a load-bearing circular step: the present paper's conclusions are not derived from those papers' conclusions, and the method is independently testable against external catalogs. No fitted parameter is renamed as a prediction, and no uniqueness theorem or ansatz is imported from the authors' prior work to force the interpretation. The main caveats (distance-dependent 2MASS completeness, q>0.5 detection limit, small sample size) are selection-effect concerns that could weaken the physical interpretation, but they are not circularity: they do not make the measured correlation equal to an input by construction.
Assumptions & free parameters
free parameters (4)
- Per-cluster minimum membership p-value =
0.002 to 0.448 (Table 1)
- Primary mass window for ML-MS sample =
0.7 to 1.1 solar masses; upper limits 1.0 and 0.98 for Berkeley 39 and NGC 188
- Mass-ratio completeness cut =
q > 0.5
- Radial cut =
r < 3 core radii
assumptions (5)
- domain assumption BASE-9 with PARSEC isochrones and 11-filter photometry correctly classifies single stars and binaries and estimates component masses.
- domain assumption HDBSCAN groups correspond to true cluster members and field contamination is isotropic.
- domain assumption The mass-limited main-sequence sample is completeness-matched across clusters of different distance, reddening, and density.
- domain assumption The half-mass relaxation time formula with Lambda = 0.1N is valid for all 35 clusters.
- domain assumption King (1962) model with chi-square-selected effective radius gives unbiased core and tidal radii.
Cite this review
Pith. "Pith review of Stellar Dynamics in Open Clusters Increases the Binary Fraction and Mass Ratios: Evidence from Photometric Binaries in 35 Open Clusters." pith.science (2026). https://pith.science/paper/HFEFAH3T
@misc{pith2026250620889,
  author       = {Pith},
  title        = {Pith review of: Stellar Dynamics in Open Clusters Increases the Binary Fraction and Mass Ratios: Evidence from Photometric Binaries in 35 Open Clusters},
  year         = {2026},
  howpublished = {\url{https://pith.science/paper/HFEFAH3T}},
  note         = {Machine review of arXiv:2506.20889}
}
read the original abstract
Using the Bayesian Analysis of Stellar Evolution-9 (BASE-9) code and Gaia DR3, Pan-STARRS, and 2MASS data, we identify photometric binaries in 35 open clusters (OCs) and constrain their masses. We find a strong correlation between the binary fraction and cluster dynamical age and an even stronger correlation between core binary fraction and cluster dynamical age. We find the binary mass-ratio (q) distribution of dynamically young OCs is statistically distinct from that of the old OCs. On average, dynamically young OCs display multi-modal q distributions rising toward unity and toward our detection limit of q=0.5 while more dynamically evolved clusters display more uniform q distributions often with a peak near q=1. Interestingly, the uniform q distribution with a peak near q=1 is consistent with binaries in the field. We also observe a similar transition from multi-modal to unimodal q distributions when comparing low mass to high mass OCs in our sample. Lastly, we find a correlation between the median q of the binary population in a cluster and the cluster dynamical age. We interpret these results as an indication that dynamical encounters tend to increase the fraction of high-mass-ratio binaries within a given cluster -- particularly within the cluster's core where stellar dynamics are likely more important. This may be the result of stellar exchanges that tend to produce binaries with larger q and/or the preferential disruption or evaporation of lower q binaries.
Figures


Figures from the paper (9 more)




Forward citations
Cited by 1 Pith paper
-
The Bimodal Mass Ratio Distribution of the Hyades
Mass ratios of Hyades binaries derived from color-magnitude positions are inconsistent with random orbital orientations, and a deconvolved re-analysis yields a bimodal distribution that depends on primary mass.
Reference graph
Works this paper leans on
-
[1]
Albrow, M. D. 2024, MNRAS, 528, 6211, doi: 10.1093/mnras/stae425
-
[2]
Alexander, J. S., & Albrow, M. D. 2025, MNRAS, 536, 471, doi: 10.1093/mnras/stae2636
-
[3]
2024, A&A, 689, A18, doi: 10.1051/0004-6361/202450901 Astropy Collaboration, Robitaille, T
Alfonso, J., Garc ´ ıa-Varela, A., & Vieira, K. 2024, A&A, 689, A18, doi: 10.1051/0004-6361/202450901 Astropy Collaboration, Robitaille, T. P., Tollerud, E. J., et al. 2013, A&A, 558, A33, doi: 10.1051/0004-6361/201322068 Astropy Collaboration, Price-Whelan, A. M., Sip˝ ocz, B. M., et al. 2018, AJ, 156, 123, doi: 10.3847/1538-3881/aabc4f Astropy Collabora...
-
[4]
Bate, M. R. 2000, Monthly Notices of the Royal Astronomical Society, 314, 33
work page 2000
-
[5]
Bate, M. R. 2009, MNRAS, 392, 590, doi: 10.1111/j.1365-2966.2008.14106.x
arXiv 2009
-
[6]
2012, MNRAS, 427, 127, doi: 10.1111/j.1365-2966.2012.21948.x
Bressan, A., Marigo, P., Girardi, L., et al. 2012, MNRAS, 427, 127, doi: 10.1111/j.1365-2966.2012.21948.x
arXiv 2012
-
[7]
Bressert, E., Bastian, N., Gutermuth, R., et al. 2010, Monthly Notices of the Royal Astronomical Society, 409, L54, doi: 10.1111/j.1745-3933.2010.00946.x
arXiv 2010
-
[8]
Caballero-Nieves, S. M., Nelan, E. P., Gies, D. R., et al. 2014, The Astronomical Journal, 147, 40, doi: 10.1088/0004-6256/147/2/40
Show all 67 references
-
[9]
2003, PASP, 115, 763, doi: 10.1086/376392
Chabrier, G. 2003, PASP, 115, 763, doi: 10.1086/376392
2003 doi
- [10]
-
[11]
C., Geller, A
Childs, A. C., Geller, A. M., von Hippel, T., Motherway, E., & Zwicker, C. 2024, ApJ, 962, 41, doi: 10.3847/1538-4357/ad18c0
2024 doi
-
[12]
E., Geller, A
Cohen, R. E., Geller, A. M., & von Hippel, T. 2020, AJ, 159, 11, doi: 10.3847/1538-3881/ab59d7
2020 doi
-
[13]
P., Marino, A
Cordoni, G., Milone, A. P., Marino, A. F., et al. 2023, A&A, 672, A29, doi: 10.1051/0004-6361/202245457
2023 doi
-
[14]
B., & Fahlman, G
Cote, P., Richer, H. B., & Fahlman, G. G. 1991, AJ, 102, 1358, doi: 10.1086/115961 de La Fuente Marcos, R. 1998, PASP, 110, 1117, doi: 10.1086/316220
1991 doi
-
[15]
S., Monteiro, H., Moitinho, A., et al
Dias, W. S., Monteiro, H., Moitinho, A., et al. 2021, MNRAS, 504, 356, doi: 10.1093/mnras/stab770
2021 doi
-
[16]
2023, A&A, 675, A89, doi: 10.1051/0004-6361/202245219 Duchˆ ene, G., & Kraus, A
Donada, J., Anders, F., Jordi, C., et al. 2023, A&A, 675, A89, doi: 10.1051/0004-6361/202245219 Duchˆ ene, G., & Kraus, A. 2013, ARA&A, 51, 269, doi: 10.1146/annurev-astro-081710-102602
2023 doi
-
[17]
M., Jørgensen, J
Evans, Neal J., I., Dunham, M. M., Jørgensen, J. K., et al. 2009, The Astrophysical Journal Supplement Series, 181, 321, doi: 10.1088/0067-0049/181/2/321
2009 doi
-
[18]
M., Ivanova, N., & Rasio, F
Fregeau, J. M., Ivanova, N., & Rasio, F. A. 2009, ApJ, 707, 1533, doi: 10.1088/0004-637X/707/2/1533
2009 doi
-
[19]
M., Joshi, K
Fregeau, J. M., Joshi, K. J., Zwart, S. F. P., & Rasio, F. A. 2002, The Astrophysical Journal, 570, 171
2002
-
[20]
Friel, E. D. 1995, ARA&A, 33, 381, doi: 10.1146/annurev.aa.33.090195.002121
1995
-
[21]
2015, arXiv e-prints, arXiv:1511.04789
Frinchaboy, P., & Thompson, B. 2015, arXiv e-prints, arXiv:1511.04789. https://arxiv.org/abs/1511.04789
2015 arXiv
-
[22]
M., Hurley, J
Geller, A. M., Hurley, J. R., & Mathieu, R. D. 2012, The Astronomical Journal, 145, 8
2012
-
[23]
Giersz, M., & Heggie, D. C. 1994, MNRAS, 268, 257, doi: 10.1093/mnras/268.1.257
1994 doi
-
[24]
B., & Perets, H
Ginat, Y. B., & Perets, H. B. 2024, MNRAS, 531, 739, doi: 10.1093/mnras/stae1241
2024 doi
-
[25]
Goodwin, S. P. 2013, MNRAS, 430, L6, doi: 10.1093/mnrasl/sls037
2013 doi
-
[26]
A., & Hartigan, P
Hartigan, J. A., & Hartigan, P. M. 1985, The Annals of Statistics, 13, 70
1985
-
[27]
Heggie, D. C. 1975, Monthly Notices of the Royal Astronomical Society, 173, 729, doi: 10.1093/mnras/173.3.729
1975 doi
- [28]
-
[29]
2014, A&A, 561, A93, doi: 10.1051/0004-6361/201322559
Heiter, U., Soubiran, C., Netopil, M., & Paunzen, E. 2014, A&A, 561, A93, doi: 10.1051/0004-6361/201322559
2014 doi
-
[30]
L., & Reffert, S
Hunt, E. L., & Reffert, S. 2021, A&A, 646, A104, doi: 10.1051/0004-6361/202039341 —. 2023, A&A, 673, A114, doi: 10.1051/0004-6361/202346285
2021 doi
-
[31]
Hurley, J., & Tout, C. A. 1998, MNRAS, 300, 977, doi: 10.1046/j.1365-8711.1998.01981.x
1998
-
[32]
V., Roy, K., Joshi, N., & Subramaniam, A
Jadhav, V. V., Roy, K., Joshi, N., & Subramaniam, A. 2021, AJ, 162, 264, doi: 10.3847/1538-3881/ac2571
2021 doi
- [33]
-
[34]
Ji, J., & Bregman, J. N. 2015, ApJ, 807, 32, doi: 10.1088/0004-637X/807/1/32
2015 doi
-
[35]
2024, ApJ, 971, 71, doi: 10.3847/1538-4357/ad5344
Jiang, Y., Zhong, J., Qin, S., et al. 2024, ApJ, 971, 71, doi: 10.3847/1538-4357/ad5344
2024 doi
- [36]
-
[37]
J., & Lada, E
Lada, C. J., & Lada, E. A. 2003, Annual Review of Astronomy and Astrophysics, 41, 57, doi: 10.1146/annurev.astro.41.011802.094844
2003 arXiv
-
[38]
C., Ritter, L
Layden, A. C., Ritter, L. A., Welch, D. L., & Webb, T. M. A. 1999, The Astronomical Journal, 117, 1313
1999
-
[39]
D., Vanderburg, A., Gosnell, N
Leiner, E., Mathieu, R. D., Vanderburg, A., Gosnell, N. M., & Smith, J. C. 2019, ApJ, 881, 47, doi: 10.3847/1538-4357/ab2bf8 17 0 2 GBP GRP 6 8 10 12 14 16 18 20 G Trumpler 3 0 2 GBP GRP Collinder 394 0 2 GBP GRP NGC 2301 0 2 GBP GRP NGC 2323 0 2 GBP GRP NGC 2287 0 2 GBP GRP N...
2023 doi
-
[40]
2020, ApJ, 901, 49, doi: 10.3847/1538-4357/abaef3
Li, L., Shao, Z., Li, Z.-Z., et al. 2020, ApJ, 901, 49, doi: 10.3847/1538-4357/abaef3
2020 doi
-
[41]
2021, A&A, 649, A4, doi: 10.1051/0004-6361/202039653
Lindegren, L., Bastian, U., Biermann, M., et al. 2021, A&A, 649, A4, doi: 10.1051/0004-6361/202039653
2021 doi
-
[42]
2025a, AJ, 169, 116, doi: 10.3847/1538-3881/ada380 —
Liu, R., Shao, Z., & Li, L. 2025a, AJ, 169, 116, doi: 10.3847/1538-3881/ada380 —. 2025b, AJ, 169, 116, doi: 10.3847/1538-3881/ada380
-
[43]
R., Schiavon, R
Majewski, S. R., Schiavon, R. P., Frinchaboy, P. M., et al. 2017, AJ, 154, 94, doi: 10.3847/1538-3881/aa784d
2017 doi
-
[44]
Seleznev, A. F. 2023, AJ, 165, 45, doi: 10.3847/1538-3881/aca666
2023 doi
-
[45]
A., Seleznev, A
Malofeeva, A. A., Seleznev, A. F., & Carraro, G. 2022, AJ, 163, 113, doi: 10.3847/1538-3881/ac47a3
2022 doi
-
[46]
1970, ApJ, 160, 135, doi: 10.1086/150412
Mansbach, P. 1970, ApJ, 160, 135, doi: 10.1086/150412
1970 doi
-
[47]
2011, Monthly Notices of the Royal Astronomical Society, 417, 1684, doi: 10.1111/j.1365-2966.2011.19257.x
Marks, M., Kroupa, P., & Oh, S. 2011, Monthly Notices of the Royal Astronomical Society, 417, 1684, doi: 10.1111/j.1365-2966.2011.19257.x
2011
-
[48]
2013, A&A, 560, A16, doi: 10.1051/0004-6361/201322480
Martins, F., & Palacios, A. 2013, A&A, 560, A16, doi: 10.1051/0004-6361/201322480
2013 doi
-
[49]
D., & Geller, A
Mathieu, R. D., & Geller, A. M. 2009, Nature, 462, 1032
2009
-
[50]
2017, Journal of Open Source Software, 2, 205, doi: 10.21105/joss.00205
McInnes, L., Healy, J., & Astels, S. 2017, Journal of Open Source Software, 2, 205, doi: 10.21105/joss.00205
2017 doi
-
[51]
O., & Seleznev, A
Mikhnevich, V. O., & Seleznev, A. F. 2024, Astronomy Reports, 68, 121, doi: 10.1134/S1063772924700161
2024 doi
-
[52]
P., Piotto, G., Bedin, L
Milone, A. P., Piotto, G., Bedin, L. R., et al. 2012, A&A, 540, A16, doi: 10.1051/0004-6361/201016384
2012 doi
-
[53]
P., Cordoni, G., et al
Mohandasan, A., Milone, A. P., Cordoni, G., et al. 2024, A&A, 681, A42, doi: 10.1051/0004-6361/202347424
2024 doi
-
[54]
M., Childs, A
Motherway, E., Geller, A. M., Childs, A. C., Zwicker, C., & von Hippel, T. 2024, ApJL, 962, L9, doi: 10.3847/2041-8213/ad18bf
2024 doi
- [55]
-
[56]
2023, AJ, 166, 110, doi: 10.3847/1538-3881/ace76c
Pang, X., Wang, Y., Tang, S.-Y., et al. 2023, AJ, 166, 110, doi: 10.3847/1538-3881/ace76c
2023 doi
-
[57]
2023, ApJS, 265, 12, doi: 10.3847/1538-4365/acadd6
Qin, S., Zhong, J., Tang, T., & Chen, L. 2023, ApJS, 265, 12, doi: 10.3847/1538-4365/acadd6
2023 doi
-
[58]
A., Henry, T
Raghavan, D., McAlister, H. A., Henry, T. J., et al. 2010, ApJS, 190, 1, doi: 10.1088/0067-0049/190/1/1
2010 doi
-
[59]
2016, BASE-9: Bayesian Analysis for Stellar Evolution with nine variables, Astrophysics Source Code Library, record ascl:1608.007
Robinson, E., von Hippel, T., Stein, N., et al. 2016, BASE-9: Bayesian Analysis for Stellar Evolution with nine variables, Astrophysics Source Code Library, record ascl:1608.007. http://ascl.net/1608.007
2016
-
[60]
E., de Koter, A., et al
Sana, H., de Mink, S. E., de Koter, A., et al. 2012, Science, 337, 444, doi: 10.1126/science.1223344
2012 doi
-
[61]
F., Cutri, R
Skrutskie, M. F., Cutri, R. M., Stiening, R., et al. 2006, AJ, 131, 1163, doi: 10.1086/498708
2006 doi
-
[62]
2007, MNRAS, 380, 781, doi: 10.1111/j.1365-2966.2007.12116.x
Sarajedini, A. 2007, MNRAS, 380, 781, doi: 10.1111/j.1365-2966.2007.12116.x
2007
-
[63]
Spangler, S. R. 2025, Research Notes of the American Astronomical Society, 9, 34, doi: 10.3847/2515-5172/adb48a
2025 doi
-
[64]
2022, A&A, 659, A59, doi: 10.1051/0004-6361/202142186
Tarricq, Y., Soubiran, C., Casamiquela, L., et al. 2022, A&A, 659, A59, doi: 10.1051/0004-6361/202142186
2022 doi
-
[65]
2014, AJ, 147, 87, doi: 10.1088/0004-6256/147/4/87 van Dyk, D
Tokovinin, A. 2014, AJ, 147, 87, doi: 10.1088/0004-6256/147/4/87 van Dyk, D. A., Degennaro, S., Stein, N., Jefferys, W. H., & von Hippel, T. 2009, Annals of Applied Statistics, 3, 117, doi: 10.1214/08-AOAS219SUPP von Hippel, T., Jefferys, W. H., Scott, J., et al. 2006, ApJ, 64...
2014 doi
-
[66]
G., Henry, T
Winters, J. G., Henry, T. J., Jao, W.-C., et al. 2019, AJ, 157, 216, doi: 10.3847/1538-3881/ab05dc
2019 doi
-
[67]
M., Childs, A
Zwicker, C., Geller, A. M., Childs, A. C., Motherway, E., & von Hippel, T. 2024, ApJ, 967, 44, doi: 10.3847/1538-4357/ad39c6
2024 doi
Reviewed August 6, 2026 · model on record in the stance chip above.
Discussion (0). Continue with ORCID to comment.