REVIEW 4 major objections 5 minor 33 references
Vehicle Rebalancing Under Adherence Uncertainty
T0 review · 4 major / 5 minor · reviewed 2026-08-11 · deepseek-v4-flash
Pith's one-line read Rebalancing taxis with driver trust in mind lifts served rides by about 27 percent
desk verdict A genuinely new dynamic-adherence model for vehicle rebalancing, but the headline gains rest on a simulator that shares the model's own behavioral assumption, so the evidence is not yet as strong as the paper claims. read the letter →
The pith
A machine-rendered reading of the paper's core claim, the machinery that carries it, and where it could break.
The reading
What carries the argument
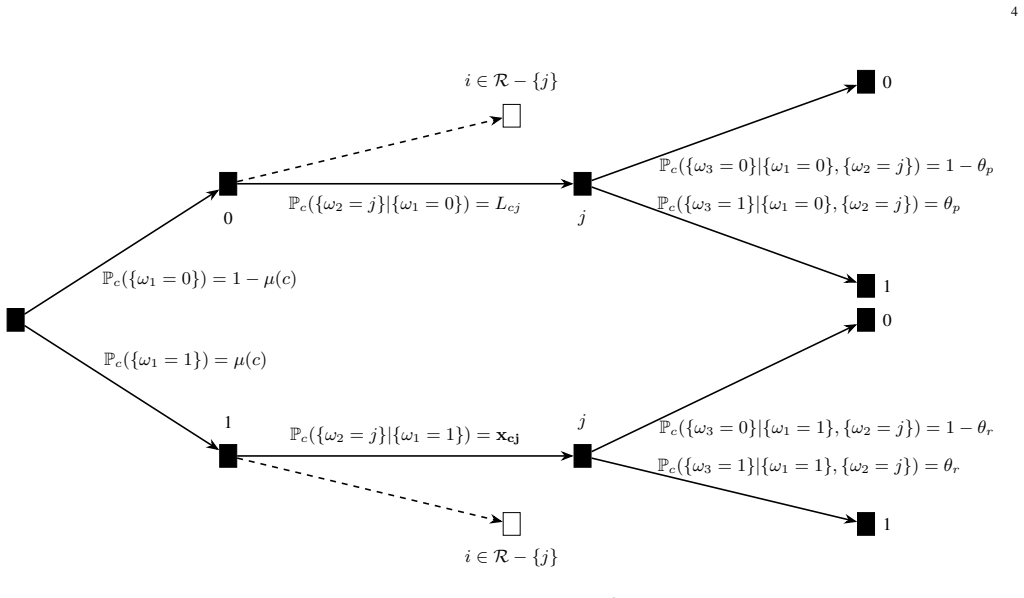
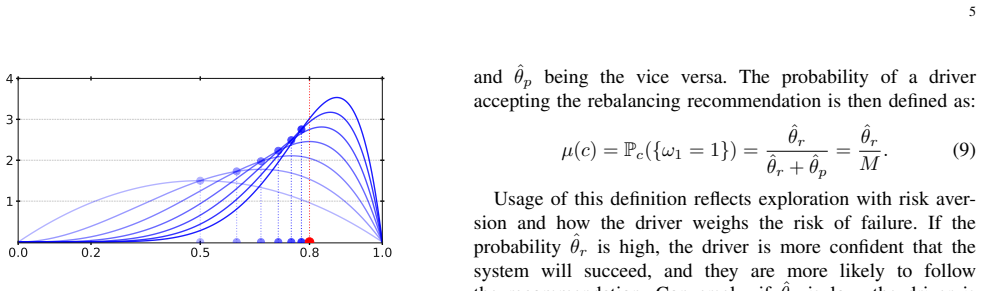
The load-bearing object is the driver adherence probability $\mu(c)$, computed by drawing Thompson samples from Beta posteriors over the success rate of system recommendations versus the driver's own preferred choices and taking the proportion of samples favoring the system. This probability is updated via the Beta-Bernoulli conjugate rule after each recommendation outcome, and it enters the expected-supply identity $E[s_j] = \sum_c \mu(c) x_{cj} + (1-\mu(c)) L_{cj}$, which links individual behavioral uncertainty to the fleet-level optimization.
What would settle it
Run the same 3000-driver Manhattan scenario with driver acceptance generated by a calibrated non-Thompson behavioral model, such as a logistic function of recent recommendation outcomes or a fixed threshold on observed accuracy, and compare AAVR to baseline B1; if the served-demand advantage shrinks substantially or reverses, the paper's central claim is conditional on its own belief-update assumption.
Extended reading notes
Core claim
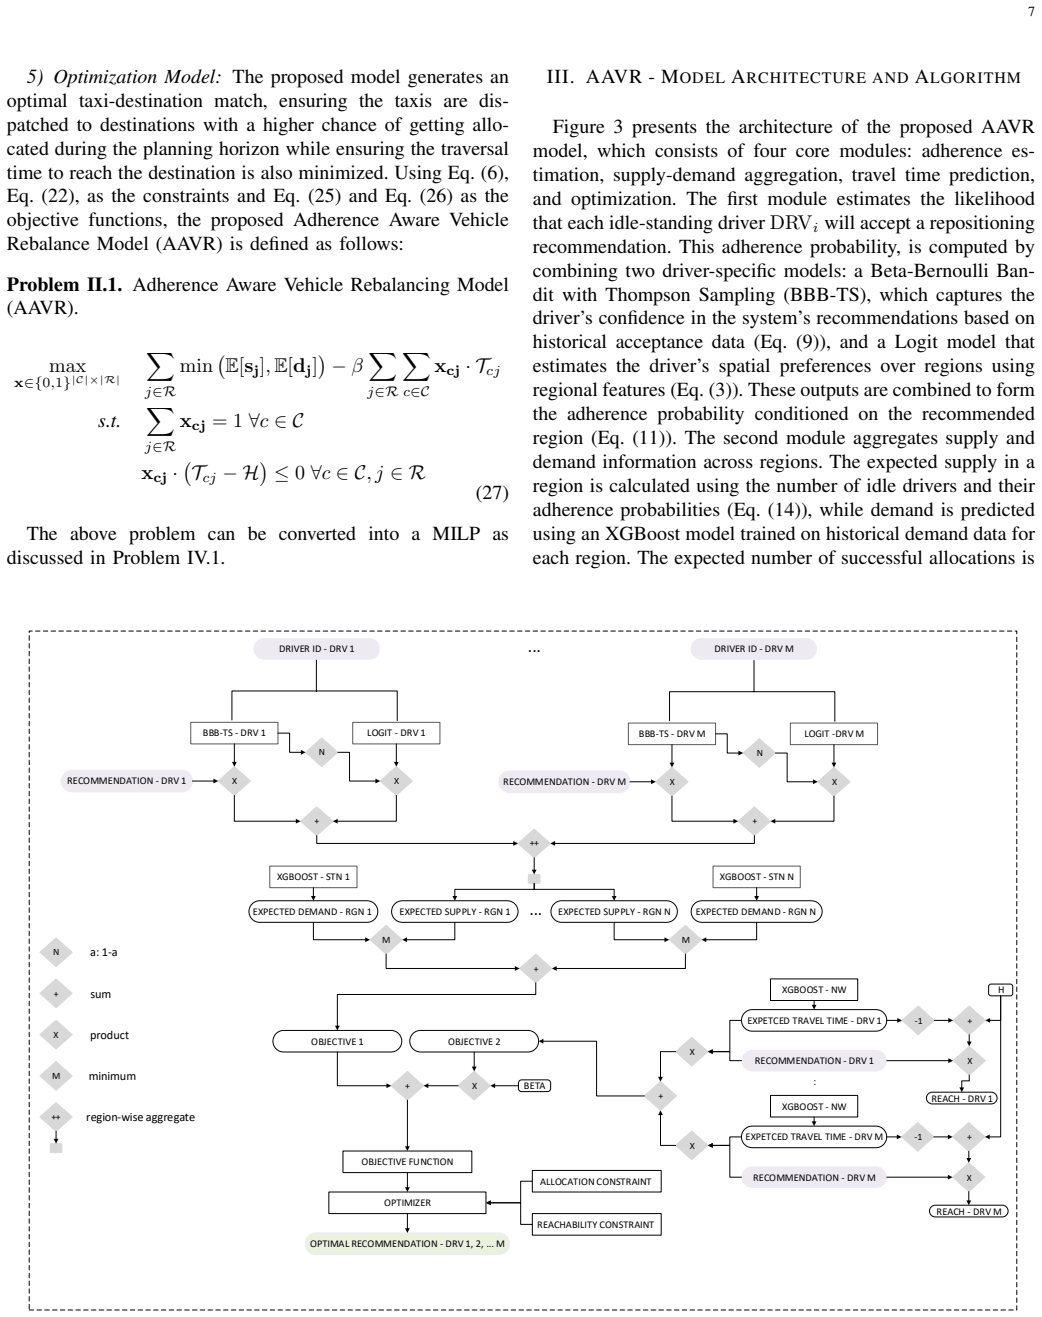
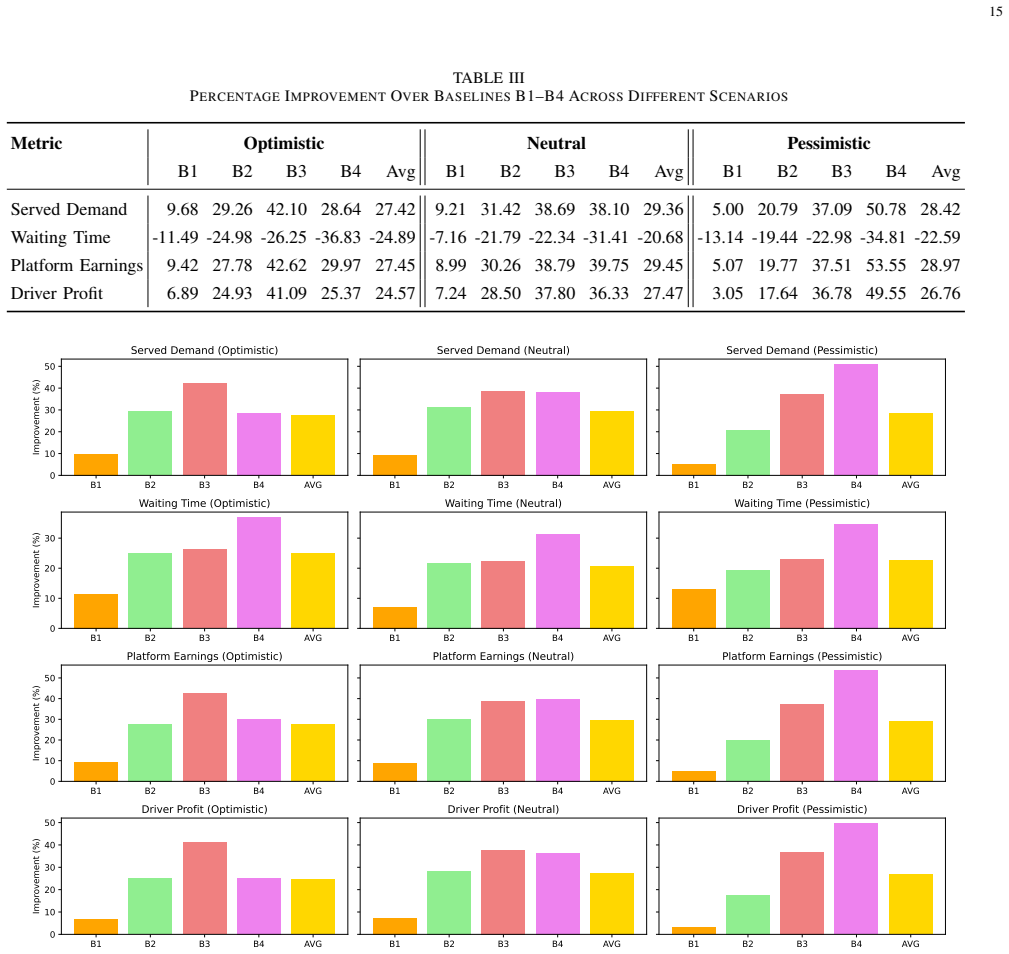
The central claim is that adherence uncertainty, not just demand uncertainty, should be a first-class input to fleet rebalancing. The model represents each driver by an acceptance probability $\mu(c)$ and a region-choice preference $L_{cj}$, so the expected supply in region $j$ becomes $E[s_j] = \sum_c \mu(c) x_{cj} + (1-\mu(c)) L_{cj}$, where $x_{cj}$ is the binary recommendation decision. The optimization maximizes total expected allocations $\sum_{j\in R} \min(E[s_j], \nu_j)$ minus a penalty on idle cruising time $\beta \sum_{c,j} x_{cj} T_{cj}$, and this is linearized into a mixed-integer program so it can be solved repeatedly every few minutes at city scale. In a simulated Manhattan network with 3000 drivers, the proposed model outperforms all four adherence-agnostic baselines across optimistic, neutral, and pessimistic demand scenarios, with average served-demand improvements of roughly 27 to 29 percent, wait-time reductions of roughly 21 to 25 percent, and consistent gains in platform earnings and driver profit.
Load-bearing premise
The network simulation generates each driver's acceptance using exactly the same Beta-Bernoulli Thompson Sampling update that AAVR uses to estimate confidence (Section IV-D), so for the reported gains to transfer to practice, real drivers must update their trust in the system the same way.
Editorial extensions
If this is right
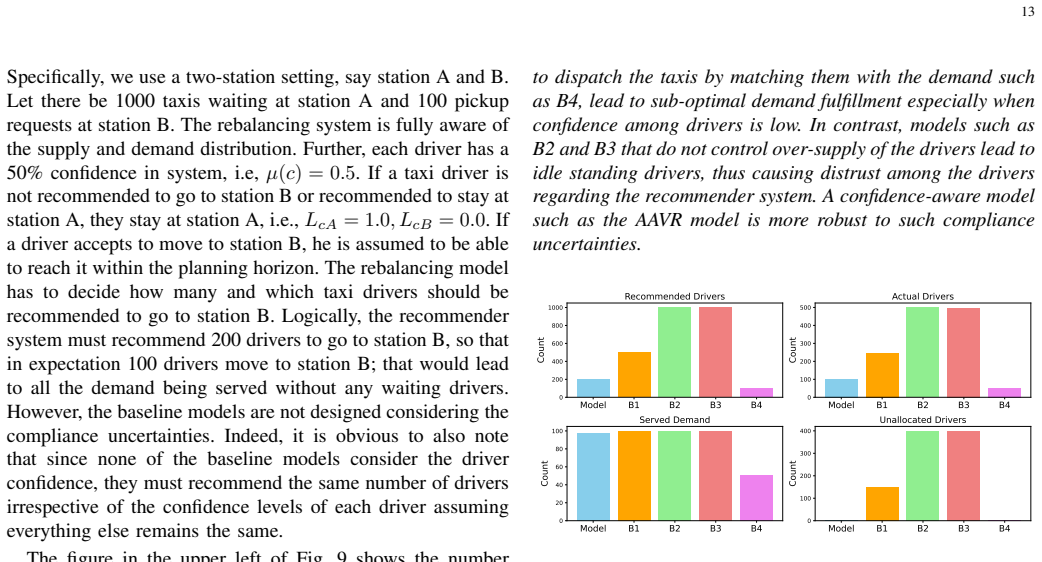
- Rebalancing systems that ignore adherence systematically mis-dispatch: they either send too few drivers to a high-demand zone or send too many, leaving drivers idle and eroding future trust.
- Because successful recommendations raise a driver's confidence, adherence-aware rebalancing should compound over time: better recommendations lead to higher acceptance, which makes future recommendations more effective.
- The linearized MILP formulation makes real-time rebalancing feasible at city scale with thousands of drivers and dozens of regions.
- Driver preference information can reduce unnecessary recommendations: if drivers already move toward high-demand zones on their own, the platform can save its recommendations for cases where they change behavior.
- Selecting high-confidence drivers is efficient in one time step, but the longer simulations indicate the model also accelerates confidence growth across the fleet, improving both platform and driver outcomes.
Reading between the lines
- Editorial inference: the optimization uses expected supply only, so it ignores variance in how many drivers actually arrive at a region; a risk-averse variant that penalizes low-supply tail scenarios might recommend differently in thin-demand regions.
- Editorial inference: the same adherence-learning loop could transfer to other recommender-driven workforces, such as delivery couriers, truck dispatchers, or bike-share rebalancers, wherever a human agent may ignore system suggestions and update trust from outcomes.
- Editorial inference: the confidence feedback suggests a platform could strategically choose which drivers to recommend in order to build long-run trust, but the paper does not solve that multi-period optimal control problem; case study 3 only hints at the selection bias.
- Editorial inference: a direct field test would randomize two comparable fleets, one using AAVR and one using the strongest baseline B1, and compare served demand and acceptance rates over weeks; the simulator already implies such an experiment is feasible.
Editorial analysis
A structured set of objections, weighed in public.
Referee Report
Summary. The paper proposes an Adherence-Aware Vehicle Rebalancing (AAVR) framework for ride-hailing fleets in which drivers may accept or reject repositioning recommendations with probabilities that evolve over time. Driver behavior is modeled with a logit preference model and a Beta-Bernoulli Thompson Sampling confidence model, and the rebalancing problem is formulated as a mixed-integer linear program that maximizes expected allocations minus a weighted travel-time penalty. The authors evaluate the framework on a simulated Manhattan taxi network built from the NYC taxi dataset, comparing it with four adherence-agnostic baselines, and report large improvements in served demand, waiting time, platform earnings, and driver profit. They also present three small two-station case studies to illustrate the mechanism behind the improvements.
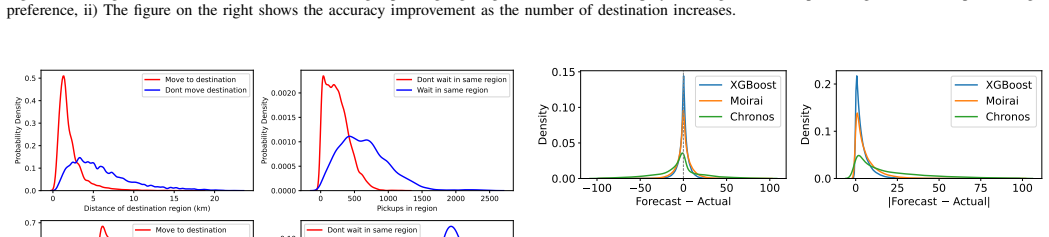
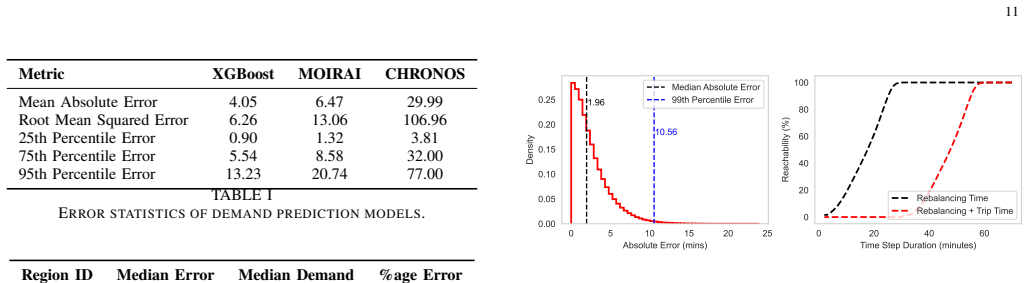
Significance. If the reported gains are robust, the paper makes a useful contribution by explicitly coupling dynamic driver adherence to fleet rebalancing and by providing a tractable MILP formulation. The linearization of the min objective in Problem IV.1 is mathematically valid under the stated min-of-expectations approximation, and the demand and travel-time forecasting comparisons in Table I and Fig. 8 are concrete and informative. The two-station examples usefully isolate the qualitative value of modeling confidence and preference. However, the central numerical claim rests on a simulator whose driver adherence dynamics are generated by the same Beta-Bernoulli Thompson Sampling model that AAVR assumes, and the reported improvements are presented without uncertainty quantification. The empirical claim is therefore conditional on an unvalidated behavioral assumption and needs substantial additional evidence before the performance gains can be regarded as established.
major comments (4)
- [Section IV-D and Section II-B, Eqs. (8)-(9), Algorithm 1] The network simulator generates driver acceptance using the same Beta-Bernoulli Thompson Sampling mechanism that AAVR uses to compute mu(c). Section IV-D states that 'the confidence evolves after each recommendation using the Beta-Bernoulli Thompson Sampling based dynamical system as explained in the Driver Confidence section II-B.' This makes the comparison against adherence-agnostic baselines partly self-referential: any policy that correctly uses mu(c) will dominate baselines that ignore it in a world where mu(c) is exactly the generative rule, regardless of whether real drivers follow this update. The cited lab studies [20]-[23] support Thompson Sampling as a model of human exploration, but they do not establish that taxi drivers in the NYC dataset update confidence exactly as in Eq. (8). I would need to see experiments with alternative driver behavior models -- for example, fixed acceptance probabilities, recency-weighted heuristics, epsilon-greedy policies, or empirically calibrated logit acceptance models -- and a report of whether AAVR's relative gains persist under those models.
- [Section IV-D and Table III] The central numerical claims are point estimates without error bars, confidence intervals, or a statement of the number of independent simulation runs. The simulator is stochastic in driver acceptance, demand, travel time, and matching, so the 27-29% served-demand improvements and the waiting-time reductions in Table III need uncertainty quantification. Without this, the reader cannot assess whether the differences between AAVR and the baselines, especially the smaller differences against B1, are statistically meaningful.
- [Section II-C4, Eqs. (23)-(25), and Problem IV.1] The objective replaces E[min(s_j, d_j)] with min(E[s_j], E[d_j]). This is an upper bound, not an equality, and the approximation error is not quantified. Since the optimization maximizes this approximate allocation objective, the model may systematically overestimate expected served demand and bias recommendations relative to the actual simulator protocol, which uses explicit allocations after the rebalancing step. Please provide a bound on the approximation error, or validate the min-of-expectations approximation against exact computation on small instances, or use a tighter approximation that accounts for the variance of s_j.
- [Eq. (7)-(8) and Algorithm 1, lines 24-29] The confidence update conflates rejection with failure. The outcome y_c(k) is defined as 1 if the driver is allocated 'following kth recommendation' and 0 otherwise, and Algorithm 1 updates alpha_r(c) or beta_r(c) for every driver based on y_c. If a driver rejects the recommendation, then y_c=0 and the update lowers the driver's confidence in the system even though the recommendation was never followed. This is a strong behavioral assumption that is not stated or justified. If, instead, rejected recommendations should not count as failures, the update rule needs to be restricted to accepted recommendations; the current pseudocode does not do that.
minor comments (5)
- [Abstract vs. Section IV-D] The improvement percentages in the abstract (26.72%, 26.45%, 25.90%, 28.75%, 30.06%) differ from the averages reported in Section IV-D (27.42%, 29.36%, 28.42%, etc.). Please reconcile the two sets of numbers and state which correspond to which scenarios.
- [Section II-B, Eq. (8)] The left-hand side of Eq. (8) uses Theta_r(c) while the preceding sentence says the update is for Theta_p(c); the notation should be made consistent.
- [Section II-B, Eq. (9)] The Thompson Sampling acceptance probability assumes that hat_theta_r + hat_theta_p = M, but ties between samples drawn from Theta_r(c) and Theta_p(c) are not handled. Please define the tie rule or specify that ties are assigned randomly.
- [Problem IV.4 (Baseline B3)] In the first constraint, the incoming-flow and outgoing-flow terms are rendered with the same summation symbol, making the constraint ambiguous. Please clarify which index is summed for the incoming term.
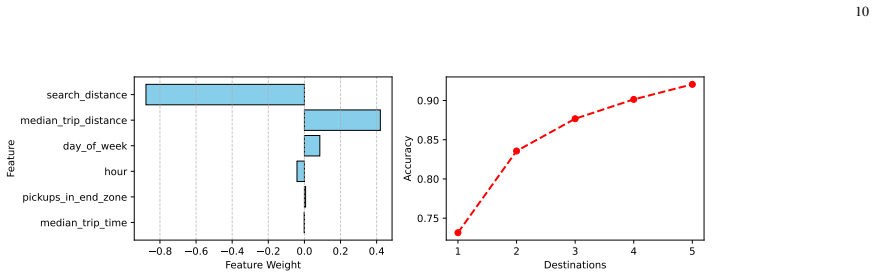
- [Section IV-D, fleet-size results] The text reports results for fleet sizes from 2000 to 4000 drivers, but no table or figure is provided for these runs. Since the fleet-size comparison is described as showing robustness, it should be backed by a corresponding table or figure.
Circularity Check
Network simulation generates driver adherence with the same Beta-Bernoulli Thompson Sampling rule AAVR uses, so the headline gains are conditional on the model's own assumption.
-
other
[Section IV-D, Case Study 4: Network Level Problem (first paragraph), coupled with Section II-B, Eqs. (8)-(9) and Problem IV.1 Eq. (28)]
"All the taxi drivers start with a 50% confidence in the recommender system, suggesting unbiased opinion. The confidence evolves after each recommendation using the Beta-Bernoulli Thompson Sampling based dynamical system as explained in the Driver Confidence section II-B."
The network-level simulation is the evidence for the headline claim that AAVR consistently outperforms state-of-the-art methods. In that simulation, each driver's acceptance probability is updated by exactly the same Beta-Bernoulli Thompson Sampling mechanism defined in Section II-B and computed in Eq. (9), which is also the mechanism AAVR's adherence-estimation module uses to obtain mu(c). The optimizer in Eq. (28) is therefore handed the true generative process of the simulated acceptance decisions, up to Monte Carlo noise in the M samples of Eq. (9). The reported gains over adherence-agnostic baselines consequently measure the value of knowing the simulator's own behavioral rule, not the empirical validity of that rule for real taxi drivers.
full rationale
The mathematical optimization chain in the paper is not circular: the linearization of Problem II.1 into Problem IV.1 is a standard MILP reformulation, and the demand, travel-time, and driver-preference components are benchmarked externally (e.g., XGBoost versus Chronos and Moirai, and top-k destination accuracy against NYC data). The self-citations to prior work [5], [8], and [17] are used for network generation and earlier models, but they are not load-bearing for the central claim. The main circularity is the validation loop around the adherence model: the simulator evolves driver confidence with the same Beta-Bernoulli Thompson Sampling update that AAVR uses to estimate adherence, so the headline 26-29% improvements are generated under the model's own behavioral assumption. This is a partial circularity rather than a complete one, because the non-adherence components have independent support and the result would be meaningful if the behavioral assumption were independently validated; but as presented, the strongest claim reduces to a self-referential test of the model's own premise.
Assumptions & free parameters
free parameters (5)
- beta (objective weight)
- epsilon0, epsilon1 (Beta update weights) =
not reported; Fig. 2 uses 1, 1
- Thompson sampling sample count M
- Initial Beta priors alpha0, beta0, alpha_p, beta_p =
not reported
- XGBoost hyperparameters (look-back window, n_estimators, max_depth, learning_rate) =
grid-searched
assumptions (6)
- domain assumption Driver acceptance follows a Bernoulli trial with probability mu(c) computed by comparing M samples from Theta_r(c) and Theta_p(c).
- domain assumption Beta-Bernoulli conjugate updates with weights epsilon0 and epsilon1 describe how driver confidence evolves after each allocation outcome.
- domain assumption When rejecting a recommendation, each driver chooses among regions according to a multinomial logit model with driver-specific weights wc.
- domain assumption Demand forecast errors are zero-mean Gaussian and the expected allocation can be approximated by min(E[s_j], E[d_j]).
- standard math Driver repositioning decisions are independent Bernoulli random variables, allowing supply expectation via linearity.
- domain assumption Travel time predictions are Gaussian with mean tau_ij and variance epsilon_ij^2, and reachability uses the mean only.
invented entities (1)
-
Driver confidence state (Theta_r(c), Theta_p(c) belief distributions)
Cite this review
Pith. "Pith review of Vehicle Rebalancing Under Adherence Uncertainty." pith.science (2026). https://pith.science/paper/HQ3JNRAT
@misc{pith2026241216632,
  author       = {Pith},
  title        = {Pith review of: Vehicle Rebalancing Under Adherence Uncertainty},
  year         = {2026},
  howpublished = {\url{https://pith.science/paper/HQ3JNRAT}},
  note         = {Machine review of arXiv:2412.16632}
}
read the original abstract
Ride-hailing platforms frequently face spatiotemporal supply-demand imbalances caused by uneven passenger demand and decentralized driver decision-making. Existing vehicle rebalancing methods typically assume drivers always follow repositioning recommendations or model adherence using static probabilities. In practice, adherence evolves through repeated interactions with the platform. We propose the Adherence-Aware Vehicle Rebalancing (AAVR) model, which generates simultaneous fleet-wide repositioning recommendations while explicitly accounting for driver preferences and dynamically evolving adherence. The resulting optimization problem is computationally intractable, so we derive a tractable upper-bound reformulation that enables real-time recommendation generation for large-scale systems. Simulations on the NYC taxi dataset under dynamic adherence updates show that AAVR consistently outperforms state-of-the-art methods, improving served demand by 26.72%, reducing passenger waiting time by 26.45%, increasing platform and driver profits by 25.90% and 28.75%, respectively, and improving fleet adherence by 30.06%. These results demonstrate that modeling evolving driver adherence improves both operational performance and long-term adherence to platform recommendations.
Figures
Figures from the paper (9 more)
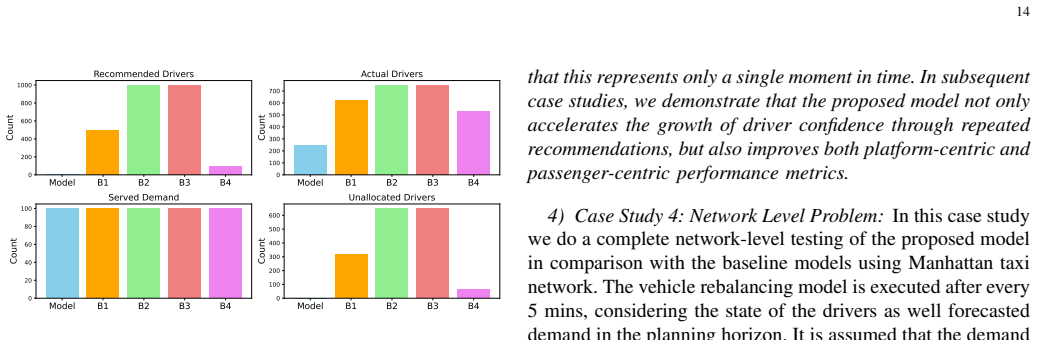
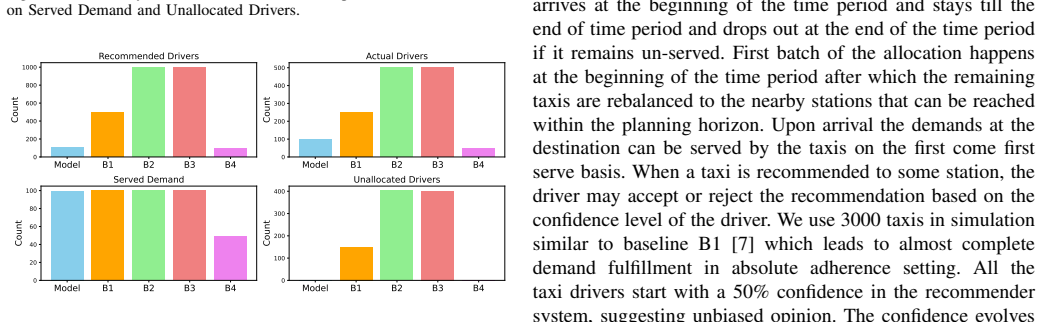
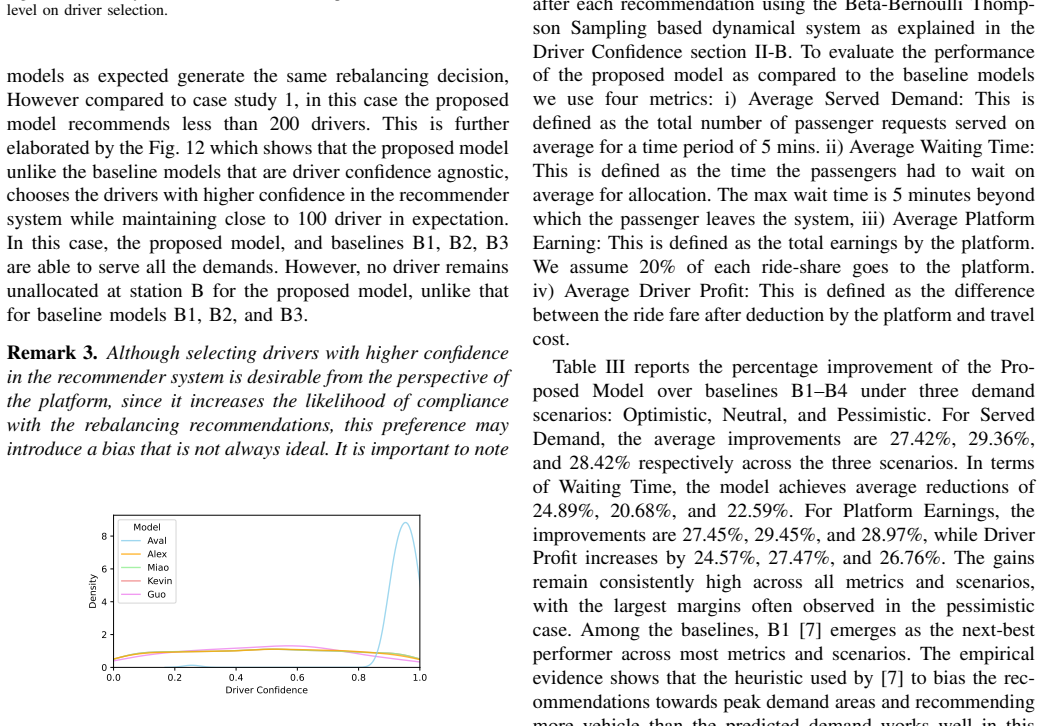
Reference graph
Works this paper leans on
-
[27]
i-rebalance: Personalized vehicle repositioning for supply demand balance,
H. Chen, P. Sun, Q. Song, W. Wang, W. Wu, W. Zhang, G. Gao, and Y . Lyu, “i-rebalance: Personalized vehicle repositioning for supply demand balance,” in Proceedings of the AAAI Conference on Artificial Intelligence, vol. 38, no. 1, 2024, pp. 46–54
work page 2024
-
[20]
Deconstructing the human algorithms for exploration,
S. J. Gershman, “Deconstructing the human algorithms for exploration,” Cognition, vol. 173, pp. 34–42, 2018
work page 2018
-
[23]
Human collective intelligence as distributed bayesian inference,
P. M. Krafft, J. Zheng, W. Pan, N. Della Penna, Y . Altshuler, E. Shmueli, J. B. Tenenbaum, and A. Pentland, “Human collective intelligence as distributed bayesian inference,” arXiv preprint arXiv:1608.01987, 2016
arXiv 2016
-
[1]
Analysis and control of autonomous mobility-on-demand systems,
G. Zardini, N. Lanzetti, M. Pavone, and E. Frazzoli, “Analysis and control of autonomous mobility-on-demand systems,” Annual Review of Control, Robotics, and Autonomous Systems , vol. 5, pp. 633–658, 2022
2022
-
[2]
Robotic load balancing for mobility-on-demand systems,
M. Pavone, S. L. Smith, E. Frazzoli, and D. Rus, “Robotic load balancing for mobility-on-demand systems,” The International Journal of Robotics Research, vol. 31, no. 7, pp. 839–854, 2012
2012
-
[3]
Shared-vehicle mobility-on-demand systems: A fleet operator’s guide to rebalancing empty vehicles,
K. Spieser, S. Samaranayake, W. Gruel, and E. Frazzoli, “Shared-vehicle mobility-on-demand systems: A fleet operator’s guide to rebalancing empty vehicles,” in Transportation Research Board 95th Annual Meet- ing, no. 16-5987. Transportation Research Board, 2016
work page 2016
-
[4]
Data-driven robust taxi dispatch under demand uncertainties,
F. Miao, S. Han, S. Lin, Q. Wang, J. A. Stankovic, A. Hendawi, D. Zhang, T. He, and G. J. Pappas, “Data-driven robust taxi dispatch under demand uncertainties,” IEEE Transactions on Control Systems Technology, vol. 27, no. 1, pp. 175–191, 2017
2017
-
[5]
Dynamic supply-demand balancing policy for cmod fleet,
A. S. Brar and R. Su, “Dynamic supply-demand balancing policy for cmod fleet,” in 2021 IEEE International Intelligent Transportation Systems Conference (ITSC) . IEEE, 2021, pp. 2435–2440
work page 2021
Show all 33 references
-
[6]
Taxi dispatch with real-time sensing data in metropolitan areas: A receding horizon control approach,
F. Miao, S. Lin, S. Munir, J. A. Stankovic, H. Huang, D. Zhang, T. He, and G. J. Pappas, “Taxi dispatch with real-time sensing data in metropolitan areas: A receding horizon control approach,” in Proceed- ings of the ACM/IEEE Sixth International Conference on Cyber-Physical Sy...
2015
-
[7]
Vehicle rebalancing for mobility-on-demand systems with ride-sharing,
A. Wallar, M. Van Der Zee, J. Alonso-Mora, and D. Rus, “Vehicle rebalancing for mobility-on-demand systems with ride-sharing,” in 2018 IEEE/RSJ international conference on intelligent robots and systems (IROS). IEEE, 2018, pp. 4539–4546
2018
-
[8]
Ensuring service fairness in taxi fleet man- agement,
A. S. Brar and R. Su, “Ensuring service fairness in taxi fleet man- agement,” in 2020 IEEE 23rd International Conference on Intelligent Transportation Systems (ITSC) . IEEE, 2020, pp. 1–6
2020
-
[9]
Supply-demand balancing model for ev rental fleet,
A. S. Brar, P. Kasture, and R. Su, “Supply-demand balancing model for ev rental fleet,” in 2022 IEEE 25th International Conference on Intelligent Transportation Systems (ITSC). IEEE, 2022, pp. 1350–1355
2022
-
[10]
Rebalancing shared mobility-on-demand systems: A reinforcement learning approach,
J. Wen, J. Zhao, and P. Jaillet, “Rebalancing shared mobility-on-demand systems: A reinforcement learning approach,” in 2017 IEEE 20th inter- national conference on intelligent transportation systems (ITSC) . Ieee, 2017, pp. 220–225
2017
-
[11]
A deep reinforcement learning framework for rebalancing dockless bike sharing systems,
L. Pan, Q. Cai, Z. Fang, P. Tang, and L. Huang, “A deep reinforcement learning framework for rebalancing dockless bike sharing systems,” in Proceedings of the AAAI conference on artificial intelligence , vol. 33, no. 01, 2019, pp. 1393–1400
2019
-
[12]
A deep reinforcement learning approach to ride- sharing vehicle dispatching in autonomous mobility-on-demand sys- tems,
G. Guo and Y . Xu, “A deep reinforcement learning approach to ride- sharing vehicle dispatching in autonomous mobility-on-demand sys- tems,” IEEE Intelligent Transportation Systems Magazine, vol. 14, no. 1, pp. 128–140, 2020
2020
-
[13]
Benchmarking reinforcement learning for network-level coordination of autonomous mobility-on-demand systems across scales
L. Tresca, D. Gammelli, J. Harrison, G. Zardini, and M. Pavone, “Benchmarking reinforcement learning for network-level coordination of autonomous mobility-on-demand systems across scales.”
-
[14]
Estimate then predict: Convex formulation for travel demand forecasting,
Y . Kim, G. Zardini, S. Samaranayake, and S. Shafiee, “Estimate then predict: Convex formulation for travel demand forecasting,” Available at SSRN 4977199 , 2024
2024
-
[15]
Data-driven vehicle rebalancing with predictive prescriptions in the ride-hailing system,
X. Guo, Q. Wang, and J. Zhao, “Data-driven vehicle rebalancing with predictive prescriptions in the ride-hailing system,” IEEE Open Journal of Intelligent Transportation Systems , vol. 3, pp. 251–266, 2022
2022
-
[16]
Joint pricing and rebalancing of autonomous mobility-on-demand systems,
S. Wollenstein-Betech, I. C. Paschalidis, and C. G. Cassandras, “Joint pricing and rebalancing of autonomous mobility-on-demand systems,” in 2020 59th IEEE Conference on Decision and Control (CDC) . IEEE, 2020, pp. 2573–2578
2020
-
[17]
Integrated user matching and pricing in round-trip car-sharing,
A. S. Brar, R. Su, G. Zardini, and J. Kaur, “Integrated user matching and pricing in round-trip car-sharing,” arXiv preprint arXiv:2407.08238, 2024
2024 arXiv
-
[18]
Robust matching-integrated vehicle rebalancing in ride-hailing system with uncertain demand,
X. Guo, N. S. Caros, and J. Zhao, “Robust matching-integrated vehicle rebalancing in ride-hailing system with uncertain demand,” Transporta- tion Research Part B: Methodological , vol. 150, pp. 161–189, 2021
2021
-
[19]
A tutorial on Thompson sampling,
D. J. Russo, B. Van Roy, A. Kazerouni, I. Osband, Z. Wen et al. , “A tutorial on Thompson sampling,” Foundations and Trends® in Machine Learning, vol. 11, no. 1, pp. 1–96, 2018
2018
-
[21]
Uncertainty and exploration
——, “Uncertainty and exploration.” Decision, vol. 6, no. 3, p. 277, 2019
2019
-
[22]
A behavioral model for exploration vs. exploitation: Theoretical framework and experimental evidence,
J. Ding, Y . Feng, and Y . Rong, “A behavioral model for exploration vs. exploitation: Theoretical framework and experimental evidence,” arXiv preprint arXiv:2207.01028, 2022
2022 arXiv
-
[24]
A two-stage approach to modeling vacant taxi movements,
R. Wong, W. Szeto, and S. Wong, “A two-stage approach to modeling vacant taxi movements,” Transportation Research Procedia, vol. 7, pp. 254–275, 2015
2015
-
[25]
Modeling taxi driver search behavior under uncertainty,
Z. Zheng, S. Rasouli, and H. Timmermans, “Modeling taxi driver search behavior under uncertainty,” Travel Behaviour and Society , vol. 22, pp. 207–218, 2021
2021
-
[26]
Where ridehail drivers go between trips,
A. Millard-Ball, L. Liu, W. Hansen, D. Cooper, and J. Castiglione, “Where ridehail drivers go between trips,” Transportation, vol. 50, no. 5, pp. 1959–1981, 2023
1959
-
[28]
New york city taxi data (2010-2013),
B. Donovan and D. Work, “New york city taxi data (2010-2013),” Dataset, http://dx. doi. org/10.13012/J8PN93H8 , 2014
2010 doi
- [29]
-
[30]
On computing the distribution function for the poisson bino- mial distribution,
Y . Hong, “On computing the distribution function for the poisson bino- mial distribution,” Computational Statistics & Data Analysis , vol. 59, pp. 41–51, 2013
2013
-
[31]
Xgboost: A scalable tree boosting system,
T. Chen and C. Guestrin, “Xgboost: A scalable tree boosting system,” in Proceedings of the 22nd acm sigkdd international conference on knowledge discovery and data mining , 2016, pp. 785–794
2016
-
[32]
Chronos: Learning the language of time series,
A. F. Ansari, L. Stella, C. Turkmen, X. Zhang, P. Mercado, H. Shen, O. Shchur, S. S. Rangapuram, S. P. Arango, S. Kapoor et al., “Chronos: Learning the language of time series,” arXiv preprint arXiv:2403.07815, 2024
2024 arXiv
-
[33]
Unified training of universal time series forecasting transformers,
G. Woo, C. Liu, A. Kumar, C. Xiong, S. Savarese, and D. Sahoo, “Unified training of universal time series forecasting transformers,” arXiv preprint arXiv:2402.02592 , 2024. Avalpreet Singh Brar received the Bachelor of Engineering degree from the School of Electrical Engineeri...
1948 arXiv
Reviewed August 11, 2026 · model on record in the stance chip above.
Discussion (0). Continue with ORCID to comment.