pith. sign in

arxiv: 2606.31696 · v1 · pith:HUYNWHBJnew · submitted 2026-06-30 · ⚛️ physics.ed-ph · physics.atom-ph

Notes from the Physics Teaching Lab: Rubidium Atomic Spectroscopy

Pith reviewed 2026-07-01 01:58 UTC · model grok-4.3

classification ⚛️ physics.ed-ph physics.atom-ph
keywords rubidium spectroscopydiode laseratomic physicsphysics teaching labdata analysislaboratory experiments
0
0 comments X

The pith

A commercial diode laser spectroscopy instrument enables detailed rubidium atomic experiments with measurement and analysis examples for teaching labs.

A machine-rendered reading of the paper's core claim, the machinery that carries it, and where it could break.

The paper examines the capabilities of a commercial diode laser spectroscopy instrument through a series of rubidium experiments. It supplies numerous concrete examples of measurements and data analysis procedures. These serve as a direct supplement to the instrument's users manual. Instructors in university physics teaching labs can draw on the material to design and run their own curricula.

Core claim

The paper establishes that the commercial diode laser spectroscopy instrument supports a range of rubidium atomic spectroscopy experiments, with explicit examples of how to carry out the measurements and perform the associated data analysis.

What carries the argument

The commercial diode laser spectroscopy instrument that performs diode-laser-based rubidium spectroscopy.

If this is right

  • Instructors obtain ready-to-use measurement examples for lab curricula.
  • Students can follow explicit procedures for acquiring and analyzing atomic spectra.
  • Teaching labs can implement the experiments without additional development.
  • Data analysis methods demonstrated apply directly to student reports.

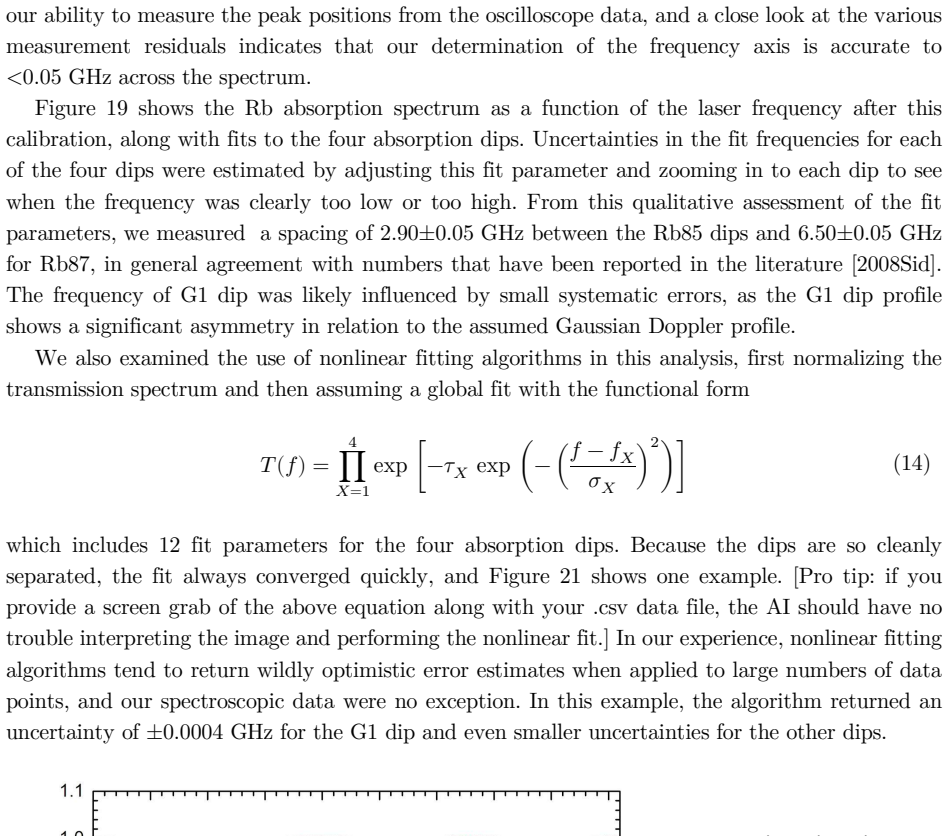
Where Pith is reading between the lines

These are editorial extensions of the paper, not claims the author makes directly.

  • The same instrument and example format could support spectroscopy experiments on other alkali atoms.
  • Collected student data from these labs might allow comparison of measurement precision across institutions.

Load-bearing premise

That the commercial instrument is available and already installed for use in university teaching labs.

What would settle it

A direct test showing that the described rubidium spectroscopy measurements and analysis steps cannot be reproduced with the instrument.

Figures

Figures reproduced from arXiv: 2606.31696 by Kenneth G. Libbrecht.

Figure 1
Figure 1. Figure 1: This photo shows Teachspin’s Diode Laser Spectroscopy apparatus and associated hardware on an op [PITH_FULL_IMAGE:figures/full_fig_p001_1.png] view at source ↗
Figure 2
Figure 2. Figure 2: This sketch shows a simplified level diagrams for Rb87 (leŌ [PITH_FULL_IMAGE:figures/full_fig_p004_2.png] view at source ↗
Figure 3
Figure 3. Figure 3: This plot shows a measured Rb transmission spectrum through a rubidium vapor cell that we obtained using our Teachspin apparatus. The four transmission dips correspond to transiƟons from the four Rb ground states shown in [PITH_FULL_IMAGE:figures/full_fig_p004_3.png] view at source ↗
Figure 4
Figure 4. Figure 4: This sketch shows the opƟcal layout for making a first observaƟon of the rubidium absorpƟon spectrum. The OD2 aƩenuator should be removed for the iniƟal alignment [PITH_FULL_IMAGE:figures/full_fig_p005_4.png] view at source ↗
Figure 5
Figure 5. Figure 5: The photo above shows the Teachspin laser controller, and the electronics layout (leŌ) shows the connecƟons used to scan the laser frequency and observe the light transmiƩed through the Rb vapor cell. The connecƟons shown are all BNC cables, and we used a Keysight DSOX1204A oscilloscope to collect most of the data described in this paper [PITH_FULL_IMAGE:figures/full_fig_p006_5.png] view at source ↗
Figure 6
Figure 6. Figure 6: A typical first oscilloscope screenshot (negaƟve image) showing the four Rb absorpƟon features, also shown in [PITH_FULL_IMAGE:figures/full_fig_p006_6.png] view at source ↗
Figure 7
Figure 7. Figure 7: This graph shows digital oscilloscope data converted to a normalized Rb transmission spectrum. The red curve is from a chi-by-eye fit to the G3 dip, equal to exp[- 0.675*exp[-(Δf-1.155)^2/0.31^2]]). Note that the zero point of the laser frequency detuning Δf is essenƟally an arbitrary experimental parameter in this and other spectra data plots [PITH_FULL_IMAGE:figures/full_fig_p008_7.png] view at source ↗
Figure 8
Figure 8. Figure 8: This graph shows two measured Rb absorpƟon spectra at different vapor-cell temperatures, along with fits to the G4 dip. Note that the background PD signal (nonzero flat line) strongly affects the 69C data and fits [PITH_FULL_IMAGE:figures/full_fig_p009_8.png] view at source ↗
Figure 9
Figure 9. Figure 9: The points in this plot show measured values of 𝜏Ј (𝑇 ) for the G4 dip as a funcƟon of the temperature of the Rb vapor cell, with error esƟmates for both 𝜏Ј and the cell temperature. The red curve shows the Arrhenius model described in the text [PITH_FULL_IMAGE:figures/full_fig_p010_9.png] view at source ↗
Figure 10
Figure 10. Figure 10: These data and the included model are the same as in [PITH_FULL_IMAGE:figures/full_fig_p011_10.png] view at source ↗
Figure 11
Figure 11. Figure 11: We used these four opƟcal filters to measure saturated absorpƟon. The transmission values of these filters at 780nm (last column) were esƟmated from the Thorlabs website [PITH_FULL_IMAGE:figures/full_fig_p012_11.png] view at source ↗
Figure 12
Figure 12. Figure 12: These sample spectra show the G3 and G4 absorp [PITH_FULL_IMAGE:figures/full_fig_p013_12.png] view at source ↗
Figure 13
Figure 13. Figure 13: The data points in this graph give the measured effecƟve opƟcal depth 𝜏଴,௘௙௙ of the G3 absorpƟon feature as a funcƟon of the laser aƩenuaƟon factor (equal to the opƟcal filter transmission). The red line is a fit to the data using EquaƟon (12) with 𝑠ֈռ֓ = 𝐼Ј /𝐼֎ռ֏ = 60 [PITH_FULL_IMAGE:figures/full_fig_p013_13.png] view at source ↗
Figure 14
Figure 14. Figure 14: shows our laser beam projected onto a paper card printed with various scale lines, revealing the diode laser’s elliptical beam shape. From this image we estimate a beam waist size of 𝑤֓ ≈ 0.6 mm and 𝑤֔ ≈ 1.0 mm, and combining these with the measured laser power of 6.4 mW (minus 10% for reflection losses by the entrance window of the Rb cell) gives an intensity of 𝐼Ј ≈ 6100 W/mϵ at the center of the beam. … view at source ↗
Figure 15
Figure 15. Figure 15: This plot shows the same data points as in [PITH_FULL_IMAGE:figures/full_fig_p015_15.png] view at source ↗
Figure 16
Figure 16. Figure 16: We used this opƟcal layout to produce a Rb absorpƟon spectrum with a calibrated frequency scan [PITH_FULL_IMAGE:figures/full_fig_p016_16.png] view at source ↗
Figure 17
Figure 17. Figure 17: The black line in this graph shows the Rb absorpƟon spectrum recorded by PD1 in [PITH_FULL_IMAGE:figures/full_fig_p017_17.png] view at source ↗
Figure 18
Figure 18. Figure 18: The data points on the right show measurements of the posiƟons of each of the cavity peaks in [PITH_FULL_IMAGE:figures/full_fig_p017_18.png] view at source ↗
Figure 20
Figure 20. Figure 20: For this measured cavity scan, we used a 100 MHz sine-wave signal to modulate the laser frequency, thus adding 100-MHz sidebands to the cavity peaks. By measuring the posiƟons of these sidebands relaƟve to the main cavity peaks, we can measure ∆𝑓էմճ relaƟve to the sine-wave frequency, ulƟmately giving ∆𝑓էմճ = 375.45 ± 0.5 MHz [PITH_FULL_IMAGE:figures/full_fig_p018_20.png] view at source ↗
Figure 19
Figure 19. Figure 19: This plot shows the same Rb absorpƟon spectrum shown in [PITH_FULL_IMAGE:figures/full_fig_p018_19.png] view at source ↗
Figure 21
Figure 21. Figure 21: This plot shows a normalized transmission spectrum derived from the same data as in [PITH_FULL_IMAGE:figures/full_fig_p019_21.png] view at source ↗
Figure 22
Figure 22. Figure 22: This plot from [2024Bal] shows a theoreƟcal model of the Rb absorpƟon spectrum at 780 nm, including the individual contribuƟons of all the allowed transiƟons. Here we see that the G1 dip is dominated by the highest energy F=2 to F=3 transiƟon, while the G4 dip is dominated by lower energy transiƟons. Thus the G4-G1 dip separaƟon of 6.50 GHz is lower than the Rb87 ground-state spliƫng of 6.83 GHz. This plo… view at source ↗
Figure 23
Figure 23. Figure 23: The basic saturated absorpƟon spectroscopy setup. The two laser beams are Ɵlted here for clarity; in pracƟce the beams are collinear and fully overlap [PITH_FULL_IMAGE:figures/full_fig_p021_23.png] view at source ↗
Figure 24
Figure 24. Figure 24: These sketches show a qualitaƟve model of saturated-absorpƟon spectroscopy for 2-level atoms, illustraƟng the probe transmission without (leŌ) and with (right) the pump beam. Because the pump and probe lasers with both excite the 2-level transiƟon for zero-velocity atoms (and not for atoms with nonzero velociƟes), the probe absorpƟon is diminished by saturated absorpƟon only at the zero-velocity resonance… view at source ↗
Figure 25
Figure 25. Figure 25: Applying SAS to atoms with one ground state and two excited states yields two normal SAS peaks and an addiƟonal “crossover peak” at a frequency halfway between the two normal peaks. The crossover peak is caused by atoms moving as a velocity where one laser is redshiŌed and excites the lower-energy transiƟon while the other laser is blue-shiŌed and excites the higher-energy transiƟon [PITH_FULL_IMAGE:figu… view at source ↗
Figure 26
Figure 26. Figure 26: shows an optical layout that works quite well for performing Doppler-free saturated￾absorption spectroscopy in the teaching lab. The rotatable polarizer in the pump beam is not essential in this layout, but it is useful for observing how the SAS peaks change with the pump intensity. On technical detail in this layout is that the beamsplitters must have the correct “handedness” to avoid blocking the transm… view at source ↗
Figure 27
Figure 27. Figure 27: show some saturated-absorption-spectroscopy data taken using the optical layout in [PITH_FULL_IMAGE:figures/full_fig_p024_27.png] view at source ↗
Figure 26
Figure 26. Figure 26: Note that the G1 SAS peaks are fully resolved in this spectrum while the G3 peaks are [PITH_FULL_IMAGE:figures/full_fig_p024_26.png] view at source ↗
Figure 28
Figure 28. Figure 28: The top plot on the leŌ shows the normalized SAS probe transmission with the pump beam on (black line) and with the pump beam blocked (red). The Rb cell temperature was 45C, and some care was taken to reduce unwanted scaƩered light from the (very bright) pump beam entering PD1. The lower plot shows the difference of the pump-on and pump-off signals, together with a spectrum from the confocal cavity (green… view at source ↗
Figure 29
Figure 29. Figure 29: The top spectrum on this plot shows a measured SAS data of the G1 dip, while the boƩom trace shows the same spectrum but with 100 MHz sidebands on all the peaks. Although the spectrum is a bit confusion-limited with overlapping peaks, it is straighƞorward to disentangle the data sufficiently to measure the upper-state hyperfine spliƫngs with considerable accuracy [PITH_FULL_IMAGE:figures/full_fig_p025_29.png] view at source ↗
Figure 30
Figure 30. Figure 30: Examples of saturated-absorpƟon spectra for all four Rb dips, each exhibiƟng three normal SAS peaks and three crossover peaks [PITH_FULL_IMAGE:figures/full_fig_p026_30.png] view at source ↗
Figure 31
Figure 31. Figure 31: This “toy” model of the Zeeman effect is sufficient to explain many aspects of the Rb transmission spectra observed in the teaching-lab experiments presented in this paper. The sketch on the leŌ shows an F=0 to F=1 level structure, with the upper levels split by the Zeeman effect. Laser light with 𝜎− circular polarizaƟon (see Appendix 1) will excite the m=-1 upper state only, while 𝜎+ light will excite th… view at source ↗
Figure 32
Figure 32. Figure 32: This sketch shows the opƟcal layout used to measure the Zeeman spliƫng [PITH_FULL_IMAGE:figures/full_fig_p028_32.png] view at source ↗
Figure 33
Figure 33. Figure 33: This plot shows Zeeman shiŌ data using the opƟcal layout in [PITH_FULL_IMAGE:figures/full_fig_p029_33.png] view at source ↗
Figure 34
Figure 34. Figure 34: Because the difference signal goes through zero at each of the absorption dips, it can be [PITH_FULL_IMAGE:figures/full_fig_p029_34.png] view at source ↗
Figure 34
Figure 34. Figure 34: The top (black) line in this plot shows the normal Rb absorpƟon spectra with no applied magneƟc field, and the lower (green) line shows the difference of the 𝜎+ and 𝜎− spectra. The lower curve can be used in a servo feedback loop to “lock” the laser at a frequency near any of the zero crossing points. This laser frequency stabilization technique is called a “dichroic atomic vapor laser lock (DAVLL)” [1998… view at source ↗
Figure 35
Figure 35. Figure 35: This sketch shows the opƟcal layout for the MOF experiment. In the absence of the Rb cell, the PBS sends all the laser light to PD2. What PD1 sees is essenƟally the Rb cell between crossed polarizers [PITH_FULL_IMAGE:figures/full_fig_p031_35.png] view at source ↗
Figure 36
Figure 36. Figure 36: This graph (generated by the AI tool Claude) shows a theore [PITH_FULL_IMAGE:figures/full_fig_p032_36.png] view at source ↗
Figure 37
Figure 37. Figure 37: This graph shows MOF data taken with a Rb cell temperature of 50C. The top plot displays the normalized PD2 spectrum, from which we measured the 𝜏Ј values shown. The middle plot gives the normalized PD1 signal at different values of the coil current (with B = 33.3 Gauss/A). The lower plot shows 16 separate MOF models, each assuming a single atomic transiƟon with 𝜎 = 330 MHz. The models calculated at diffe… view at source ↗
Figure 38
Figure 38. Figure 38: The data points on this plot show measurements of the normalized on￾resonant transmission of the MOF, taken with a Rb cell temperature of 40C. The accompanying lines show model calculaƟons at 𝛿 = 0, where solid lines show the full theory and doƩed lines give the Faraday-rotaƟon limit, which applies for small 𝜏Ј and 𝛿ջ [PITH_FULL_IMAGE:figures/full_fig_p034_38.png] view at source ↗
Figure 39
Figure 39. Figure 39: This sketch shows an opƟcal layout for directly measuring the Faraday rotaƟon from a Rb atomic vapor [1996Baa]. The output from the experiment is the difference signal PD1-PD2 [PITH_FULL_IMAGE:figures/full_fig_p035_39.png] view at source ↗
Figure 40
Figure 40. Figure 40: The leŌ plot shows normalized Faraday rotaƟon data using the opƟcal layout in [PITH_FULL_IMAGE:figures/full_fig_p036_40.png] view at source ↗
Figure 41
Figure 41. Figure 41: The data points here show measurements of the on-resonance (𝛿 = 0) Faraday rotaƟon difference signals for the G3 and G4 spectral features. Solid lines show corresponding full-theory models, while dashed lines show the theory in the low-𝛿ջ limit. For this plot, both models (calculated with no adjustable parameters) were mulƟplied by 1.15 to beƩer fit the data [PITH_FULL_IMAGE:figures/full_fig_p037_41.png] view at source ↗
Figure 42
Figure 42. Figure 42: In classical physics, the electric field vector in a circularly polarized laser beam follows a spiral pa [PITH_FULL_IMAGE:figures/full_fig_p041_42.png] view at source ↗
Figure 43
Figure 43. Figure 43: This plot shows the complex suscepƟbility of the Rb vapor cell for 𝜏Ј = 1, defined in EquaƟon (50) [PITH_FULL_IMAGE:figures/full_fig_p045_43.png] view at source ↗
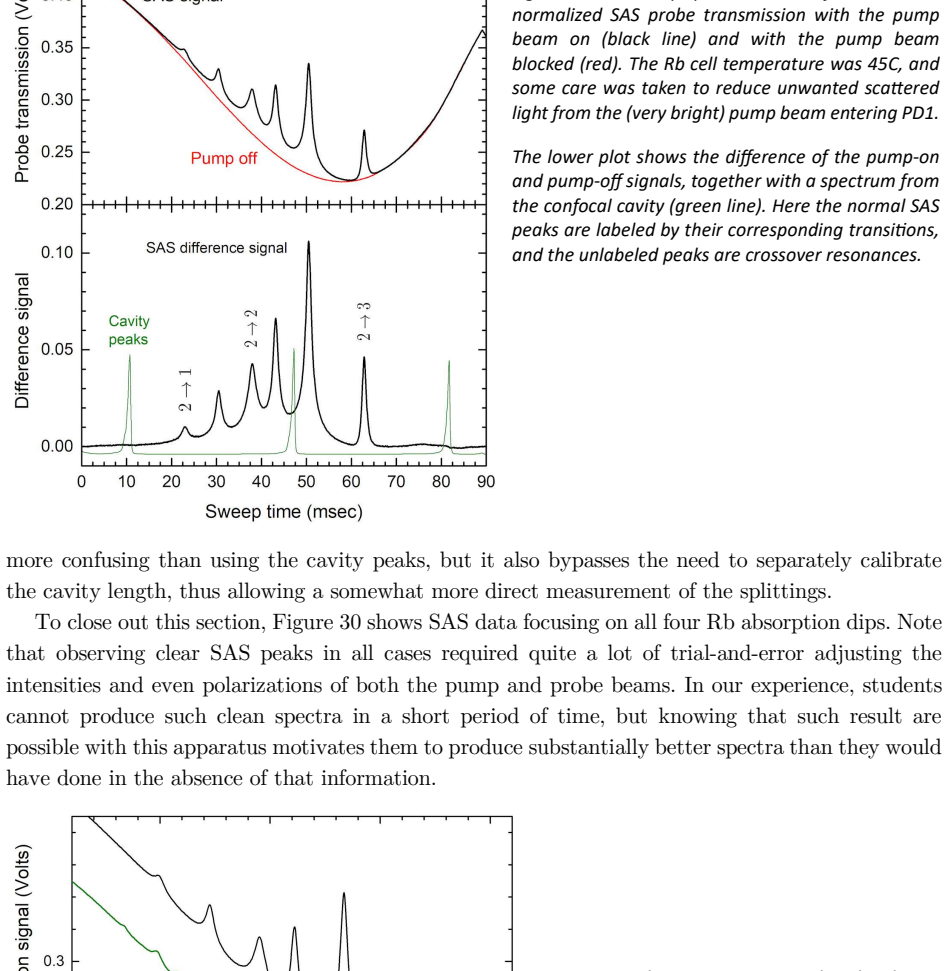
read the original abstract

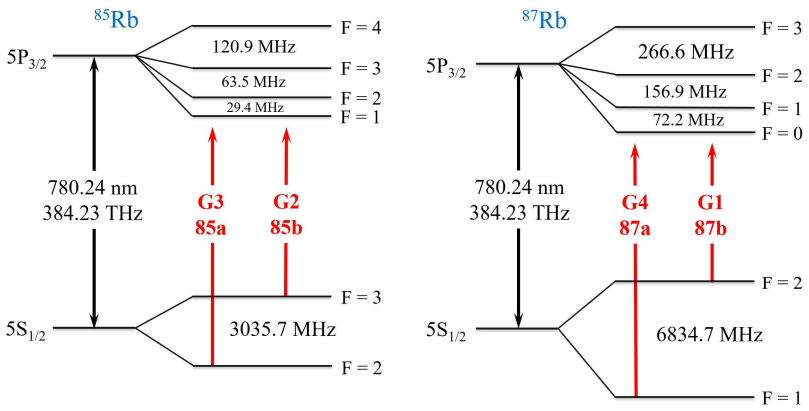
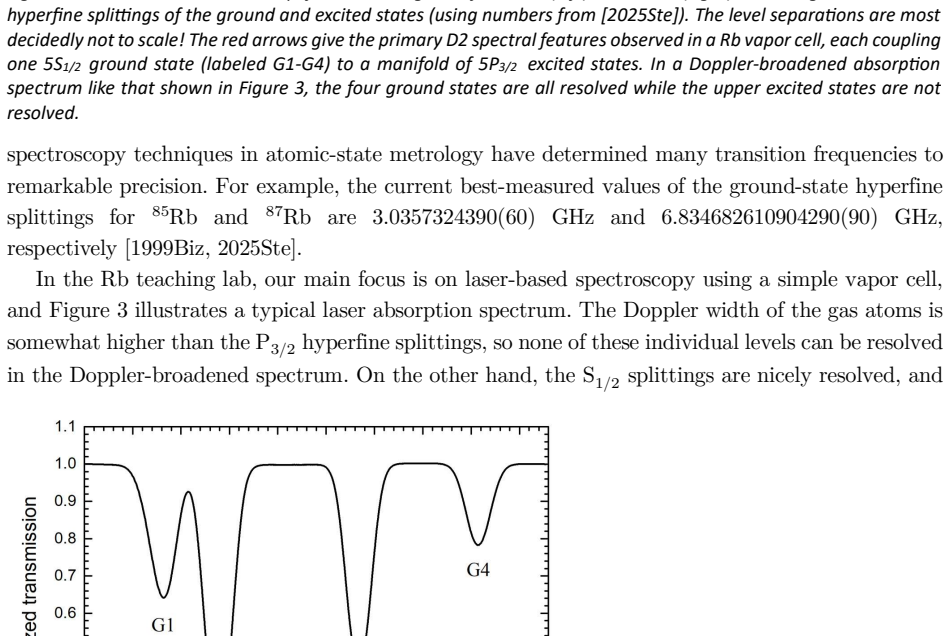
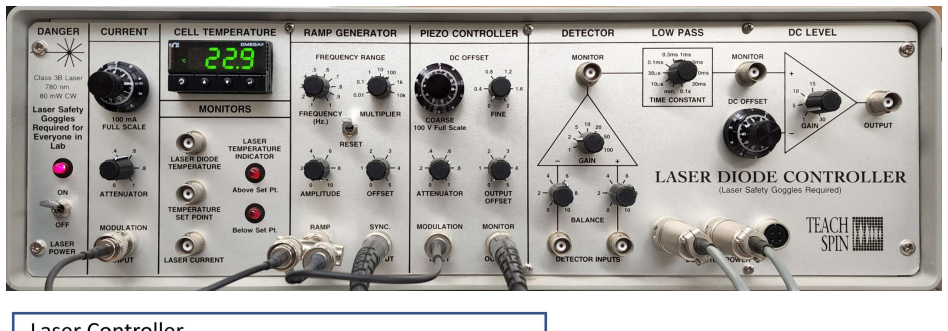
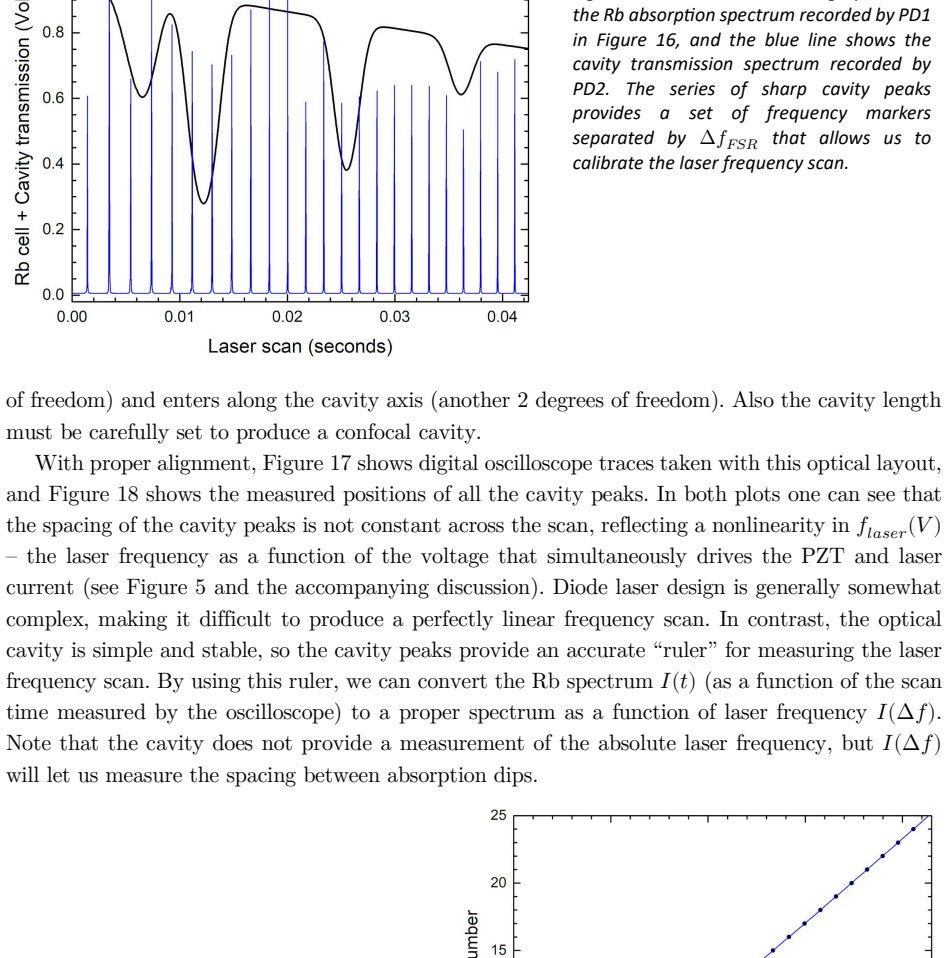
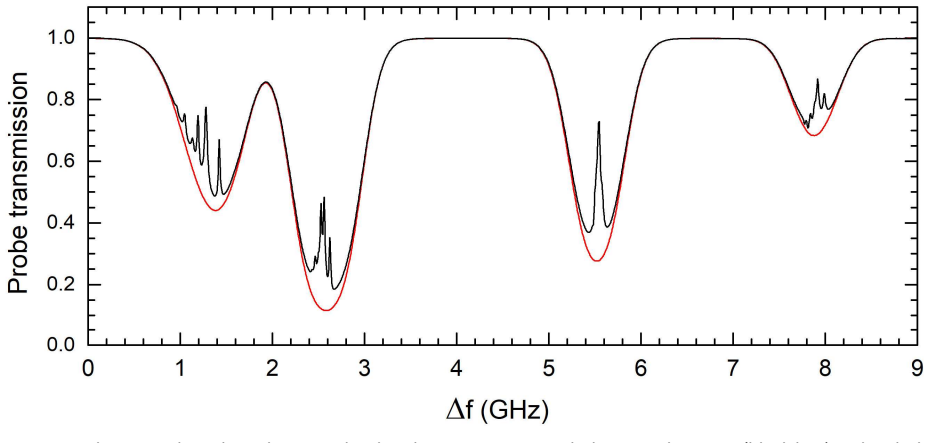
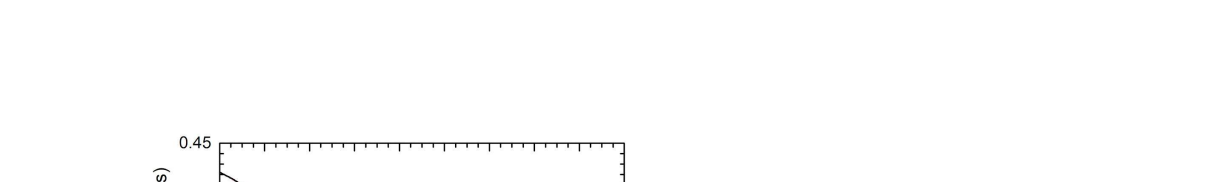
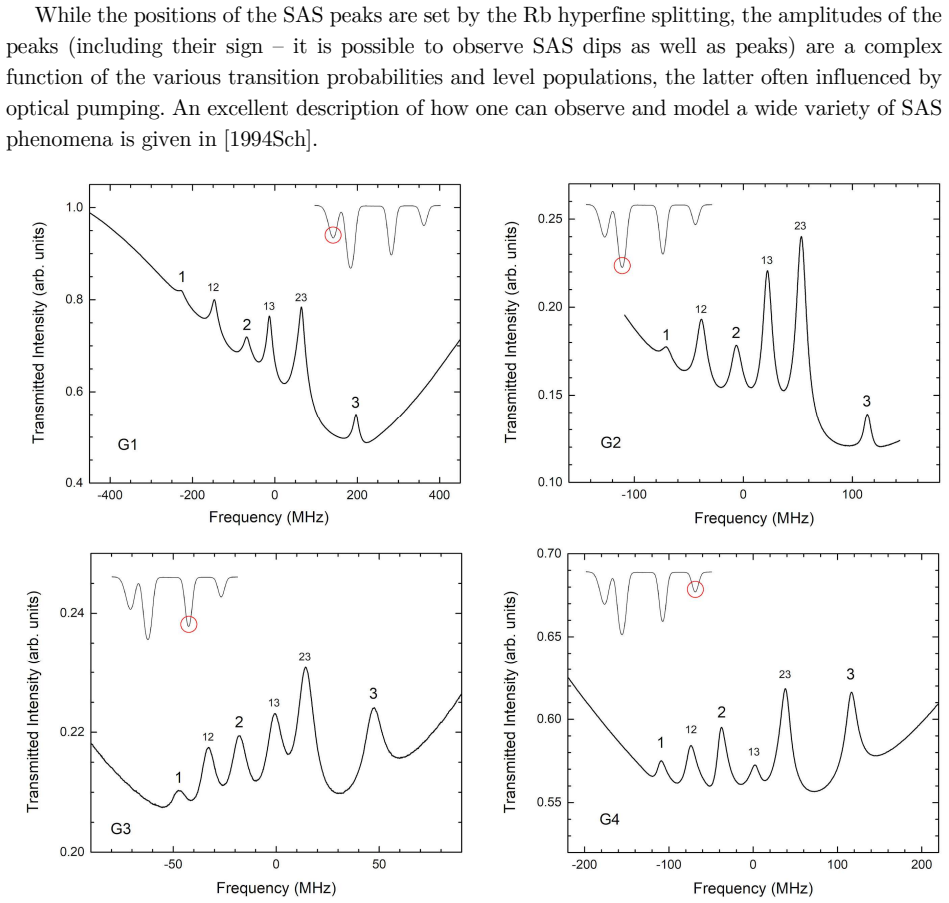
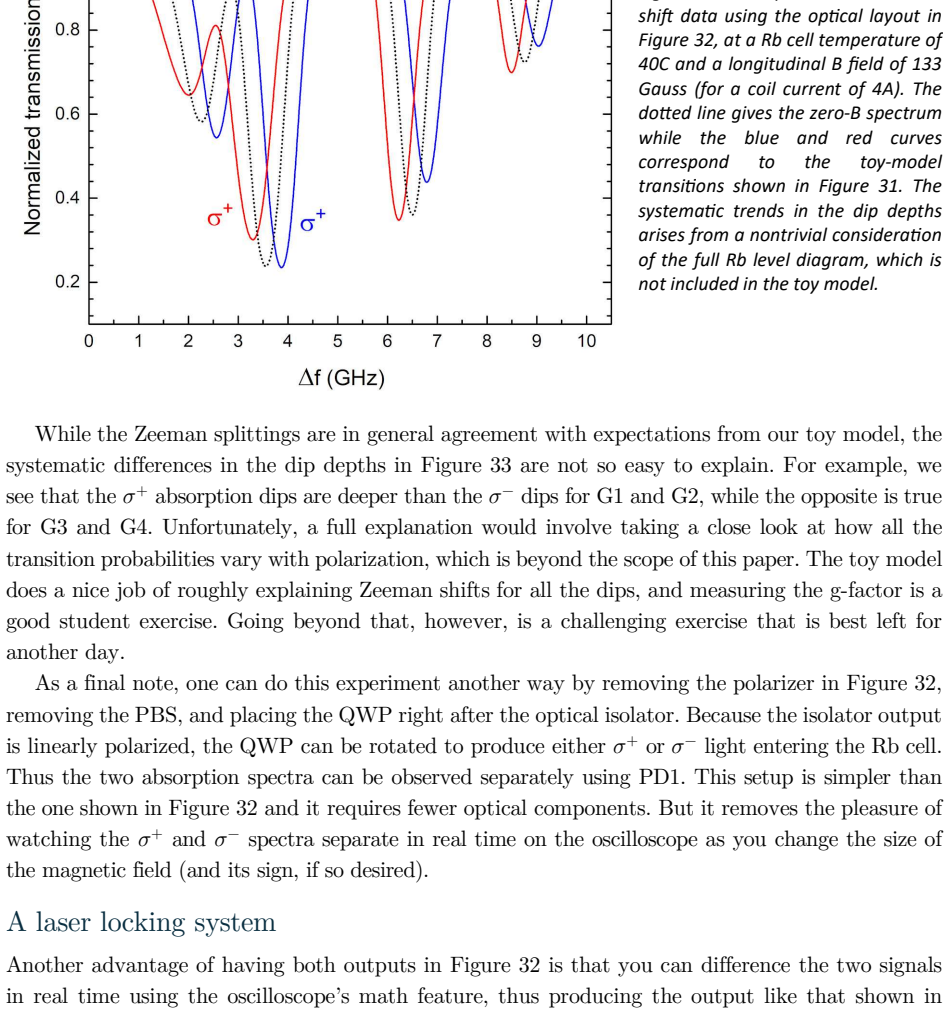
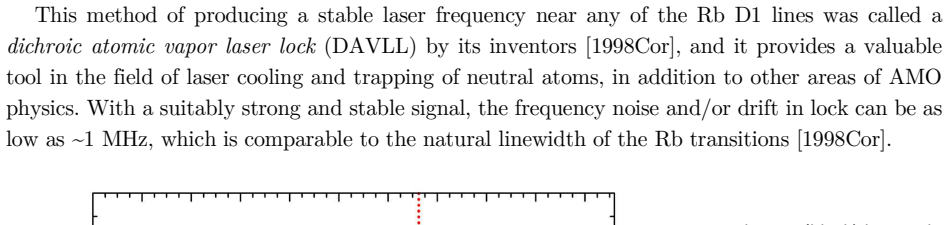
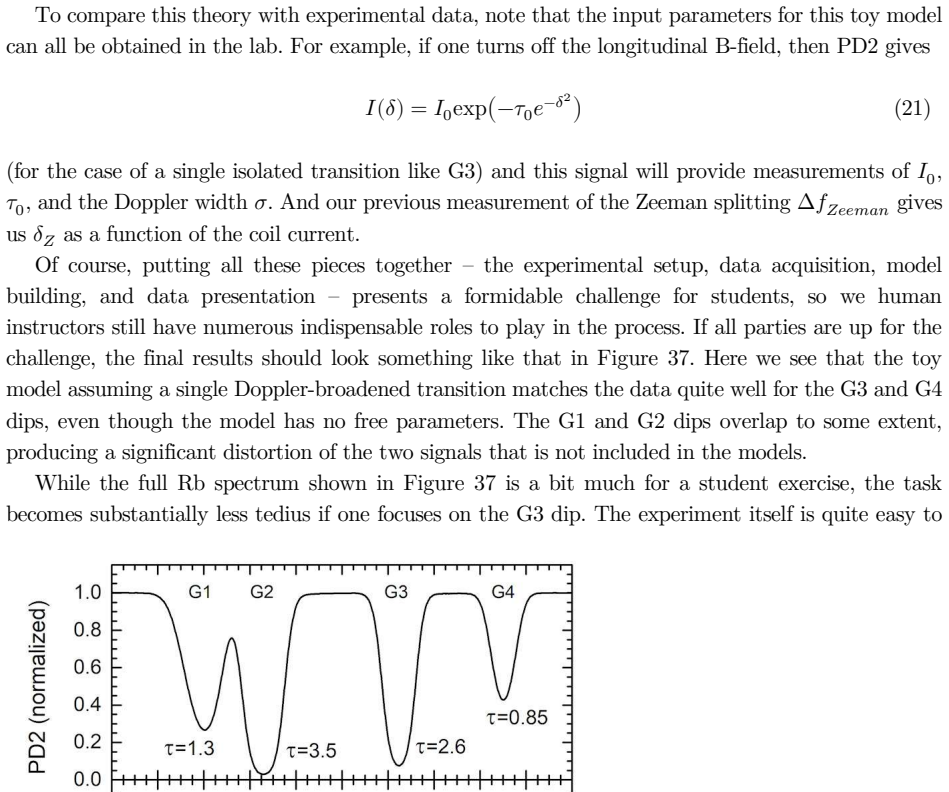
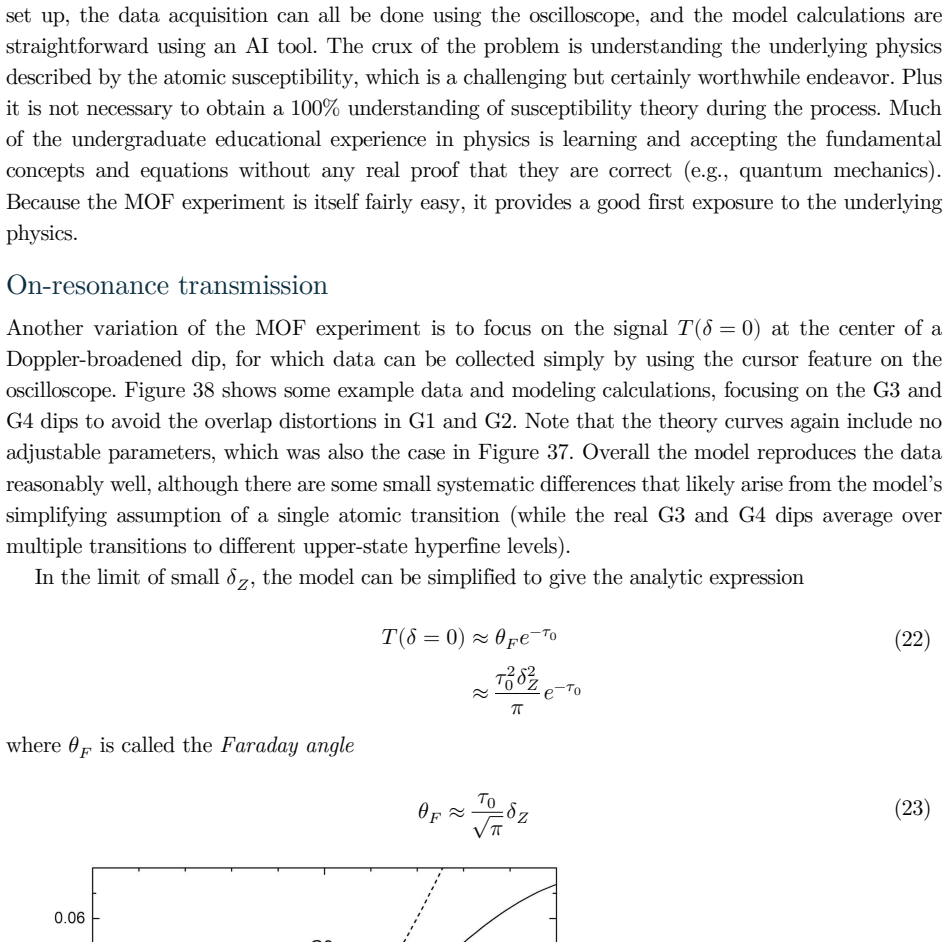
We describe a series of rubidium spectroscopy experiments that can be done using the Teachspin Diode Laser Spectroscopy instrument, which is commercially available and is already being used in physics teaching labs at over 150 universities. Our goal here is to provide a detailed examination of the capabilities of this instrument, including numerous examples of measurements and data analysis, presented as a supplement to the Teachspin users manual. Our hope is that instructors using this product or similar diode-laser-based Rb spectroscopy systems will find the experiments described here useful for designing and implementing the curricula in their own physics teaching labs.

Editorial analysis

A structured set of objections, weighed in public.

Desk editor's note, referee report, simulated authors' rebuttal, and a circularity audit. Tearing a paper down is the easy half of reading it; the pith above is the substance, this is the friction.

Referee Report

0 major / 2 minor

Summary. The manuscript describes a series of rubidium atomic spectroscopy experiments performable with the Teachspin Diode Laser Spectroscopy instrument. It supplies detailed examples of measurements and data analysis procedures as a supplement to the commercial user's manual, with the goal of assisting instructors who use this or similar diode-laser Rb systems in designing physics teaching lab curricula.

Significance. If the described examples are accurate and complete, the work provides a practical pedagogical resource that could aid lab implementation at institutions already equipped with the instrument. The explicit focus on data analysis examples rather than new physical results is a modest strength for an educational note; no machine-checked proofs, parameter-free derivations, or falsifiable predictions are present.

minor comments (2)
  1. [Abstract] Abstract: the assertion that the instrument 'is already being used in physics teaching labs at over 150 universities' is presented without citation or supporting reference; adding a source would strengthen the claim of widespread availability.
  2. [Abstract] The manuscript states its intent to provide 'numerous examples of measurements and data analysis' but the abstract itself contains none; ensure the full text supplies concrete, reproducible procedures with sample data or analysis steps that instructors can directly follow.

Simulated Author's Rebuttal

0 responses · 0 unresolved

We thank the referee for their review and positive recommendation for minor revision. The assessment correctly identifies the manuscript as a practical supplement to the Teachspin manual focused on data analysis examples for teaching labs.

Circularity Check

0 steps flagged

No derivations, predictions, or equations; purely descriptive educational supplement

full rationale

The paper is an educational note describing standard Rb spectroscopy measurements and data analysis on a commercial Teachspin instrument already installed in many labs. It advances no physical claims, derivations, quantitative predictions, or novel results. The central goal (detailed examples as a teaching aid) contains no load-bearing steps that reduce to self-definition, fitted inputs, or self-citation chains. No equations or predictions exist that could exhibit circularity by construction.

Axiom & Free-Parameter Ledger

0 free parameters · 0 axioms · 0 invented entities

Abstract contains no scientific claims, derivations, or new entities; no free parameters, axioms, or invented entities are introduced.

pith-pipeline@v0.9.1-grok · 5612 in / 841 out tokens · 31276 ms · 2026-07-01T01:58:57.231374+00:00 · methodology

discussion (0)

Sign in with ORCID, Apple, or X to comment. Anyone can read and Pith papers without signing in.

Reference graph

Works this paper leans on

1 extracted references · 1 canonical work pages

  1. [1]

    On a new action that light undergoes when passing through some metallic vapors in a magnetic field

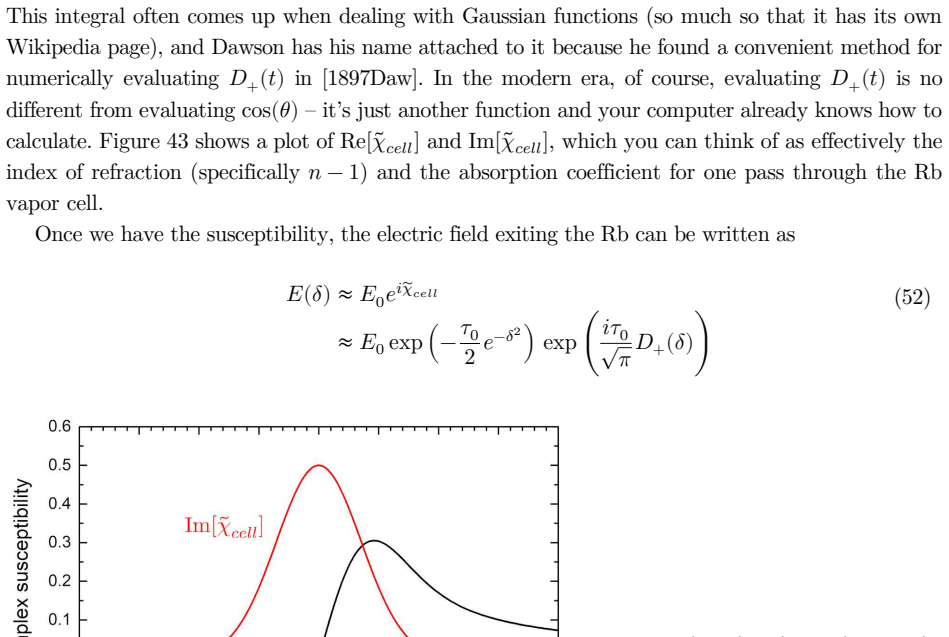
    [1897Daw] H. G. Dawson, On the numerical value of ∫ exp(𝑥ϵ)փ Ј 𝑑𝑥, Proc. London Math. Soc. s1- 29, 519–522 (1897). [1898Mac] D. Macaluso and O. M. Corbino, Sopra una nuova azione che la luce subisce attraversando alcuni vapori metallici in un campo magnetico (Translation: “On a new action that light undergoes when passing through some metallic vapors in a...