(An)Isotropy in Pantheon+ and Type Ia supernova samples: intrinsic limits of directional tests
Pith reviewed 2026-05-20 09:17 UTC · model grok-4.3
The pith
Current supernova samples cannot robustly determine directions of Hubble constant anisotropy.
A machine-rendered reading of the paper's core claim, the machinery that carries it, and where it could break.
Core claim
Within the tests used here, the Region Fitting method and the Hemisphere Comparison method, one can not determine with robustness the direction of an anisotropy of H0 using the present SNe Ia large data samples. This is intrinsic to the way H0 is obtained with the SN Ia lightcurve method. Achieving robust constraints will require a quite uniform sky coverage from larger SNe Ia samples with improved systematics.
What carries the argument
Region Fitting and Hemisphere Comparison methods, which compare H0 values across sky patches of 60 or 90 degrees via MCMC sampling over many directions, to probe isotropy while limited by data distribution and lightcurve-derived uncertainties.
If this is right
- Apparent anisotropy directions vary across samples and methods because of statistical fluctuations from current sky coverage.
- The intrinsic limit prevents robust directional claims for H0 with existing large SNe Ia databases.
- Larger samples with improved systematics and uniform coverage are required to place reliable constraints on isotropy.
Where Pith is reading between the lines
- Earlier reports of specific anisotropy directions are likely artifacts of sampling rather than cosmological signals.
- Tests of the cosmological principle using supernova data must first correct for coverage biases before interpreting any preferred direction.
- Surveys that aim for even sky distribution will be needed to turn directional H0 measurements into decisive isotropy tests.
Load-bearing premise
The Region Fitting and Hemisphere Comparison methods can separate genuine directional changes in H0 from fluctuations caused by the present uneven sky distribution of supernovae and their measurement errors.
What would settle it
A large future supernova sample with nearly uniform sky coverage that yields the same anisotropy direction in both Region Fitting and Hemisphere Comparison analyses, even after tightening systematics, would falsify the claim.
Figures
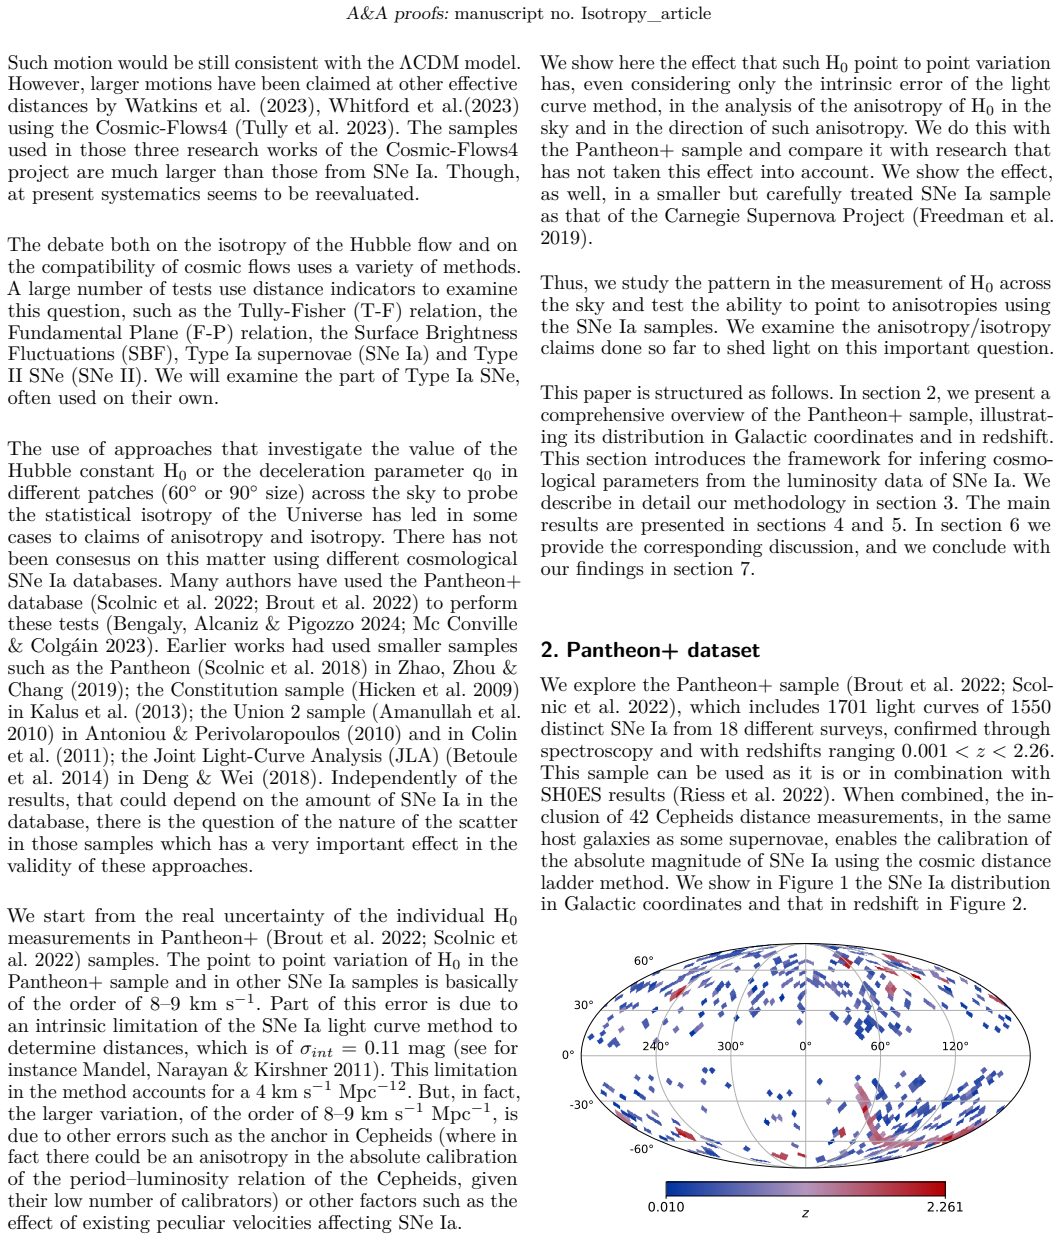


read the original abstract
The use of methods that investigate the value of the Hubble constant H$_0$ in different patches (60 $ or 90$^ size) across the sky to probe the statistical isotropy of the Universe using large SNe Ia databases has led to contradictory claims of either anisotropy or isotropy. The anisotropy directions vary amongst research works. The objective of this paper is to clarify the abovementioned claims and study the lack of basis for depicting directions of anisotropy with the present SNe Ia samples. We explain the type of limitation embedded in the SN Ia lightcurve method to determine the isotropy of H_0 and the corresponding consequences. The widely used analysis through the Region Fitting and the Hemisphere Comparison methods is done here using the Pantheon+ database, simulating 2000 distinct directions in the sky within a Bayesian Markov Chain Monte Carlo approach. We also study a smaller SNe Ia database, the Carnegie Supernova Project sample, leading to a similar kind of result as that from the Pantheon+ sample. We investigate the validity of the directions found for anisotropy within these analyses. We have found that within the tests used here, the Region Fitting method and the Hemisphere Comparison method, one can not determine with robustness the direction of an anisotropy of H$_0$ using the present SNe Ia large data samples. This is intrinsic to the way H$_0$ is obtained with the SN Ia lightcurve method. Achieving robust constraints will require a quite uniform sky coverage from larger SNe Ia samples with improved systematics.
Editorial analysis
A structured set of objections, weighed in public.
Referee Report
Summary. The paper analyzes claims of statistical anisotropy in the Hubble constant H0 derived from Type Ia supernovae by applying the Region Fitting and Hemisphere Comparison methods to the Pantheon+ catalog and the smaller Carnegie Supernova Project sample. Using Bayesian MCMC sampling over 2000 distinct sky directions, the authors simulate the effects of current sky coverage and measurement uncertainties and conclude that these standard directional tests cannot robustly recover anisotropy directions; any apparent directions are dominated by statistical fluctuations intrinsic to the SN Ia light-curve fitting procedure. They argue that substantially more uniform sky coverage from future larger samples will be required for reliable isotropy constraints.
Significance. If the central result holds, the work supplies a concrete methodological explanation for the contradictory anisotropy directions reported across the recent literature. The direct comparison of two independent public samples, the explicit MCMC exploration of many directions, and the reproduction of the same limitation in both datasets constitute a falsifiable demonstration that current SN Ia compilations are intrinsically limited for this class of test. This finding should temper interpretations of directional H0 variations and inform the design of next-generation surveys.
major comments (1)
- The manuscript demonstrates through simulations that statistical fluctuations from sky distribution and uncertainties dominate the recovered directions, but it would strengthen the central claim to include a quantitative metric (e.g., the fraction of MCMC realizations in which the recovered direction lies within 30° of the input direction) for both the isotropic and mildly anisotropic mock catalogs.
minor comments (2)
- Abstract, line 3: the notation '60 $ or 90$^ size' contains a clear typesetting error and should read '60° or 90° patches'.
- The description of the MCMC sampling (number of chains, convergence diagnostics, and prior choices on the directional parameters) is only summarized; a short appendix or subsection with these technical details would improve reproducibility.
Simulated Author's Rebuttal
We thank the referee for their positive assessment of our manuscript and for the constructive suggestion. We address the single major comment below.
read point-by-point responses
-
Referee: The manuscript demonstrates through simulations that statistical fluctuations from sky distribution and uncertainties dominate the recovered directions, but it would strengthen the central claim to include a quantitative metric (e.g., the fraction of MCMC realizations in which the recovered direction lies within 30° of the input direction) for both the isotropic and mildly anisotropic mock catalogs.
Authors: We agree that a quantitative metric of this type would strengthen the presentation of our results. In the revised manuscript we will add the fraction of MCMC realizations in which the recovered direction lies within 30° of the input direction, computed separately for the isotropic and mildly anisotropic mock catalogs. This will be reported in the sections describing the simulation results. revision: yes
Circularity Check
No significant circularity in derivation chain
full rationale
The paper applies the standard Region Fitting and Hemisphere Comparison methods via MCMC sampling over 2000 simulated directions to the external Pantheon+ and CSP supernova catalogs. Its central conclusion—that anisotropy directions in H0 cannot be robustly recovered due to intrinsic limits from the SN Ia lightcurve method and current sky coverage—follows directly from these simulations of statistical fluctuations and measurement uncertainties. No equations, fitted parameters, or self-citations are shown to reduce the result by construction to a quantity defined by the paper's own inputs. The analysis remains self-contained against external public data benchmarks without load-bearing reductions.
Axiom & Free-Parameter Ledger
axioms (1)
- domain assumption SN Ia light-curve distances can be treated as direction-independent standard candles for isotropy tests.
Reference graph
Works this paper leans on
-
[1]
2010, ApJ, 716, 712 Andrade,U., Bengaly, C.A.P., Santos, B., J
Amanullah, R., Lidman, C., Rubin, D., et al. 2010, ApJ, 716, 712 Andrade,U., Bengaly, C.A.P., Santos, B., J. S. & Alcaniz, J.S. 2018, ApJ, 865, 119
work page 2010
- [2]
-
[3]
2007, Stochastic Simulation: Algorithms and Analysis (Springer, New York, NY)
Asmussen, S., & Glynn, P.W. 2007, Stochastic Simulation: Algorithms and Analysis (Springer, New York, NY)
work page 2007
-
[4]
Bengaly, C.A.P., Alcaniz, J.S., & Pigozzo, C. 2024, PhRvD, 109, 123533
work page 2024
- [5]
- [6]
-
[7]
Camphuis, E., Quan, W., Balkenhof, L., et al. 2026, PhRvD, 113, 083504
work page 2026
- [8]
- [9]
-
[10]
2017, Numerical Methods for Engineers, 7th ed
Chapra, S.C. 2017, Numerical Methods for Engineers, 7th ed. (McGraw- Hill Education, New York, NY)
work page 2017
-
[11]
Colin, J., Mohayaee, R., Rameez, M., & Sarkar, S. 2019, A&A, 631, L13
work page 2019
-
[12]
2018, PhRvD, 97, 123515 Di Valentino, E., Levi Said, J., Riess, A.G., et al
Deng, H.-K., & Wei, H. 2018, PhRvD, 97, 123515 Di Valentino, E., Levi Said, J., Riess, A.G., et al. 2025, PDU, 49, 101965
work page 2018
-
[13]
Foreman-Mackey, D., Hogg, D.W., Lang, D., & Goodman, J. 2013, PASP, 125, 306C
work page 2013
- [14]
-
[15]
1996, Matrix Computations, 3rd ed
Golub, G.H., & Loan, C.F.V. 1996, Matrix Computations, 3rd ed. (Johns Hopkins University Press, Baltimore, MD)
work page 1996
-
[16]
Hamuy, M., Folatelli, G., Morrell, N.T., et al. 2006, PASP, 118, 2
work page 2006
- [17]
-
[18]
Hsiao, E.Y., Phillips, M.M., Marion, G.H., et al. 2019, PASP, 131, 014002
work page 2019
- [19]
-
[20]
Javanmardi, B., Porciani, C., Kroupa, P., & Pflamm-Altenburg, J. 2015, ApJ, 810, 47
work page 2015
-
[21]
2014, Applied Multivariate Statistical Analysis, 6th ed
Johnson, R.A., & Wichern, D.W. 2014, Applied Multivariate Statistical Analysis, 6th ed. (Pearson, Upper Saddle River, NJ)
work page 2014
-
[22]
Kalus, B., Schwarz, D.J., Seikel, M., & Wiegand, A. 2013, A&A, 553, A56
work page 2013
-
[23]
Kazantzidis, L., & Perivolaropoulos, I. 2020, PhRvD, 102, 023520
work page 2020
-
[24]
GetDist: a Python package for analysing Monte Carlo samples
Lewis, A. 2019, arXiv e-prints, arXiv:1910.13970
work page internal anchor Pith review Pith/arXiv arXiv 2019
-
[25]
Lin, H.-N., Wang, S., Chang, Z., & Li, X. 2016, MNRAS, 456, 1881
work page 2016
- [26]
- [27]
- [28]
-
[29]
Murakami, Y., Riess, A.G, Stahl, B.E., et al. 2023, JCAP, 2023, 046
work page 2023
-
[30]
Nikakhtar, F., Ayromlou, M., Baghram, S., et al. 2018, MNRAS, 478, 5296
work page 2018
-
[31]
Perlmutter, S., Aldering, G., Goldhaber, G., et al. 1999, ApJ, 517, 565
work page 1999
-
[32]
Peterson, E.R., Kenworthy, D.W., Scolnic, D., et al. 2022, ApJ, 938, 112
work page 2022
-
[33]
Phillips, M.M., Contreras, C., Hsiao, E.Y., et al. 2019, PASP, 131, 014001
work page 2019
-
[34]
Riess, A.G., Filippenko, A.V, Challis, P., et al. 1998, AJ, 116, 1009
work page 1998
- [35]
- [36]
-
[37]
"SNe Ia twins" in the Hubble flow, and the determination of H0
Pastorello, A. 2025, arXiv e-prints, arXiv:2512.02391
work page internal anchor Pith review Pith/arXiv arXiv 2025
- [38]
- [39]
- [40]
- [41]
- [42]
-
[43]
Tsagas, C.G., Perivolaropoulos, L., & Asvesta, K. 2026, PhR, 1178, 1
work page 2026
-
[44]
Tully, R.B., Kourkchi, E., Courtois, H.M., et al. 2023, ApJ, 944, 94
work page 2023
-
[45]
Uddin, S.A., Burns, C.R., Phillips, M.M., et al. 2024, ApJ, 970, 72
work page 2024
- [46]
-
[47]
Watkins, R., & Feldman, H.A. 2025, arXiv e-prints, arXiv:2512.03168
-
[48]
Whitford, A.M., Howlett, C., & Davis, T.M. 2023, MNRAS, 526, 3051
work page 2023
- [49]
- [50]
-
[51]
2025, arXiv e-prints, arXiv:2506.14878
Zhou, A.J., Dodelson, S., & Scolnic, D. 2025, arXiv e-prints, arXiv:2506.14878
-
[52]
2015, A&C, 12, 45 Article number, page 12
Zuntz, J., Paterno, M., & Jennings, E. 2015, A&C, 12, 45 Article number, page 12
work page 2015
discussion (0)
Sign in with ORCID, Apple, or X to comment. Anyone can read and Pith papers without signing in.