REVIEW 3 major objections 4 minor 22 references
Spatial Distributions of Sunspot Oscillation Modes at Different Temperatures
T0 review · 3 major / 4 minor · reviewed 2026-08-14 · deepseek-v4-flash
Pith's one-line read Sunspot five-minute oscillations form an expanding ring that disappears in the hotter corona, while three-minute oscillations gather in the umbra and at coronal loop footpoints.
desk verdict A competent confirmation study whose only genuinely new claim—suppression of five-minute oscillations in the high corona—is weakened by per-pixel significance testing without multiple-comparison correction. read the letter →
The pith
A machine-rendered reading of the paper's core claim, the machinery that carries it, and where it could break.
The reading
What carries the argument
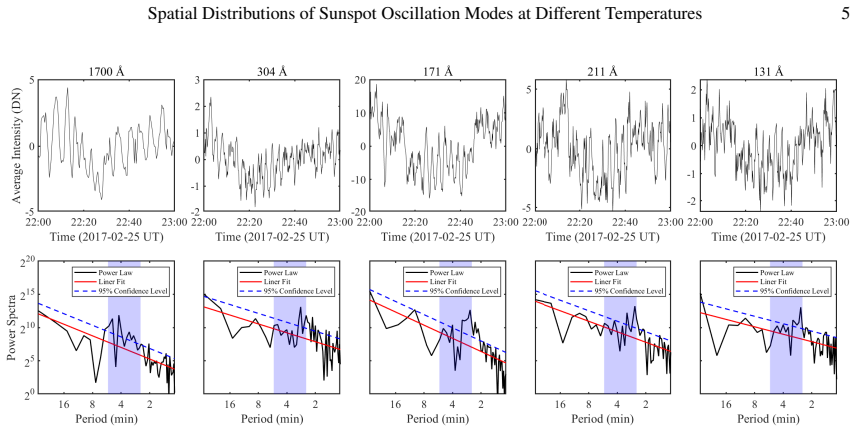
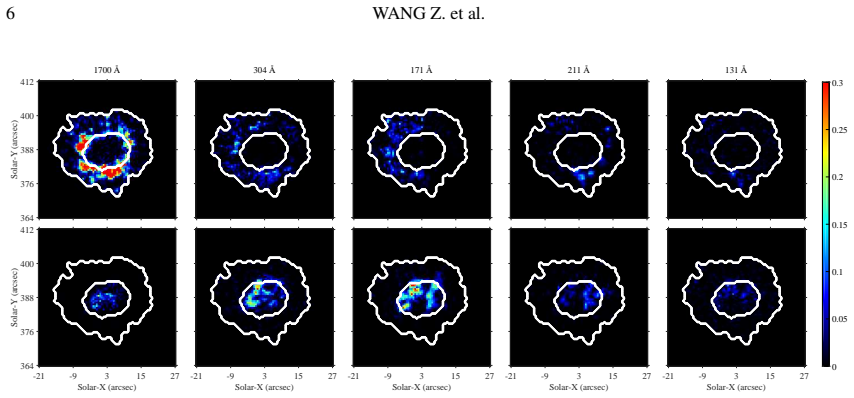
Per-pixel fast Fourier transform (FFT) power spectra normalized by intensity variance; each log-log spectrum is fitted with a linear red-noise model, and a chi-square 95% confidence level is used to select significant peaks. Power in two frequency bands, 1 mHz wide and centered at 3.3 mHz for five-minute oscillations and 5.6 mHz for three-minute oscillations, is summed to make power maps. The maps are overlaid on umbral and penumbral boundaries derived from 1700 Å intensity thresholds, allowing the paper to convert thousands of individual spectra into spatial maps of where each oscillation mode is significant at each temperature.
What would settle it
Count false positives by re-running the same per-pixel test on shuffled light curves or by applying a false-discovery-rate correction; if the high-corona maps still show as many significant pixels with no spatial organization, the claimed five-minute suppression is not established and the disordered maps are plausibly pure noise.
Extended reading notes
Core claim
Across six sunspots observed in five AIA channels spanning temperatures from about 0.6 × $10^{4}$ K to $10^{7}$ K, the paper finds that five-minute oscillation power forms a circle around the umbra-penumbra boundary in the temperature minimum, expands outward through the transition region and lower corona, and becomes disordered and largely absent in the higher corona, as seen in the 211 Å and 131 Å channels. The paper interprets this as temperature-dependent suppression of five-minute oscillations in high-temperature plasma. Three-minute oscillation power remains mostly inside the umbra up to the lower corona, with part of it appearing along coronal fan structures; the strongest patches sit near coronal loop footpoints. The paper concludes that three-minute oscillations can propagate along fan loops and that the two modes have distinct, temperature-stratified spatial distributions.
Load-bearing premise
The load-bearing premise is that a per-pixel 95% chi-square confidence test on red-noise-fitted power spectra identifies genuine oscillation modes even though thousands of pixels are tested without multiple-comparison correction.
Editorial extensions
If this is right
- Five-minute sunspot oscillations occupy a ring-shaped wave zone that expands with height and fades in million-degree plasma, so models must explain both the outward drift and the disappearance.
- Three-minute oscillations can carry wave power from the umbra into coronal fan structures, with enhanced deposition near loop footpoints.
- The umbra-penumbra split, with three-minute power under the umbra and five-minute power at the boundary, constrains where each mode is generated or converted.
- The five AIA channels provide a temperature ladder against which future high-resolution observations can test how the ring radius and suppression height vary from sunspot to sunspot.
Reading between the lines
- A testable extension is to overlay the power maps on co-temporal photospheric magnetograms: if the high-power coronal patches really mark loop footpoints, they should coincide with strong inclined-field footpoints rather than with random bright pixels.
- The same per-pixel pipeline applied to pores and plage would separate a penumbra-specific ring mechanism from a generic temperature effect, since those structures lack a penumbra.
- If the high-corona suppression is a genuine wave cutoff, it should appear as a frequency-dependent effect in Doppler data: five-minute power should fade before three-minute power as temperature rises, a prediction that simultaneous spectral observations could check.
Signed reviews
Editorial analysis
A structured set of objections, weighed in public.
Referee Report
Summary. The manuscript analyzes one-hour SDO/AIA observations of six sunspots in five channels (1700, 304, 171, 211, and 131 Å) to map the spatial distribution of three- and five-minute oscillations. For each pixel it fits a power-law red-noise model to the log-log FFT spectrum, flags bins above a 95% chi-square confidence level, and sums the flagged power in 1 mHz bands centered at 3.3 and 5.6 mHz (Section 4). The authors report that five-minute power forms a circle near the umbra/penumbra boundary at low temperatures, expands outward to the lower corona, and becomes spatially disordered or disappears in 211 and 131 Å; they interpret this as suppression in the high-temperature corona. Three-minute power is mostly umbral at low temperatures and partly follows coronal fan structures with high power at loop footpoints.
Significance. The topic is timely and the use of six sunspots across five AIA channels is a useful observational extension of previous work, particularly the confirmation of Kolobov et al. (2016) for the low-atmosphere expansion. If the high-corona suppression of five-minute oscillations and the loop-footpoint concentration of three-minute oscillations can be placed on solid statistical footing, the results would be a valuable constraint on wave propagation models. The paper is clearly written and the data processing is reproducible in principle, but the statistical support for the central high-corona null result is currently incomplete.
major comments (3)
- [Section 4, step 3] The per-pixel 95% confidence test is applied independently to every pixel, but no multiple-comparison correction is reported. With one-hour 12 s cadence data, the 3.3 mHz band contains roughly three to four independent Fourier bins, so a pure red-noise pixel has about 1 - 0.95^4 ≈ 18% chance of containing at least one flagged bin; over an 80×80-pixel map this predicts of order 10^3 flagged pixels by chance. The sparse, disordered patterns seen in the 211 and 131 Å panels of Figure 3 are exactly what such false positives would look like. Therefore the conclusion in Sections 4.1 and 5 that five-minute oscillations are suppressed in the high-temperature corona is not established unless a false-discovery-rate or family-wise correction is applied and the spatial coherence of the detections is quantified.
- [Section 4.1] Treating the absence of significant power as physical suppression requires a sensitivity calibration for each channel. The paper does not provide detection limits for 211 and 131 Å, an injection-recovery test, or error bars on the power maps. Consequently the comparison between low- and high-corona maps cannot separate "oscillations are suppressed" from "oscillations are present but below the detection threshold of this method." This concern is load-bearing because the high-corona suppression is a central claim repeated in the abstract and Section 5.
- [Section 3] The umbra/penumbra boundary is defined by "an intensity threshold" on the 1700 Å image, but the threshold value, the region over which it is applied, and the sensitivity of the boundaries to the threshold are not given. All spatial claims—circle at the umbral boundary, expansion to the penumbral boundary, and power within the umbra—depend on these boundaries, so the procedure should be specified and a robustness test should be included.
minor comments (4)
- [Figures 3-5] Only three of the six sunspots appear in the figures (NOAA 12638 in Figure 3, NOAA 11176 in Figure 4, and NOAA 11479 in Figure 5); the claims for the remaining spots rest on unreferenced textual statements.
- [Figure 1 and Section 4] The text refers to the blue shadow in Figure 1 as a period range of 2.5 to 5.5 minutes, but the power maps use 3.3 and 5.6 mHz centers; the relationship between these ranges should be clarified.
- [Section 2] The cadence difference between 1700 Å (24 s) and the other channels (12 s) is not discussed in relation to frequency resolution and red-noise fitting; this could affect the comparability of the power maps.
- [Throughout] There are several grammatical issues, for example "the circle-shape is disappeared" and "the powers with three-minute also appear to be a decrease trend"; a language edit would improve readability.
Circularity Check
No significant circularity: the paper is an observational analysis whose conclusions are inferred from power maps, not derived from inputs that already contain them.
full rationale
This is an observational study, not a derivation. The spatial-distribution claims are obtained by a standard data-reduction pipeline: FFT power spectra of per-pixel light curves, linear fits to log-log spectra to model red noise, 95% chi-square significance thresholds, and summing significant power in 3.3 and 5.6 mHz bands. None of these steps is a fitted theory parameter, and the paper does not assume the spatial distribution it reports. The red-noise fit is used generically to suppress background power before mapping, which is a data-cleaning step and not an input that contains the circle-shape or suppression conclusions. The paper's main comparisons are against prior observational results (e.g., Kolobov et al. 2016), which are external, and the new six-sunspot sample provides independent evidence. The only substantive concern is statistical: applying per-pixel 95% chi-square tests without multiple-comparison correction may admit false positives in the higher-corona channels, weakening the claim that five-minute power is suppressed. That is a correctness or statistical-rigor issue, not circularity, because the threshold is not chosen to force the qualitative result and the low-atmosphere circle-shape maps are spatially coherent far above the per-pixel false-positive rate. No self-definitional, fitted-input-renamed-as-prediction, or self-citation load-bearing step is present. Circularity score is therefore 0.
Assumptions & free parameters
free parameters (2)
- Oscillation frequency bands =
3.3 mHz and 5.6 mHz centers, 1 mHz bandwidth
- Umbra/penumbra boundary intensity threshold =
Not specified in paper
assumptions (3)
- domain assumption AIA intensity fluctuations in a given channel trace oscillations of plasma at that channel's characteristic temperature.
- domain assumption Log-log power spectra of AIA intensity curves follow a linear red-noise model, and deviations above the 95% chi-square level identify true oscillation modes.
- domain assumption The six observed sunspots are a random, representative sample of sunspots.
Cite this review
Pith. "Pith review of Spatial Distributions of Sunspot Oscillation Modes at Different Temperatures." pith.science (2026). https://pith.science/paper/HYUBOVN5
@misc{pith2026190804906,
  author       = {Pith},
  title        = {Pith review of: Spatial Distributions of Sunspot Oscillation Modes at Different Temperatures},
  year         = {2026},
  howpublished = {\url{https://pith.science/paper/HYUBOVN5}},
  note         = {Machine review of arXiv:1908.04906}
}
read the original abstract
Three- and five-minute oscillations of sunspots have different spatial distributions in the solar atmospheric layers. The spatial distributions are crucial to reveal the physical origin of sunspot oscillations and to investigate their propagation. In this study, six sunspots observed by Solar Dynamics Observatory/Atmospheric Imaging Assembly were used to obtain the spatial distributions of three- and five-minute oscillations. The fast Fourier transform method is applied to represent the power spectra of oscillation modes. We find that, from the temperature minimum to the lower corona, the powers of the five-minute oscillation exhibit a circle-shape distribution around its umbra, and the shapes gradually expand with temperature increase. However, the circle-shape is disappeared and the powers of the oscillations appear to be very disordered in the higher corona. This indicates that the five-minute oscillation can be suppressed in the high-temperature region. For the three-minute oscillations, from the temperature minimum to the high corona, their powers mostly distribute within an umbra, and part of them locate at the coronal fan loop structures. Moreover, those relative higher powers are mostly concentrated in the position of coronal loop footpoints.
Figures

Figures from the paper (2 more)


Reference graph
Works this paper leans on
- [1]
- [2]
-
[3]
Bhatnagar, A., Livingston, W . C., & Harvey, J. W . 1972, Sol. Phys., 27, 80
work page 1972
- [4]
-
[5]
Bogdan, T. J., & Judge, P . G. 2006, Philosophical Transactio ns of the Royal Society of London Series A, 364, 313 De Moortel, I., Ireland, J., Hood, A. W ., & Walsh, R. W . 2002, A&A, 387, L13 De Moortel, I., & Nakariakov, V . M. 2012, Philosophical Tran sactions of the Royal Society of London Series A, 370, 3193
work page 2006
- [6]
-
[7]
Giovanelli, R. G. 1972, Sol. Phys., 27, 71
work page 1972
-
[8]
Ireland, J., McAteer, R. T. J., & Inglis, A. R. 2015, ApJ, 798, 1
work page 2015
Show all 22 references
-
[9]
B., De Moortel, I., Mathioudakis, M., et al
Jess, D. B., De Moortel, I., Mathioudakis, M., et al. 2012, Ap J, 757, 160
2012
-
[10]
B., Morton, R
Jess, D. B., Morton, R. J., V erth, G., et al. 2015, Space Sci. R ev., 190, 103
2015
-
[11]
I., Chelpanov, A
Kobanov, N. I., Chelpanov, A. A., & Kolobov, D. Y . 2013, A&A, 5 54, A146
2013
-
[12]
I., Kolobov, D
Kobanov, N. I., Kolobov, D. Y ., Chupin, S. A., & Nakariakov, V. M. 2011, A&A, 525, A41
2011
-
[13]
Y ., Chelpanov, A
Kolobov, D. Y ., Chelpanov, A. A., & Kobanov, N. I. 2016, Sol. P hys., 291, 3339
2016
-
[14]
R., Title, A
Lemen, J. R., Title, A. M., Akin, D. J., et al. 2012, Sol. Phys. , 275, 17 10 W ANG Z. et al
2012
-
[15]
Lites, B. W . 1992, in NA TO Advanced Science Institutes (ASI)Series C, V ol. 375, NA TO Advanced Science Institutes (ASI) Series C, ed. J. H. Thomas & N. O. Weiss, 261
1992
-
[16]
W ., White, O
Lites, B. W ., White, O. R., & Packman, D. 1982, ApJ, 253, 386
1982
-
[17]
A., V azquez, M., & Garcia de La R osa, J
Marco, E., Aballe Villero, M. A., V azquez, M., & Garcia de La R osa, J. I. 1996, A&A, 309, 284
1996
-
[18]
G., et al
Nagashima, K., Sekii, T., Kosovichev, A. G., et al. 2007, P ASJ, 59, S631 O’Shea, E., Muglach, K., & Fleck, B. 2002, A&A, 387, 642
2007
-
[19]
D., Thompson, B
Pesnell, W . D., Thompson, B. J., & Chamberlin, P . C. 2012, Sol. Phys., 275, 3
2012
-
[20]
E., & Shibasaki, K
Reznikova, V . E., & Shibasaki, K. 2012, ApJ, 756, 35 Rouppe van der V oort, L. H. M., Rutten, R. J., S¨ utterlin, P .,Sloover, P . J., & Krijger, J. M. 2003, A&A, 403, 277
2012
-
[21]
Solanki, S. K. 2003, A&A Rev., 11, 153
2003
-
[22]
A., & Nakariakov, V
Sych, R. A., & Nakariakov, V . M. 2008, Sol. Phys., 248, 395 V aughan, S. 2005, A&A, 431, 391 Y uan, D. 2015, Research in Astronomy and Astrophysics, 15, 1 449 Y uan, D., & Nakariakov, V . M. 2012, A&A, 543, A9
2008
Reviewed August 14, 2026 · model on record in the stance chip above.
Discussion (0). Continue with ORCID to comment.