REVIEW 3 major objections 5 minor 82 references
A mathematical model describing the localization and spread of influenza A virus infection within the human respiratory tract
T0 review · 3 major / 5 minor · reviewed 2026-08-14 · deepseek-v4-flash
Pith's one-line read Upward mucus flow in the airways, not random diffusion, determines where influenza A infection spreads, confining it above the depth of initial virus deposition.
desk verdict A useful spatial extension of the standard IAV target-cell model showing advection dominates and yields apparent downward spread, but the 'no spread below deposition depth' claim rests on an untested molecular-diffusion-only transport assumption. read the letter →
The pith
A machine-rendered reading of the paper's core claim, the machinery that carries it, and where it could break.
The reading
What carries the argument
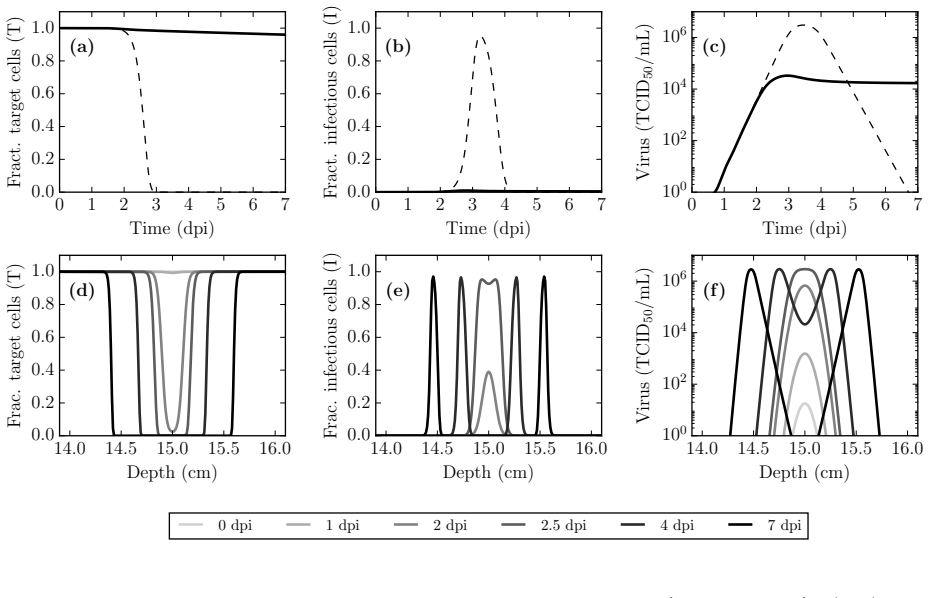
The load-bearing object is a one-dimensional advection-diffusion equation for virus concentration in the periciliary fluid, coupled to a spatially distributed target-cell--eclipse--infectious-cell infection model. The tract runs from the nose ($x=0$) to a depth of 30 cm; virus diffuses with coefficient $D_{\mathrm{PCF}}$ and is advected upward at speed $v_a$, with an absorbing top and a reflective bottom. Infection starts as a Gaussian inoculum at depth $x_d$. The advection term is the mechanism that changes the model's behaviour: at $v_a=40\ \mu\mathrm{m/s}$, a virion would traverse the 30 cm tract in about 12 minutes unless it infects a cell first, so upward transport dominates viral spread and confines infection above the deposition site.
What would settle it
Measure the effective spread of inert fluorescent particles or virus-sized tracers deposited at a known depth in the airway surface liquid of living airway epithelium: if observed dispersion exceeds $D_{\mathrm{PCF}}=10^{-12}\ \mathrm{m^2/s}$ by orders of magnitude, or if tracers move downward against the mucus flow, the confinement prediction fails. Alternatively, imaging infection initiated from a single well-localized deposit and finding infected cells below the deposit depth would contradict the claim.
Extended reading notes
Core claim
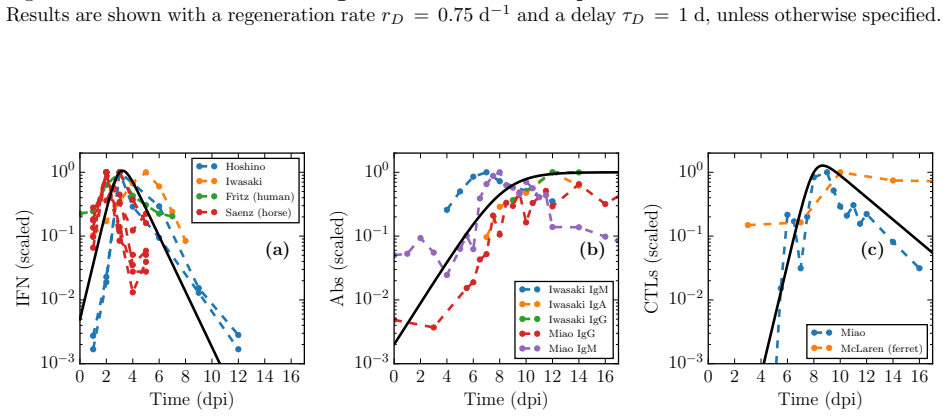
The central claim is that upward advection of the periciliary fluid is the dominant transport mechanism for influenza A virus in the respiratory tract and acts as a physiological barrier to downward dissemination. When both diffusion ($D_{\mathrm{PCF}}=10^{-12}\ \mathrm{m^2/s}$) and advection ($v_a=40\ \mu\mathrm{m/s}$) are included in a one-dimensional spatial model, infection remains confined to depths at or above the initial deposition site, with no target-cell consumption below it. Since virions released by infected cells are carried upward, cells higher in the tract are exposed to more virus and progress through infection faster; the resulting gradient in infection timing creates an illusion of downward spread. The paper further claims that fitting this spatial picture to the timing of influenza virus shedding requires a virus production rate around 11 times that fitted by a non-spatial model, and that including target-cell regeneration and simplified interferon, antibody, and cytotoxic-T-lymphocyte responses lets the model capture the time courses of seasonal and avian influenza infections and their response to neuraminidase inhibitors.
Load-bearing premise
The confinement result rests on treating the periciliary fluid as quiescent apart from a uniform 40 µm/s upward flow and molecular diffusion of $10^{-12}\ \mathrm{m^2/s}$, with infection starting from a single localized droplet; if additional mixing is substantial or deposition is more distributed, the predicted barrier to downward spread may not hold.
Editorial extensions
If this is right
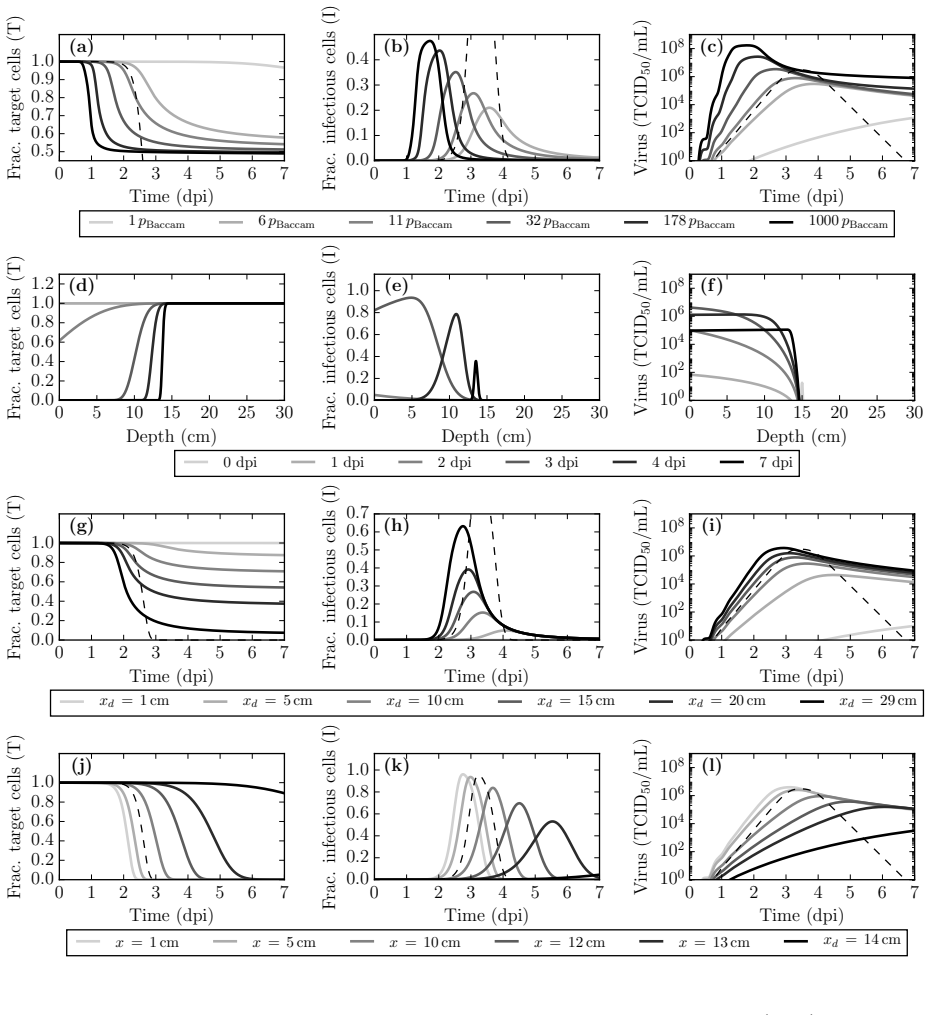
- If advection dominates, the depth of initial virus deposition largely determines the extent of respiratory-tract involvement: depositions higher than about 15 cm give lower and later viral peaks, while deeper depositions change little.
- Non-spatial models fitted to viral-titer data would underestimate the true virus production rate, and therefore the rate at which mutations, including drug-resistance mutations, are generated.
- The apparent downward progression of infection seen in imaging studies is reinterpreted as a timing illusion caused by the mucus escalator, not as actual directional spread.
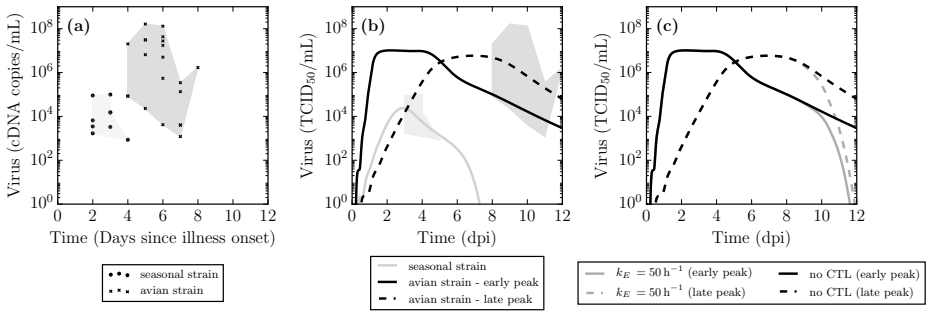
- Neuraminidase inhibitor treatment is predicted to be most effective when started early for seasonal-strain infections, but for a slowly peaking avian-strain course even delayed treatment can still substantially reduce viral load.
Reading between the lines
- If effective dispersion in the periciliary fluid is much larger than molecular diffusion (from ciliary beating, coughing, or mucus heterogeneity), the predicted barrier to downward dissemination would weaken; this is testable with particle-tracking experiments.
- The 10-fold production-rate correction implies that the within-host supply of viral mutants, and thus the probability of resistance emergence, may be substantially larger than well-mixed model estimates.
- The same advection-confinement logic could apply to other respiratory viruses that replicate in the airway surface liquid, and to multi-drop deposition, where the confinement boundary would be set by the deepest droplet rather than a single inoculum.
- High-resolution spatiotemporal imaging of a single localized influenza infection could distinguish the model's predicted stationary, confined infection from true downward spread.
Signed reviews
Editorial analysis
A structured set of objections, weighed in public.
Referee Report
Summary. This paper develops a one-dimensional partial differential equation model of influenza A virus infection in the human respiratory tract (HRT), coupling a standard target-cell–eclipse–infectious–virus kinetic scheme with diffusion of virions in the periciliary fluid (PCF) and upward advection driven by the mucociliary escalator. The model is used to study how these spatial transport processes alter infection kinetics and localization. The main claims are that advection dominates over molecular diffusion, that advection prevents infection from disseminating below the depth of initial virus deposition, and that the apparent downward spread of infection is an artifact of faster kinetics in the upper (downstream) airway. The model is then extended with target-cell regeneration and empirical immune-response components (IFN, antibodies, CTLs), and applied to construct hypothetical time courses for seasonal and avian H5N1 influenza infections and to evaluate neuraminidase inhibitor therapy.
Significance. If the central claims are sustained, the model offers a mechanistic explanation for spatial patterns of influenza infection, suggests that non-spatial models may underestimate the virus production rate, and provides a modular platform for exploring antiviral interventions. The paper is clearly written, the numerical implementation is explicitly described, and the spatial results follow from the stated equations. Its main strengths are the transparent formulation and the demonstration that adding just two spatial parameters can generate qualitatively novel infection kinetics, including the apparent reversed direction of spread. However, the significance is conditional: the localization prediction rests on a single assumed value of the PCF diffusion coefficient with no sensitivity analysis, and the seasonal/avian and immune-response portraits are based on hand-fitted empirical curves and parameter shifts rather than inference from data. The platform is a useful contribution, but the quantitative claims go beyond what the current evidence supports.
major comments (3)
- [Section 2.2, Table 1, Eq. (1)] The central claim that advection prevents infection from disseminating below the deposition depth is load-bearing but is not robustly established, because the only downward transport mechanism in the model is molecular diffusion with DPCF = 10^-12 m^2/s, and no sensitivity analysis over this parameter is provided. The comparison in Figure 4(c) shows only that molecular diffusion is negligible relative to advection at the chosen value of DPCF; it does not bound the effect of physiologically plausible enhanced dispersion from ciliary beating, cough-induced flows, surface tension gradients, or airway geometry. The authors should either estimate an effective axial dispersion coefficient for the PCF in vivo or demonstrate that the qualitative conclusion persists for effective dispersion coefficients up to at least 10^-10 m^2/s, for which the 7-day diffusive length scale is about 1 cm and could seed infection below the deposition site. Without such an analysis, the 'no spread below xd' prediction is a direct consequence of the assumed transport parameters rather than a demonstrated physiological property.
- [Section 2.2, p = 11×pBaccam] The '10-fold increase' in the virus production rate is a calibration, not a prediction: the value p = 11×pBaccam is selected so that the spatial model with advection reproduces the 2–3 dpi viral titer peak of the non-spatial Baccam model. The subsequent claim that non-spatial models underestimate the virus production rate is therefore contingent on the chosen target peak time and on the assumed values of DPCF and va. The authors should explicitly state that this is a fitting procedure and should provide a sensitivity analysis showing how the inferred p changes when DPCF or va is varied over a plausible range. The current presentation, which lists p as a fixed parameter in Table 1, risks being read as a model prediction rather than a fitted quantity.
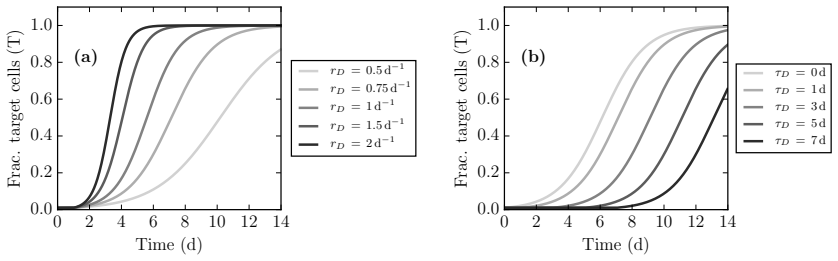
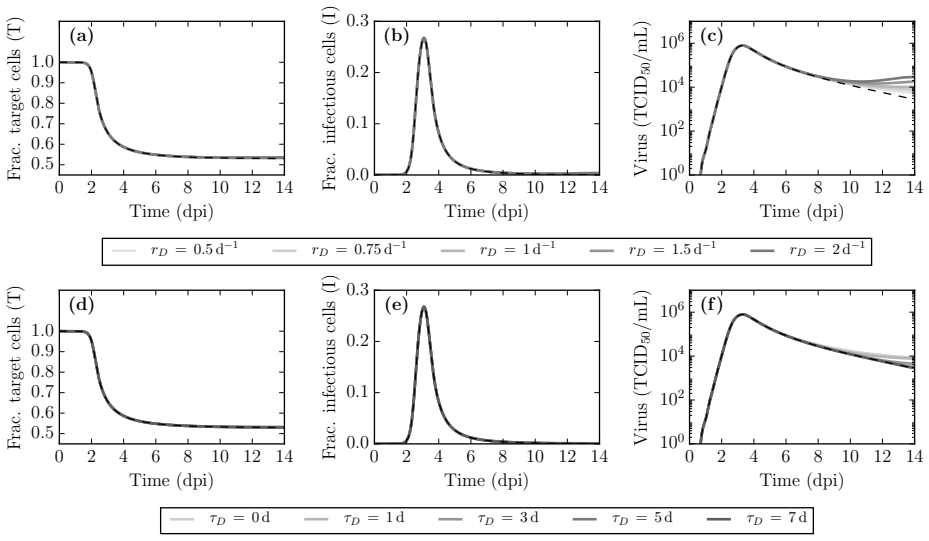
- [Section 2.5, Table 2, Figure 10, and Section 2.4, Figure 7] The seasonal and avian infection 'portraits' are constructed by manually shifting parameters to match pre-specified, hypothesized time courses, and the immune response components are empirical curves whose parameters are chosen by eye to match experimental data in Figure 7. Consequently, the statements that the model 'can capture' these infections, and the subsequent predictions about NAI treatment efficacy in Section 2.5, Figure 11 and Table 3, are demonstrations of model expressiveness under assumed parameter sets rather than validated quantitative predictions. The authors should reframe these sections to make the conditional nature explicit, and ideally perform a sensitivity analysis over the shifted parameters (β, p, τE, τI, f50, A0, kC) to identify which parameter changes drive the different infection outcomes. The current narrative overstates the support for the seasonal-versus-avian conclusions.
minor comments (5)
- [Abstract and Section 2.2] The abstract states a '10-fold increase' in the virus production rate, while the text and Table 1 use 11×pBaccam; please make these consistent.
- [Figure 4] The axis labels in panel (b) contain '10□2' and '10□1', which appear to be a rendering artifact; they should be formatted as superscripts.
- [Section 7.1] The boundary conditions are described inconsistently: a reflective boundary condition is used for the diffusion step at the bottom of the HRT (V_{Nx+1} = V_{Nx}), whereas the advection step sets V_{Nx} = 0, i.e., no virus beyond the end of the HRT. The authors should clarify the combined boundary treatment or note explicitly that the bottom boundary is not physically relevant once advection is present.
- [Section 2.1 and Table 1] The model assumes a uniform advection speed and constant diffusion coefficient along the entire 30 cm HRT, but the nose, trachea, and bronchi have very different mucus properties and geometry. This simplification is not discussed in the limitations; a sentence acknowledging it would be helpful.
- [Section 7.3] The paper does not mention the availability of simulation code or data. Providing the code would improve reproducibility, as the numerical scheme involves a nontrivial operator-splitting approach with specific time-step constraints.
Circularity Check
Virus-production '10-fold increase' is a calibrated input presented as a model requirement; the central advection/localization result is an independent model output.
-
fitted input called prediction
[Section 2.2 (p. 4), Abstract (p. 1), Discussion (p. 17)]
"Increasing the virus production rate to 11 ×pBaccam yields an infection that peaks at ∼ 3 dpi. This adjusted value for the virus production rate ( p = 11×pBaccam, see Table 1) is used in the remainder of this work so that the spatial MM qualitatively reproduces the approximate timing of viral titer peak in an IAV infection. ... When IAV advection and diffusion are both considered, the former is found to dominate infection kinetics, and a 10-fold increase in the virus production rate is required to counter its effects."
The 11×pBaccam (about 10-fold) value is not derived from the model; it is set by hand so that the spatially averaged viral titer peaks at about 3 dpi, matching Baccam et al. The abstract and discussion then report the same value as a model-imposed requirement ('a 10-fold increase ... is required to counter its effects'). Thus the 'requirement' is the calibration input renamed as a prediction. This does not make the spatial-localization result circular, because the no-spread-below-xd behaviour is a separate computed output of the advection-diffusion equation, but a headline quantitative claim is a fitted input presented as a finding.
full rationale
The paper's main localization claim is not circular. Eq. (1) is a standard advection-diffusion PDE with independent transport terms (DPCF and va from Table 1), and the no-spread-below-xd result is computed from those terms plus the localized Gaussian inoculum; it is not imposed by the boundary conditions (reflective at bottom, absorbing at top) or by an assumed no-below-xd condition. The apparent downward infection wave is likewise an emergent, spatially resolved output, not an input. The one significant circularity is the 10-fold virus-production increase: Table 1 sets p = 11×pBaccam, chosen explicitly so that the spatially averaged titer peaks at ~3 dpi, and the abstract/discussion then report that a 10-fold increase 'is required' to counter advection. That is a fitted calibration renamed as a prediction. The avian-strain and immune-response parameter shifts are also hand chosen to reproduce stated target time courses, but the paper frames them as constructed portraits and consistency checks rather than as independent predictions, so they are not counted as additional circular steps. Self-citations (Baccam baseline parameters, Holder diffusion estimate, etc.) provide parameter values from prior fitted or physical estimates and are not used as a uniqueness theorem; they are not load-bearing circularity. Overall score 5: partial circularity in a secondary headline claim, while the central spatial-localization result remains an independent model consequence.
Assumptions & free parameters
free parameters (8)
- p (virus production rate) =
8.4 x 10^6 (TCID50/mL)/h, 11x p_Baccam
- tau_E (eclipse duration) =
8 h
- tau_I (infectious cell lifespan) =
20 h
- rD (regeneration rate) =
0.75 d^-1
- tau_D (regeneration delay) =
1 d
- f50 (IFN resistance) =
0.5 (seasonal), 5.0 (avian)
- kA (antibody neutralization rate) and A0 (initial antibody amount) =
kA = 500 h^-1; A0 = 2e-3 (seasonal), 1e-5 (avian)
- kC (CTL killing rate) =
50 h^-1 (seasonal), 0 (avian portraits)
assumptions (5)
- domain assumption Target-cell model structure: cells are infected at rate beta*T*V, pass through staged eclipse and infectious phases, and produce virus at rate p until cleared.
- domain assumption Virus in the PCF is transported only by molecular diffusion (DPCF = 10^-12 m^2/s) and uniform upward advection (va = 40 um/s); all other mixing and virus-mucus interactions are captured by a single exponential clearance c.
- domain assumption The HRT is a uniform one-dimensional track from x = 0 (nose) to x = 30 cm with no anatomical heterogeneity in cell types, clearance rates, or transport speeds.
- domain assumption Boundary conditions: absorbing at the top of the HRT and reflective (or zero flux) at the bottom, with advection making the bottom boundary irrelevant in the advection case.
- domain assumption Initial infection is a spatially localized Gaussian inoculum with sigma = 0.5 mm, deposited at a single depth xd.
Cite this review
Pith. "Pith review of A mathematical model describing the localization and spread of influenza A virus infection within the human respiratory tract." pith.science (2026). https://pith.science/paper/IJJFOE7C
@misc{pith2026190808482,
  author       = {Pith},
  title        = {Pith review of: A mathematical model describing the localization and spread of influenza A virus infection within the human respiratory tract},
  year         = {2026},
  howpublished = {\url{https://pith.science/paper/IJJFOE7C}},
  note         = {Machine review of arXiv:1908.08482}
}
read the original abstract
Within the human respiratory tract (HRT), viruses diffuse through the periciliary fluid (PCF) bathing the epithelium, and travel upwards via advection towards the nose and mouth, as the mucus escalator entrains the PCF. While many mathematical models (MMs) to date have described the course of influenza A virus (IAV) infections in vivo, none have considered the impact of both diffusion and advection on the kinetics and localization of the infection. The MM herein represents the HRT as a one-dimensional track extending from the nose down to a depth of 30 cm, wherein stationary cells interact with the concentration of IAV which move along within the PCF. When IAV advection and diffusion are both considered, the former is found to dominate infection kinetics, and a 10-fold increase in the virus production rate is required to counter its effects. The MM predicts that advection prevents infection from disseminating below the depth at which virus first deposits. Because virus is entrained upwards, the upper HRT sees the most virus, whereas the lower HRT sees far less. As such, infection peaks and resolves faster in the upper than in the lower HRT, making it appear as though infection progresses from the upper towards the lower HRT. When the spatial MM is expanded to include cellular regeneration and an immune response, it can capture the time course of infection with a seasonal and an avian IAV strain by shifting parameters in a manner consistent with what is expected to differ between these two types of infection. The impact of antiviral therapy with neuraminidase inhibitors was also investigated. This new MM offers a convenient and unique platform from which to study the localization and spread of respiratory viral infections within the HRT.
Figures

Figures from the paper (8 more)




Reference graph
Works this paper leans on
-
[1]
P. Baccam, C. Beauchemin, C. A. Macken, F. G. Hayden, and A. S. Perelson. Kinetics of influenza A virus infection in humans. J. Virol., 80(15):7590–7599, 2 August 2006. doi:10.1128/JVI.01623-05
-
[2]
S. Balasingam and A. Wilder-Smith. Randomized controlled trials for influenza drugs and vaccines: A review of controlled human infection studies. Int. J. Infect. Dis. , 49:18–29, August 2016. doi: 10.1016/j.ijid.2016.05.013
-
[3]
Barroso, J
L. Barroso, J. Treanor, L. Gubareva, and F. G. Hayden. Efficacy and tolerability of the oral neu- raminidase inhibitor peramivir in experimental human influenza: Randomized, controlled trials for prophylaxis and treatment. Antivir. Ther., 10(8):901–910, 2005
2005
-
[4]
A. L. Bauer, C. A. A. Beauchemin, and A. S. Perelson. Agent-based modeling of host-pathogen systems: The successes and challenges. Inform. Sciences, 179(10):1379–1389, 29 April 2009. doi:10.1016/j. ins.2008.11.012
doi:10.1016/j 2009
-
[5]
C. Beauchemin. Probing the effects of the well-mixed assumption on viral infection dynamics. J. Theor. Biol., 242(2):464–477, 21 September 2006. doi:10.1016/j.jtbi.2006.03.014
-
[6]
C. Beauchemin, S. Forrest, and F. T. Koster. Modeling influenza viral dynamics in tissue. In H. Bersini and J. Carneiro, editors, Proceedings of the 5th International Conference on Artificial Immune Systems (ICARIS 06), number 4163 in Lecture Notes in Computer Science, pages 23–36. Springer-Verlag Berlin Heidelberg, 2006. doi:10.1007/11823940_3
-
[7]
C. Beauchemin, J. Samuel, and J. Tuszynski. A simple cellular automaton model for influenza A viral infections. J. Theor. Biol. , 232(2):223–234, 21 January 2005. doi:10.1016/j.jtbi.2004.08.001
-
[8]
N. F. Beggs and H. M. Dobrovolny. Determining drug efficacy parameters for mathematical models of influenza. J. Biol. Dyn. , 9(sup1):332–346, 9 June 2015. doi:10.1080/17513758.2015.1052764
arXiv 2015
Show all 82 references
-
[9]
G. A. Bocharov and A. A. Romanyukha. Mathematical model of antiviral immune response III. Influenza A virus infection. J. Theor. Biol. , 167(4):323–360, 21 April 1994. doi:10.1006/jtbi.1994.1074
1994
-
[10]
Boianelli, V
A. Boianelli, V. K. Nguyen, T. Ebensen, K. Schulze, E. Wilk, N. Sharma, S. Stegemann-Koniszewski, D. Bruder, F. R. Toapanta, C. A. Guzmn, M. Meyer-Hermann, and E. A. Hernandez-Vargas. Modeling influenza virus infection: A roadmap for influenza research. Viruses, 7(10):5274–5304,...
2015 doi
-
[11]
Cao and J
P. Cao and J. M. McCaw. The mechanisms for within-host influenza virus control affect model-based assessment and prediction of antiviral treatment. Viruses, 9(8):E197, 26 July 2017. doi:10.3390/ v9080197
2017
-
[12]
P. Cao, A. W. Yan, J. M. Heffernan, S. Petrie, R. G. Moss, L. A. Carolan, T. A. Guarnaccia, A. Kelso, I. G. Barr, J. McVernon, K. L. Laurie, and J. M. McCaw. Innate immunity and the inter-exposure inter- val determine the dynamics of secondary influenza virus infection and expla...
2015 doi
-
[13]
Carrat, E
F. Carrat, E. Vergu, N. M. Ferguson, M. Lemaitre, S. Cauchemez, S. Leach, and A.-J. Valleron. Time lines of infection and disease in human influenza: A review of volunteer challenge studies. Am. J. Epidemiol., 167(7):775–785, 1 April 2008. doi:10.1093/aje/kwm375
2008 doi
-
[14]
M. Chan, C. Cheung, W. Chui, S. Tsao, J. Nicholls, Y. Chan, R. Chan, H. Long, L. Poon, Y. Guan, and J. Peiris. Proinflammatory cytokine responses induced by influenza A (H5N1) viruses in primary human alveolar and bronchial epithelial cells. Respir. Res., 6(1):135, 11 November 2...
2005
-
[15]
M. C. Chan, R. W. Chan, W. C. Yu, C. C. Ho, W. Chiu, C. Lo, K. M. Yuen, Y. Guan, J. M. Nicholls, and J. M. Peiris. Influenza H5N1 virus infection of polarized human alveolar epithelial cells and lung microvascular endothelial cells. Respir. Res., 10(1), 30 October 2009. doi:10....
2009 doi
-
[16]
C. Y. Cheung, L. L. M. Poon, A. S. Lau, W. Luk, Y. L. Lau, K. F. Shortridge, S. Gordon, Y. Guan, and J. S. M. Peiris. Induction of proinflammatory cytokines in human macrophages by influenza A (H5N1) viruses: A mechanism for the unusual severity of human disease? Lancet, 360(934...
2002 doi
-
[17]
Chotpitayasunondh, K
T. Chotpitayasunondh, K. Ungchusak, W. Hanshaoworakul, S. Chunsuthiwat, P. Sawanpanyalert, R. Ki- jphati, S. Lochindarat, P. Srisan, P. Suwan, Y. Osotthanakorn, T. Anantasetagoon, S. Kanjanawasri, S. Tanupattarachai, J. Weerakul, R. Chaiwirattana, M. Maneerattanaporn, R. Pools...
2004
-
[18]
L. M. Crosby and C. M. Waters. Epithelial repair mechanisms in the lung. Am. J. Physiol. Lung Cell Mol. Physiol., 298(6):L715–L731, June 2010. doi:10.1152/ajplung.00361.2009
2010
-
[19]
M. D. de Jong, C. P. Simmons, T. T. Thanh, V. M. Hien, G. J. D. Smith, T. N. B. Chau, D. M. Hoang, N. V. V. Chau, T. H. Khanh, V. C. Dong, P. T. Qui, B. V. Cam, D. Q. Ha, Y. Guan, J. S. M. Peiris, N. T. Chinh, T. T. Hien, and J. Farrar. Fatal outcome of human influenza A (H5N1)...
2006 doi
-
[20]
H. M. Dobrovolny, M. J. Baron, R. Gieschke, B. E. Davies, N. L. Jumbe, and C. A. A. Beauchemin. Exploring cell tropism as a possible contributor to influenza infection severity. PLoS One, 5(11):e13811, 23 November 2010. doi:10.1371/journal.pone.0013811
2010 doi
-
[21]
H. M. Dobrovolny and C. A. A. Beauchemin. Modelling the emergence of influenza drug resistance: The roles of surface proteins, the immune response and antiviral mechanisms. PLoS One, 12(7):e0180582, 10 July 2017. doi:10.1371/journal.pone.0180582
2017 doi
-
[22]
H. M. Dobrovolny, R. Gieschke, B. E. Davies, N. L. Jumbe, and C. A. A. Beauchemin. Neuraminidase inhibitors for treatment of human and avian strain influenza: A comparative study. J. Theor. Biol. , 269(1):234–244, 21 January 2011. doi:10.1016/j.jtbi.2010.10.017
2011 doi
-
[23]
H. M. Dobrovolny, M. B. Reddy, M. A. Kamel, C. R. Rayner, and C. A. A. Beauchemin. Assessing math- ematical models of influenza infections using features of the immune response. PLoS One, 8(2):e57088, 28 February 2013. doi:10.1371/journal.pone.0057088
2013 doi
-
[24]
J. W. Drake. Rates of spontaneous mutation among RNA viruses. Proc. Natl. Acad. Sci. U.S.A. , 90(9):4171–4175, 1 May 1993. doi:10.1073/pnas.90.9.4171
1993 doi
-
[25]
J. S. Erjef¨ alt, I. Erjef¨ alt, F. Sundler, and C. G. A. Persson. In vivo restitution of airway epithelium. Cell Tissue Res. , 281(2):305–316, August 1995. doi:10.1007/bf00583399
1995 doi
-
[26]
J. V. Fahy and B. F. Dickey. Airway mucus function and dysfunction. N. Engl. J. Med. , 363(23):2233– 2247, 2 December 2010. doi:10.1056/NEJMra0910061
2010 doi
-
[27]
R. S. Fritz, F. G. Hayden, D. P. Calfee, L. M. R. Cass, A. W. Peng, W. G. Alvord, W. Strober, and S. E. Straus. Nasal cytokine and chemokine response in experimental influenza A virus infection: Results of a placebo-controlled trial of intravenous zanamivir treatment. J. Infect...
-
[28]
Hancioglu, D
B. Hancioglu, D. Swigon, and G. Clermont. A dynamical model of human immune response to influenza A virus infection. J. Theor. Biol. , 246(1):70–86, 7 May 2010. doi:10.1016/j.jtbi.2006.12.015. 23
2010 doi
-
[29]
Handel, L
A. Handel, L. E. Liao, and C. A. A. Beauchemin. Progress and trends in mathematical modelling of influenza A virus infections. Curr. Opin. Syst. Biol. , 12:30–36, December 2018. doi:10.1016/j.coisb. 2018.08.009
2018 doi
-
[30]
Handel, I
A. Handel, I. M. Longini, and R. Antia. Towards a quantitative understanding of the within-host dynamics of influenza A infections. J R Soc Interface. , 7(42):35–47, 6 January 2010. doi:10.1098/ rsif.2009.0067
2010
-
[31]
Handel, I
A. Handel, I. M. Longini, Jr., and R. Antia. Neuraminidase inhibitor resistance in influenza: Assessing the danger of its generation and spread. PLoS Comput. Biol. , 3(12):e240, December 2007. doi:10. 1371/journal.pcbi.0030240
2007
-
[32]
F. G. Hayden, J. J. Treanor, R. F. Betts, M. Lobo, J. D. Esinhart, and E. K. Hussey. Safety and efficacy of the neuraminidase inhibitor GG167 in experimental human influenza. JAMA., 275(4):295– 299, January 1996
1996
-
[33]
F. G. Hayden, J. J. Treanor, R. S. Fritz, M. Lobo, R. F. Betts, M. Miller, N. Kinnersley, R. G. Mills, P. Ward, and S. E. Straus. Use of the oral neuraminidase inhibitor oseltamivir in experimental human influenza: Randomized controlled trials for prevention and treatment. JAMA...
1999 doi
-
[34]
F. G. Hayden, A. R. Tunkel, J. J. Treanor, R. F. Betts, S. Allerheiligen, and J. Harris. Oral LY217896 for prevention of experimental influenza A virus infection and illness in humans. Antimicrob. Agents Chemother., 38(5):1178–1181, May 1994. doi:10.1128/aac.38.5.1178
1994 doi
-
[35]
T. T. Hien, N. T. Liem, N. T. Dung, L. T. San, P. P. Mai, N. van Vinh Chau, P. T. Suu, V. C. Dong, L. T. Q. Mai, N. T. Thi, D. B. Khoa, L. P. Phat, N. T. Truong, H. T. Long, C. V. Tung, L. T. Giang, N. D. Tho, L. H. Nga, N. T. K. Tien, L. H. San, L. V. Tuan, C. Dolecek, T. T. ...
2004 doi
-
[36]
B. P. Holder and C. A. A. Beauchemin. Exploring the effect of biological delays in kinetic models of influenza within a host or cell culture. BMC Public Health , 11(Suppl 1):S10, 25 February 2011. doi:10.1186/1471-2458-11-S1-S10
2011 doi
-
[37]
B. P. Holder, L. E. Liao, P. Simon, G. Boivin, and C. A. A. Beauchemin. Design considerations in building in silico equivalents of common experimental influenza virus assays. Autoimmunity, 44(4), June 2011. doi:10.3109/08916934.2011.523267
2011
-
[38]
Hoshino, H
A. Hoshino, H. Takenaka, O. Mizukoshi, J. Imanishi, T. Kishida, and M. G. Tovey. Effect of anti- interferon serum of influenza virus infection in mice. Antiviral Res., 3(1):59–65, March 1983
1983
-
[39]
Hsieh and S.-C
S.-M. Hsieh and S.-C. Chang. Insufficient perforin expression in CD8+ T cells in response to hemagglutinin from avian influenza (H5N1) virus. J. Immunol. , 176(8):4530–4533, 15 April 2006. doi:10.4049/jimmunol.176.8.4530
2006 doi
-
[40]
Iwasaki and P
A. Iwasaki and P. S. Pillai. Innate immunity to influenza virus infection. Nat. Rev. Immunol., 14(5):315– 328, May 2014. doi:10.1038/nri3665
2014 doi
-
[41]
Iwasaki and T
T. Iwasaki and T. Nozima. Defense mechanisms against primary influenza virus infection in mice. I. The roles of interferon and neutralizing antibodies and thymus dependence of interferon and antibody production. J. Immunol, 118(1):256–263, January 1977
1977
-
[42]
K. P. Keenan, T. S. Wilson, and E. M. McDowell. Regeneration of hamster tracheal epithelium after mechanical injury. Virchows Arch. B Cell Pathol. Incl. Mol. Pathol. , 43(3):213–240, 1983. 24
1983
-
[43]
R. M. Kris, R. A. Yetter, R. Cogliano, R. Ramphal, and P. A. Small. Passive serum antibody causes tem- porary recovery from influenza virus infection of the nose, trachea and lung of nude mice. Immunology, 63(3):349–353, March 1988
1988
-
[44]
H. Y. Lee, D. J. Topham, S. Y. Park, J. Hollenbaugh, J. Treanor, T. R. Mosmann, X. Jin, B. M. Ward, H. Miao, J. Holden-Wiltse, A. S. Perelson, M. Zand, and H. Wu. Simulation and prediction of the adaptive immune response to influenza A virus infection. J. Virol., 83(14):7151–71...
2009 doi
-
[45]
L. E. Liao, S. Kowal, D. A. Cardenas, and C. A. A. Beauchemin. Exploring virus release as a bottleneck for the spread of influenza A virus infection in vitro and the implications for antiviral therapy with neuraminidase inhibitors. PLoS One, 12(8):e0183621, 24 August 2017. doi:...
2017 doi
-
[46]
Manicassamy, S
B. Manicassamy, S. Manicassamy, A. Belicha-Villanueva, G. Pisanelli, B. Pulendran, and A. Garc´ ıa- Sastre. Analysis of in vivo dynamics of influenza virus infection in mice using a GFP reporter virus. Proc. Natl. Acad. Sci. U.S.A. , 107(25):11531–11536, 22 June 2010. doi:10.10...
2010 doi
-
[47]
Matsui, S
H. Matsui, S. H. Randell, S. W. Peretti, C. W. Davis, and R. C. Boucher. Coordinated clearance of periciliary liquid and mucus from airway surfaces. J. Clin. Invest., 102(6):11251131, 15 September 1998. doi:10.1172/JCI2687
1998 doi
-
[48]
McLaren and G
C. McLaren and G. M. Butchko. Regional T- and B-cell responses in influenza-infected ferrets. Infect. Immun., 22(1):189–194, October 1978
1978
-
[49]
H. Miao, J. A. Hollenbaugh, M. S. Zand, J. Holden-Wiltse, T. R. Mosmann, A. S. Perelson, H. Wu, and D. J. Topham. Quantifying the early immune response and adaptive immune response kinetics in mice infected with influenza A virus. J. Virol., 84(13):6687–6698, July 2010. doi:10....
2010 doi
-
[50]
Mitchell, D
H. Mitchell, D. Levin, S. Forrest, C. A. A. Beauchemin, J. Tipper, J. Knight, N. Donart, R. C. Layton, J. Pyles, P. Gao, K. S. Harrod, A. S. Perelson, and F. Koster. Higher level of replication efficiency of 2009 (H1N1) pandemic influenza virus than those of seasonal and avian st...
2009 doi
-
[51]
R. Mora, E. Rodriguez-Boulan, P. Palese, and A. Garc´ ıa-Sastre. Apical budding of a recombinant influenza A virus expressing a hemagglutinin protein with a basolateral localization signal. J. Virol., 76(7):3544–3553, April 2002. doi:10.1128/jvi.76.7.3544-3553.2002
2002
-
[52]
K. W. Morton and D. F. Mayers. Numerical solution of partial differential equations: An introduction . Cambridge University Press, Cambridge, UK, 2nd edition, 11 April 2005
2005
-
[53]
A. F. Oner, A. Bay, S. Arslan, H. Akdeniz, H. A. Sahin, Y. Cesur, S. Epcacan, N. Yilmaz, I. Deger, B. Kizilyildiz, H. Karsen, and M. Ceyhan. Avian influenza A (H5N1) infection in eastern Turkey in
-
[54]
Palmer, H
J. Palmer, H. M. Dobrovolny, and C. A. A. Beauchemin. The in vivo efficacy of neuraminidase inhibitors cannot be determined from the decay rates of influenza viral titers observed in treated patients. Sci. Rep., 7:40210, 9 January 2017. doi:10.1038/srep40210
2017 doi
-
[55]
E. G. Paradis, L. T. Pinilla, B. P. Holder, Y. Abed, G. Boivin, and C. A. A. Beauchemin. Impact of the H275Y and I223V mutations in the neuraminidase of the 2009 pandemic influenza virus in vitro and evaluating experimental reproducibility. PLoS One , 10(5):e0126115, 20 May 201...
2009 doi
-
[56]
J. S. M. Peiris, M. D. de Jong, and Y. Guan. Avian influenza virus (H5N1): A threat to human health. Clin. Microbiol. Rev., 20(2):243–267, April 2007. doi:10.1128/CMR.00037-06. 25
2007 doi
-
[57]
A. S. Perelson, L. Rong, and F. G. Hayden. Combination antiviral therapy for influenza: Predictions from modeling of human infections. J Infect Dis., 205(11):1642–1645, June 2012. doi:10.1093/infdis/ jis265
2012 doi
-
[58]
S. M. Petrie, T. Guarnaccia, K. L. Laurie, A. C. Hurt, J. McVernon, and J. M. McCaw. Reducing uncertainty in within-host parameter estimates of influenza infection by measuring both infectious and total viral load. PLoS One, 8(5):e64098, 15 May 2013. doi:10.1371/journal.pone.0064098
2013 doi
-
[59]
L. T. Pinilla, B. P. Holder, Y. Abed, G. Boivin, and C. A. A. Beauchemin. The H275Y neuraminidase mutation of the pandemic A/H1N1 virus lengthens the eclipse phase and reduces viral output of infected cells, potentially compromising fitness in ferrets. J. Virol., 86(19):10651–1...
2012 doi
-
[60]
O. G. Raabe, H. C. Yeh, G. M. Schum, and R. F. Phalen. Tracheobronchial geometry: Human, dog, rat, hamster. Report, Lovelace Foundation, 1976
1976
-
[61]
Ramphal, W
R. Ramphal, W. Fischlschweiger, J. W. Shands, Jr., and P. A. Small, Jr. Murine influenzal tracheitis: A model for the study of influenza and tracheal epithelial repair. Am. Rev. Respir. Dis., 120(6):1313–1324, December 1979. doi:10.1164/arrd.1979.120.6.1313
1979 doi
-
[62]
L. A. Reperant, T. Kuiken, B. T. Grenfell, A. D. M. E. Osterhaus, and A. P. Dobson. Linking influenza virus tissue tropism to population-level reproductive fitness. PLoS One, 7(8):e43115, 28 August 2012. doi:10.1371/journal.pone.0043115
2012 doi
-
[63]
P. D. Reuman, D. I. Bernstein, M. C. Keefer, E. C. Young, J. R. Sherwood, and G. M. Schiff. Efficacy and safety of low dosage amantadine hydrochloride as prophylaxis for influenza A.Antivir. Res., 11(1):27–40, February 1989
1989
-
[64]
J. R. Rock, M. W. Onaitis, E. L. Rawlins, Y. Lu, C. P. Clark, Y. Xue, S. H. Randell, and B. L. M. Hogan. Basal cells as stem cells of the mouse trachea and human airway epithelium. Proc. Natl. Acad. Sci. U.S.A., 106(31):12771–12775, 4 August 2009. doi:10.1073/pnas.0906850106
2009 doi
-
[65]
R. A. Saenz, M. Quinlivan, D. Elton, S. MacRae, A. S. Blunden, J. A. Mumford, J. M. Daly, P. Digard, A. Cullinane, B. T. Grenfell, J. W. McCauley, J. L. N. Wood, and J. R. Gog. Dynamics of influenza virus infection and pathology. J. Virol., 84(8):3974–3983, April 2010. doi:10.1...
2010 doi
-
[66]
S. H. Seo, E. Hoffmann, and R. G. Webster. Lethal H5N1 influenza viruses escape host anti-viral cytokine responses. Nat, Med., 8(9):950–954, September 2002. doi:10.1038/nm757
2002 doi
-
[67]
Shinya, M
K. Shinya, M. Ebina, S. Yamada, M. Ono, N. Kasai, and Y. Kawaoka. Avian flu: Influenza virus receptors in the human airway. Nature, 440(7083):435–436, 23 March 2006. doi:10.1038/440435a
2006 doi
-
[68]
P. F. Simon, M.-A. de La Vega, E. Paradis, E. Mendoza, K. M. Coombs, D. Kobasa, and C. A. A. Beauchemin. Avian influenza viruses that cause highly virulent infections in humans exhibit distinct replicative properties in contrast to human H1N1 viruses. Sci. Rep. , 6:24154, 15 Ap...
2016 doi
-
[69]
D. J. Smith, E. A. Gaffney, and J. R. Blake. Modelling mucociliary clearance.Respir. Physiol. Neurobiol., 163(1–3):178–188, 30 November 2008. doi:10.1016/j.resp.2008.03.006
2008 doi
-
[70]
M. D. Stoneham. The nasopharyngeal airway. Assessment of position by fibreoptic laryngoscopy. Anaes- thesia, 48(7):575–580, July 1993. doi:10.1111/j.1365-2044.1993.tb07119.x
1993
-
[71]
M. C. Strain, D. D. Richman, J. K. Wong, and H. Levine. Spatiotemporal dynamics of HIV propagation. J. Theor. Biol. , 218(1):85–96, 7 September 2002. doi:10.1006/jtbi.2002.3055. 26
2002
-
[72]
C. I. Thompson, W. S. Barclay, M. C. Zambon, and R. J. Pickles. Infection of human airway epithelium by human and avian strains of influenza A virus. J. Virol. , 80(16):8060–8068, August 2006. doi: 10.1128/JVI.00384-06
2006 doi
-
[73]
V. Tran, L. A. Moser, D. S. Poole, and A. Mehle. Highly sensitive real-time in vivo imaging of an influenza reporter virus reveals dynamics of replication and spread. J. Virol. , 87(24):13321–13329, December 2013. doi:10.1128/JVI.02381-13
2013 doi
-
[74]
van Riel, V
D. van Riel, V. J. Munster, E. de Wit, G. F. Rimmelzwaan, R. A. M. Fouchier, A. D. M. E. Osterhaus, and T. Kuiken. H5N1 virus attachment to lower respiratory tract. Science, 312(5772):399, 21 April 2006
2006
-
[75]
van Riel, V
D. van Riel, V. J. Munster, E. de Wit, G. F. Rimmelzwaan, R. A. M. Fouchier, A. D. M. E. Osterhaus, and T. Kuiken. Human and avian influenza viruses target different cells in the lower respiratory tract of humans and other mammals. Am. J. Pathol. , 171(4):1215–1223, October 2007...
2007 arXiv
-
[76]
Z. Wang, Y. Wan, C. Qiu, S. Quinones-Parra, Z. Zhu, L. Loh, D. Tian, Y. Ren, Y. Hu, X. Zhang, P. G. Thomas, M. Inouye, P. C. Doherty, K. Kedzierska, and J. Xu. Recovery from severe H7N9 disease is associated with diverse response mechanisms dominated by CD8+ T cells. Nat. Comm...
2015 doi
-
[77]
M. A. Wells, P. Albrecht, and F. A. Ennis. Recovery from a viral respiratory infection: 1. Influenza pneumonia in normal and T-deficient mice. J. Immunol., 126(3):1036–1041, March 1981
1981
-
[78]
T. Wu, J. Guan, A. Handel, D. C. Tscharke, J. Sidney, A. Sette, L. M. Wakim, X. Y. X. Sng, P. G. Thomas, N. P. Croft, A. W. Purcell, and N. L. La Gruta. Quantification of epitope abundance reveals the effect of direct and cross-presentation on influenza CTL responses. Nat. Commun...
2019 doi
-
[79]
A. W. C. Yan, S. G. Zaloumis, J. A. Simpson, and J. M. McCaw. Sequential infection experi- ments for quantifying innate and adaptive immunity during influenza infection. PLoS Comput. Biol. , 15(1):e1006568, 17 January 2019. doi:10.1371/journal.pcbi.1006568
2019 doi
-
[80]
S. Yang, G. W. Lee, C.-M. Chen, C.-C. Wu, and K.-P. Yu. The size and concentration of droplets generated by coughing in human subjects. J. Aerosol. Med., 20(4):484–494, 2007. doi:10.1089/jam. 2007.0610
2007
-
[81]
K. L. Yap and G. L. Ada. Cytotoxic T cells in the lungs of mice infected with an influenza A virus. Scand. J. Immunol. , 7(1):73–80, 1978. doi:10.1111/j.1365-3083.1978.tb00428.x. 27
1978
-
[2006]
N. Engl. J. Med. , 355(21):2179–2185, 23 November 2006. doi:10.1056/NEJMoa060601
2006 doi
Reviewed August 14, 2026 · model on record in the stance chip above.
Discussion (0). Continue with ORCID to comment.