REVIEW 4 major objections 8 minor 17 references
Dosimetric Evaluation of CT-to-RED Calibration Curves on Dosimetric Accuracy in Brain Radiotherapy
T0 review · 4 major / 8 minor · reviewed 2026-08-16 · deepseek-v4-flash
Pith's one-line read The CT-to-RED calibration curve used in brain VMAT changes calculated target doses by 3–5%, and the paper argues the default Monaco curve overestimates relative to a CIRS-derived curve.
desk verdict Small but genuine clinical comparison of CT-to-RED curves; the accuracy claim outruns the data without an independent dose measurement. read the letter →
The pith
A machine-rendered reading of the paper's core claim, the machinery that carries it, and where it could break.
The reading
What carries the argument
The central object is the CT-to-RED calibration curve, a mapping from each Hounsfield Unit value in the planning CT to a relative electron density used by the Monte Carlo dose engine. The study compares three such curves: one built from a 10-insert tissue-equivalent phantom (CIRS 062M), one from a 7-insert phantom (Catphan 604), and the vendor default preset in the Monaco treatment planning system. Recalculating the same ten VMAT plans with only this mapping changed isolates the effect of the calibration curve on the resulting dose-volume metrics.
What would settle it
Place an independent dosimeter (ionization chamber or film) in a head-equivalent phantom, create identical VMAT plans using the CIRS-derived and default Monaco curves, deliver both, and compare measured to calculated dose; if measured doses match the default-curve calculation within uncertainty while CIRS calculations are 3–5% low, the paper's overestimation claim fails.
Extended reading notes
Core claim
The paper reports that, in ten brain VMAT plans, recalculating with the default Monaco calibration curve produced systematically higher dose metrics than recalculating with a curve derived from the CIRS 062M phantom: PTV Dmax, Dmin, Dmean, and D95% all differed significantly (p < 0.05), with Dmax 3–5% higher, and seven of ten OARs showed significant Dmax increases of 2–4%, including the brainstem (p = 0.003) and optic chiasm (p = 0.005). The Catphan-derived curve sat between the two, with fewer significant differences. The authors conclude that the CIRS-derived curve is the most accurate and should replace generic defaults in brain calibration protocols.
Load-bearing premise
The load-bearing premise is that the CIRS phantom's tissue-equivalent inserts truly represent brain tissue electron densities, so its calibration curve is the accuracy benchmark; no independent delivered-dose measurement confirms this.
Editorial extensions
If this is right
- Using the default Monaco curve instead of a CIRS-derived curve raises calculated PTV Dmax by 3–5% and OAR Dmax by 2–4%, so plans normalized to the same target dose would deliver less physical dose to the tumor and more to organs than intended.
- Seven of ten OARs, including the brainstem and optic chiasm, show significantly higher maximum doses with the default curve, raising the predicted risk of neurotoxicity such as brainstem necrosis or optic neuropathy.
- The Catphan-derived curve gives intermediate results with fewer significant differences, so it is closer to the CIRS curve than to the default but still not the preferred brain calibration.
- Adopting site-specific, phantom-based calibration would reduce inter-institutional variability and help meet the clinical guideline that delivered doses should not deviate by more than 5% from prescription.
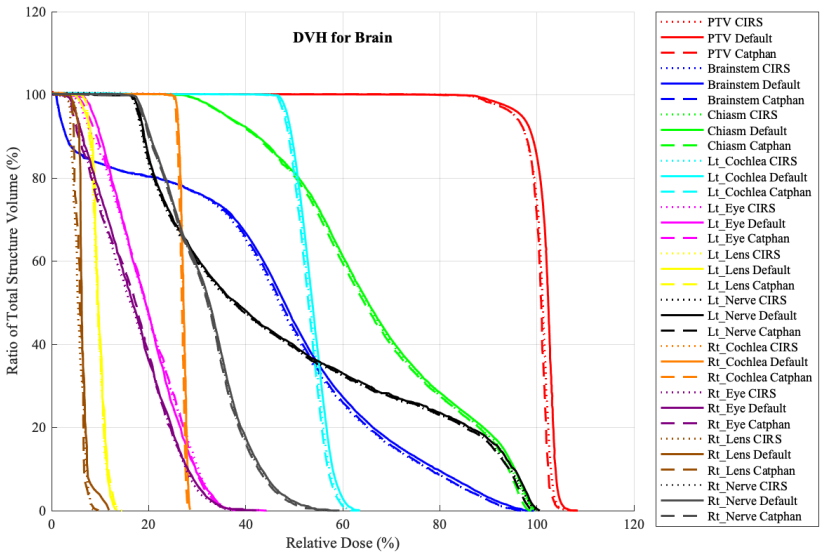
- Dose-volume histogram comparisons across the three curves show visible deviations in high-gradient regions near critical structures, meaning plan evaluation and treatment approval can depend on the calibration curve chosen.
Reading between the lines
- Because only one CT scanner, one treatment planning system, and one beam energy were used, the 3–5% magnitude is likely scanner- and protocol-dependent; repeating the recalculation on a second scanner with a different tube voltage would test this.
- A direct measurement with an independent dosimeter in a head-equivalent phantom would convert the relative comparison into an absolute accuracy claim and settle whether the default curve overestimates or the CIRS curve underestimates true dose.
- The same comparison could be extended to proton therapy, where CT-derived stopping-power ratios are also sensitive to HU-to-RED calibration and where a 3–5% range uncertainty is clinically meaningful.
- If the overestimation is systematic, centers using the default curve in multi-center trials may unknowingly bias dose-normalization parameters such as D95% or Dmean, contributing to inter-institutional variability in delivered doses.
Signed reviews
Editorial analysis
A structured set of objections, weighed in public.
Referee Report
Summary. This manuscript reports a dosimetric comparison of three CT-to-RED calibration curves (CIRS 062M, Catphan 604, and the Monaco TPS default) applied to ten retrospective brain VMAT plans recalculated in the Monaco treatment planning system. PTV metrics (Dmax, Dmin, Dmean, D95%) and OAR Dmax values were extracted from DVHs and compared using repeated-measures ANOVA/Friedman tests with post-hoc pairwise comparisons. The authors find statistically significant differences between the CIRS-derived and default TPS curves, with the default curve giving higher doses by 3–5% for PTV and 2–4% for OAR Dmax, and conclude that the CIRS-derived curve is the most accurate and should be prioritized in clinical calibration protocols.
Significance. If the reported differences are reliable, the study provides a useful sensitivity analysis showing that calibration curve choice can shift DVH metrics by several percent in brain VMAT, which is clinically relevant against the usual 5% dose tolerance. The use of ten clinical plans and the direct comparison of three established calibration approaches are strengths. However, the central accuracy ranking is not supported by the data as presented: no independent dosimetric measurement or ground-truth reference is used to establish which curve is closer to true delivered dose. The value of the paper lies in quantifying inter-curve variability and its potential clinical implications, not in establishing which calibration curve is physically correct in an absolute sense.
major comments (4)
- [Section 4 and Conclusion] The claim that the CIRS-derived curve "provided the most accurate dosimetric estimates" is not supported by the measurements reported. The study compares three calculation pathways with each other; no delivered dose was measured with an independent dosimeter, no reference calculation with known ground-truth densities was performed, and no absolute dose accuracy metric is reported. The observed 3–5% PTV and 2–4% OAR differences are relative differences and could equally indicate that the default curve overestimates, that the CIRS curve underestimates, or that both deviate from true dose in opposite directions. Please either add a direct validation experiment (e.g., phantom measurements with an ionization chamber or film) or reframe the conclusion to state that the curves produce statistically and clinically significant differences, with the default curve giving systematically higher dose estimates than the CIRS curve.
- [Section 2.2 and Discussion] The reasoning that the CIRS curve is more accurate because the CIRS 062M phantom contains ten tissue-equivalent inserts is an assertion about phantom design, not a measurement of dosimetric accuracy. A larger number of inserts affects the breadth of the fitted calibration curve, but no evidence is presented connecting insert count to agreement with true delivered dose in these patient plans. This inference should be removed or supported by a validation measurement; otherwise the paper should treat CIRS as one of three candidate curves rather than as the reference standard.
- [Table 1 and Figure 2] The manuscript does not report actual dose values or confidence intervals for the comparisons. Table 1 reports p-values and percentages only, and Figure 2 shows "relative mean dose percent" without specifying the reference value or the absolute dose scale. To assess clinical significance and to allow reproduction, please report the mean and standard deviation (or median and interquartile range) in dose units for each structure and each curve, together with pairwise differences and 95% confidence intervals.
- [Section 2.5 and Table 1] The multiple-testing strategy is incompletely described. Fourteen dosimetric parameters are tested, each with an omnibus test and pairwise comparisons, yet the Bonferroni correction appears to be applied only within each parameter's post-hoc tests, not across the full set of parameters. Uncorrected overall p-values such as 0.0035–0.0057 are reported alongside corrected pairwise values. Please specify the total number of comparisons, the correction method applied to the omnibus tests, and whether the p<0.05 threshold is family-wise or per-comparison.
minor comments (8)
- [Abstract] The sentence "by 3 5 for target volumes and 2 4 for some critical organs" is missing percent signs; it should read "3–5%" and "2–4%".
- [Section 3.1] The text states that the greatest discrepancy is in Dmax with p<0.001, but Table 1 does not report the magnitude of that discrepancy; please include the corresponding percentage difference at the point of citation.
- [Section 3.4] The heading "3.4. Visual Representation of Dosimetric Differences" is immediately followed by a duplicate heading "3.4. Visual Representation of Dosimetric Impact"; one of the two should be removed.
- [Section 4] The section labelled "4. Conclusion" should be numbered "5. Conclusion" because the Discussion is already Section 4.
- [Figure 2 caption] The caption says "red for CIRS, black for Catphan, and blue for Default"; please verify that the printed figure uses these exact colors and that the color legend is unambiguous for readers.
- [References] Reference [12] is cited in the Introduction as "Duong et al. (2025)" and in the Discussion as "Thanh Tai et al. (2025)"; please standardize the citation style for the same reference throughout the text.
- [General] The phantom name is written inconsistently as "Catphan 604", "Catphan 604", and "CATPhan" across the text and references; please unify the spelling.
- [Section 2.3] Given that ten patient plans were used retrospectively, please include a statement on ethics approval or an institutional review board waiver, as is customary for retrospective dosimetric studies.
Circularity Check
No circularity: the dosimetric comparison is empirical and the CIRS-accuracy conclusion is an interpretive claim, not a derivation-level reduction.
full rationale
The study is an empirical comparison, not a derivation. Three CT-to-RED calibration curves (CIRS 062M, Catphan 604, Monaco default) were applied to ten VMAT plans, and DVH metrics were compared statistically. No equation is derived from an assumed conclusion, and no fitted parameter is relabeled as a prediction: the three curves are independently constructed inputs, and the dose differences follow from Monte Carlo recalculation. The statement that the CIRS-derived curve 'provided the most accurate dosimetric estimates' is not forced by the data or by construction, because no independent delivered-dose measurement is reported; it is an interpretive judgment based on the CIRS phantom having more tissue-equivalent inserts. That is a limitation of the evidence for absolute accuracy, not a circular step. The only overlapping-author citation is [12] (Thanh Tai et al.), used as background on scanning-protocol effects; it is not load-bearing for the present conclusion. Thus the central comparison has independent content, and the paper does not reduce to its own inputs. Concerns about unverified ground truth belong in correctness risk, not circularity.
Assumptions & free parameters
assumptions (4)
- domain assumption CIRS 062M phantom tissue-equivalent inserts accurately represent the RED of human brain tissues.
- domain assumption Recalculating with unchanged beam parameters and monitor units isolates the effect of the calibration curve.
- domain assumption Monaco TPS Monte Carlo dose calculation is a valid reference for comparing curves.
- domain assumption The default Monaco curve is generic and non-site-specific.
Cite this review
Pith. "Pith review of Dosimetric Evaluation of CT-to-RED Calibration Curves on Dosimetric Accuracy in Brain Radiotherapy." pith.science (2026). https://pith.science/paper/IKD3CNZW
@misc{pith2026250416805,
  author       = {Pith},
  title        = {Pith review of: Dosimetric Evaluation of CT-to-RED Calibration Curves on Dosimetric Accuracy in Brain Radiotherapy},
  year         = {2026},
  howpublished = {\url{https://pith.science/paper/IKD3CNZW}},
  note         = {Machine review of arXiv:2504.16805}
}
read the original abstract
Accurate radiotherapy dose calculation depends on converting CT Hounsfield Units (HU) to relative electron density (RED) using calibration curves. This study compared three different CT-to-RED calibration curves-two derived from physical phantoms (CIRS 062M and Catphan 604) and one default curve from the Monaco treatment planning system (TPS) by recalculating ten brain tumor VMAT plans. The analysis showed that using the default TPS curve led to dose overestimation (by 3 5 for target volumes and 2 4 for some critical organs) compared to the CIRS phantom-derived curve, which was the most accurate. The Catphan curve had intermediate results. The findings highlight that the choice of calibration curve significantly affects dose accuracy in brain radiotherapy, and site-specific, phantom-based calibration should be prioritized to improve treatment precision and safety.
Figures

Reference graph
Works this paper leans on
-
[1]
The importance of accurate treatment planning, delivery, and dose verification
Malicki J. The importance of accurate treatment planning, delivery, and dose verification. Rep Pract Oncol Radiother 2012;17:63–5. https://doi.org/10.1016/j.rpor.2012.02.001
-
[2]
Evaluation of Inhomogeneity Correction Performed by Radiotherapy Treatment Planning System
Putha SK, Lobo D, Raghavendra H, Srinvias C, Banerjee S, Athiyamaan MS, et al. Evaluation of Inhomogeneity Correction Performed by Radiotherapy Treatment Planning System. Asian Pac J Cancer Prev APJCP 2022;23:4155–62. https://doi.org/10.31557/APJCP.2022.23.12.4155
-
[3]
Yagi M, Ueguchi T, Koizumi M, Ogata T, Yamada S, Takahashi Y , et al. Gemstone spectral imaging: determination of CT to ED conversion curves for radiotherapy treatment planning. J Appl Clin Med Phys 2013;14:173–86. https://doi.org/10.1120/jacmp.v14i5.4335
-
[4]
Quantitative computed tomography in radiation therapy: A mature technology with a bright future
van Elmpt W, Landry G. Quantitative computed tomography in radiation therapy: A mature technology with a bright future. Phys Imaging Rad iat Oncol 2018;6:12–3. https://doi.org/10.1016/j.phro.2018.04.004
-
[5]
Vinas L, Scholey J, Descovich M, Kearney V , Sudhyadhom A. Improved contrast and noise of megavoltage computed tomography (MVCT) through cycle-consistent generative machine learning. Med Phys 2021;48:676–90. https://doi.org/10.1002/mp.14616
-
[6]
An electron density calibration phantom for CT-based treatment planning computers
Constantinou C, Harrington JC, DeWerd LA. An electron density calibration phantom for CT-based treatment planning computers. Med Phys 1992;19:325–7. https://doi.org/10.1118/1.596862
-
[7]
Development of a CT number calibration audit phantom in photon radiation therapy: A pilot study
Nakao M, Ozawa S, Miura H, Yamada K, Habara K, Hayata M, et al. Development of a CT number calibration audit phantom in photon radiation therapy: A pilot study. Med Phys 2020;47:1509–22. https://doi.org/10.1002/mp.14077
-
[8]
Omer H, Tamam N, Alameen S, Algadi S, Thanh Tai D, Sulieman A. Elimination of biological and physical artifacts in abdomen and brain computed tomography procedures using filtering techniques. Saudi J Biol Sci 2022;29:2180–6. https://doi.org/10.1016/j.sjbs.2021.11.043
Show all 17 references
-
[9]
Assessment of the dosimetric accuracies of CATPhan 504 and CIRS 062 using kV-CBCT for performing direct calculations
Annkah JK, Rosenberg I, Hindocha N, Moinuddin SA, Ricketts K, Adeyemi A, et al. Assessment of the dosimetric accuracies of CATPhan 504 and CIRS 062 using kV-CBCT for performing direct calculations. J Med Phys Assoc Med Phys India 2014;39:133–41. https://doi.org/10.4103/0971-62...
2014
-
[10]
Hounsfield units variations: impact on CT- density based conversion tables and their effects on dose distribution
Zurl B, Tiefling R, Winkler P, Kindl P, Kapp KS. Hounsfield units variations: impact on CT- density based conversion tables and their effects on dose distribution. Strahlenther Onkol Organ Dtsch Rontgengesellschaft Al 2014;190:88–93. https://doi.org/10.1007/s00066-013- 0464-5
2014 doi
-
[11]
Clinical Implementation of Dual-energy CT for Proton Treatment Planning on Pseudo-monoenergetic CT scans
Wohlfahrt P, Möhler C, Hietschold V , Menkel S, Greilich S, Krause M, et al. Clinical Implementation of Dual-energy CT for Proton Treatment Planning on Pseudo-monoenergetic CT scans. Int J Radiat Oncol 2017;97:427–34. https://doi.org/10.1016/j.ijrobp.2016.10.022
2017 doi
-
[12]
Scanning protocol influence on relative electron Density-CT number calibrations and radiotherapy dose calculation for a Halcyon Li nac
Thanh Tai D, Nhu Tuyen P, Duc Tuan H, Hung HTP, Kandemir R, Omer H, et al. Scanning protocol influence on relative electron Density-CT number calibrations and radiotherapy dose calculation for a Halcyon Li nac. Radiat Phys Chem 2025:112760. https://doi.org/10.1016/j.radphysche...
2025
-
[13]
Using density computed tomography images for photon dose calculations in radiation oncology: A patient study
Decoene C, Crop F. Using density computed tomography images for photon dose calculations in radiation oncology: A patient study. Phys Imaging Radiat Oncol 2023;27:100463. https://doi.org/10.1016/j.phro.2023.100463
2023
-
[14]
The influence of different kVs and phantoms on computed tomography number to relative electron density calibration curve for radiotherapy dose calculation
Jaafar AM, Elsayed H, Khalil MM, Yaseen MN, Alshewered A, Ammar H. The influence of different kVs and phantoms on computed tomography number to relative electron density calibration curve for radiotherapy dose calculation. Precis Radiat Oncol 2022;6:289–97. https://doi.org/10....
2022 doi
-
[15]
Gonod M, Mazoyer F, Aubignac L. 7. Relative electronic densities vs CT number using two different phantoms: treatment planning impact. Phys Med 2017; 44:30. https://doi.org/10.1016/j.ejmp.2017.10.087
2017 doi
-
[16]
The effect of CT reconstruction filter selection on Hounsfield units in radiotherapy treatment planning
Nhila O, Talbi M, Mansouri ME, Youssoufi MA, Erraoudi M, Chakir EM, et al. The effect of CT reconstruction filter selection on Hounsfield units in radiotherapy treatment planning. J Radiother Pract 2023;22:e102. https://doi.org/10.1017/S1460396923000249
2023 doi
-
[17]
State of the art on dose prescription, reporting and recording in Intensity-Modulated Radiation Therapy (ICRU report No
Grégoire V , Mackie TR. State of the art on dose prescription, reporting and recording in Intensity-Modulated Radiation Therapy (ICRU report No. 83). Cancer/Radiothérapie 2011;15:555–9. https://doi.org/10.1016/j.canrad.2011.04.003
2011 doi
Reviewed August 16, 2026 · model on record in the stance chip above.
Discussion (0). Continue with ORCID to comment.