Waiting time analysis in a finite-capacity multi-server systems with dynamic priorities, dynamically evolving customer types, and abandonment
Pith reviewed 2026-07-02 16:47 UTC · model grok-4.3
The pith
A CTMC with Krylov approximation and a QBD process with matrix-analytic recursions compute conditional and long-run waiting time distributions in finite multi-server systems with dynamic priorities, evolving types, and abandonment.
A machine-rendered reading of the paper's core claim, the machinery that carries it, and where it could break.
Core claim
The CTMC-Krylov methodology offers a scalable computational approach well suited for analysing large complex systems; analytical expressions are derived via matrix-analytic methods to evaluate conditional and long-run waiting time distributions.
What carries the argument
The CTMC-Krylov methodology that approximates the transient behavior of the continuous-time Markov chain model of the queue.
If this is right
- Conditional waiting time distributions for Type 1 and Type 2 customers become numerically evaluable for systems of practical size.
- Long-run waiting time distributions follow directly from the matrix-analytic recursion on the QBD representation.
- The same framework applies to other finite multi-server systems whose state can be tracked by a CTMC or QBD with similar structure.
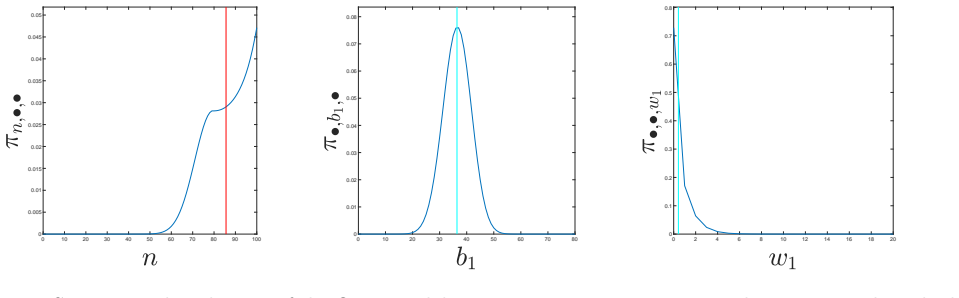
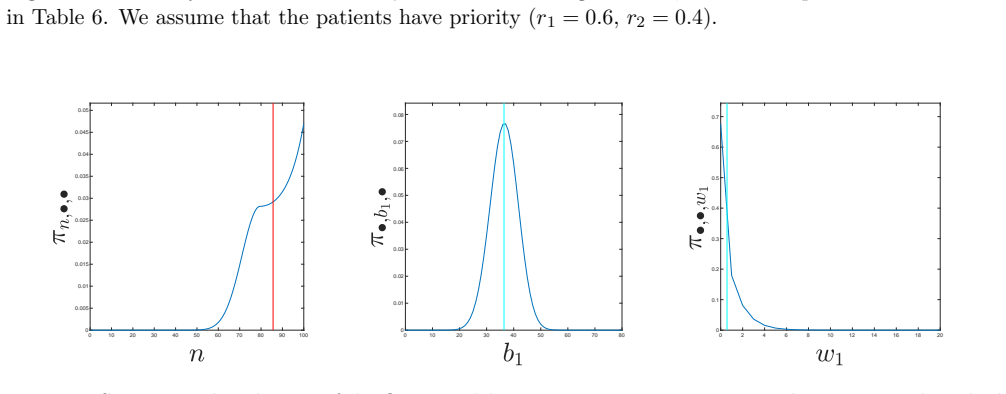
- Numerical examples on real hospital data illustrate that the computed distributions can inform resource allocation decisions.
Where Pith is reading between the lines
- The Krylov approach may remain feasible even when the number of customer types increases, provided the resulting state space does not explode.
- The matrix-analytic recursions could be combined with sensitivity analysis to identify which priority rules most affect waiting times.
- Direct comparison of the two methods on the same hospital instances would quantify the accuracy-cost trade-off between approximation and exact recursion.
Load-bearing premise
The system dynamics of dynamic admission priorities, evolving customer types, and abandonment behavior can be accurately captured by a continuous-time Markov chain whose state space remains tractable under the finite-capacity and finite-server assumptions.
What would settle it
If the waiting time distributions obtained from the CTMC-Krylov or QBD recursions do not match the empirical distributions computed from the Australian hospital dataset, the modeling assumptions would be falsified.
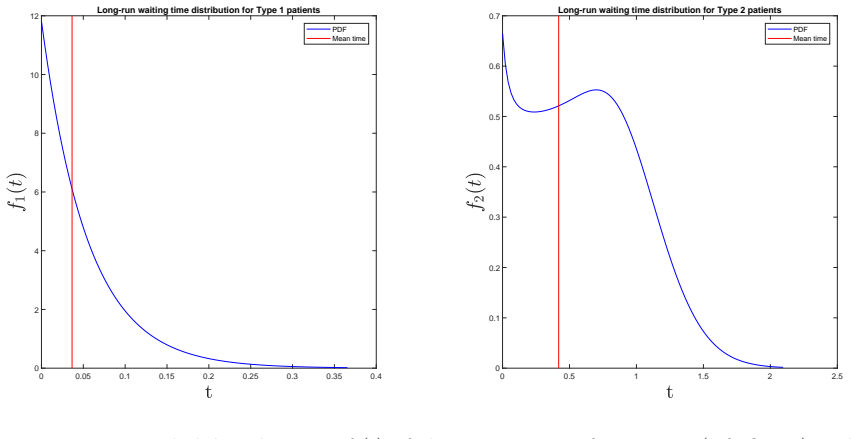
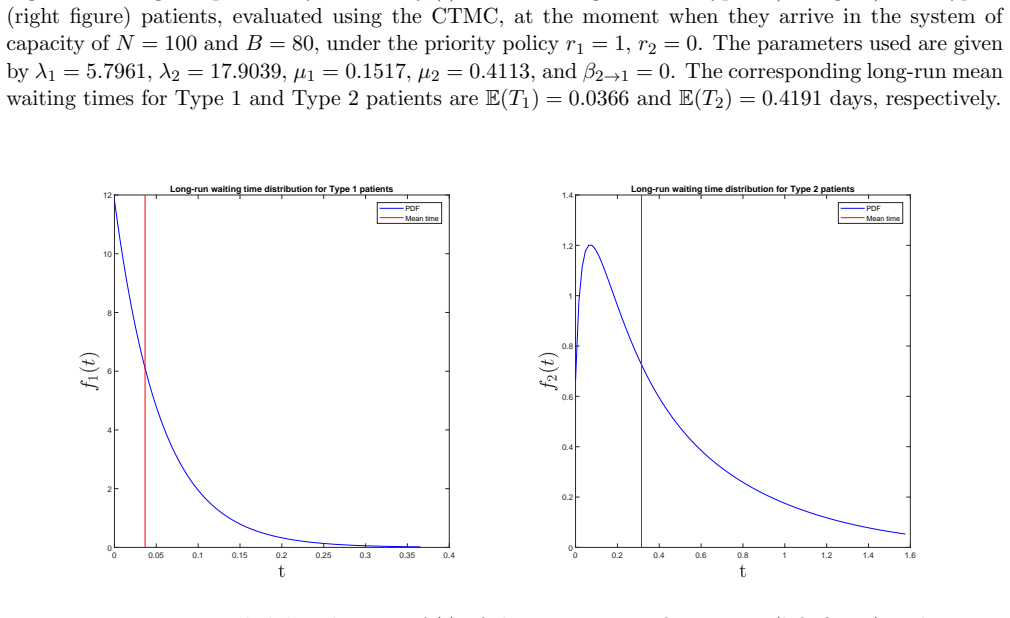
Figures
read the original abstract
In many service systems, an estimation of customers' waiting times for the service can assist in decision making focused on enhancing the operational efficiency, improving the customers' experience, and ensuring efficient resource allocation. In this paper, we study the customers' waiting times in a finite-capacity service system with a finite number of parallel servers and a shared waiting area. We consider two customer types, Type 1 and Type 2, with dynamic admission priorities, dynamically evolving customer type, and abandonment. We model the system under such assumptions using a continuous-time Markov chain (CTMC) and develop a methodology based on Krylov subspace approximation methods to evaluate the conditional waiting time distributions of Type 1 and Type 2 customers in the system. This methodology (CTMC-Krylov) offers a scalable computational approach that is well suited for analysing large complex systems. Next, we model this system using a quasi-birth-and-death (QBD) process and derive analytical expressions building on matrix-analytic methods to evaluate the conditional and long-run waiting time distributions using recursion. We illustrate the practical applicability of our models in a hospital system through a suite of numerical examples based on a large dataset obtained from a tertiary referral hospital in Australia, considering two types of patients, complex (Type 1) and other (Type 2).
Editorial analysis
A structured set of objections, weighed in public.
Referee Report
Summary. The paper models a finite-capacity multi-server system with two customer types, dynamic admission priorities, type evolution, and abandonment as a CTMC. It develops a CTMC-Krylov subspace method to compute conditional waiting time distributions and represents the system as a QBD process to derive analytical expressions for conditional and long-run waiting time distributions via matrix-analytic methods and recursion. The approach is illustrated with numerical examples from a large Australian hospital dataset distinguishing complex (Type 1) and other (Type 2) patients.
Significance. If the QBD reduction and matrix-analytic derivations hold, the work supplies both scalable numerical tools and exact recursive expressions for waiting times in queueing systems with dynamic features, which is valuable for operational decision-making in healthcare. The application to real hospital data and the emphasis on finite capacity and abandonment are practical strengths.
major comments (2)
- [QBD modeling and matrix-analytic derivations] The abstract and modeling description assert that the system with dynamic type evolution and admission priorities can be represented as a standard QBD process admitting matrix-geometric solutions. However, state-dependent rate changes from type transitions (Type 1/2) and priority rules typically destroy the level-independent repeating blocks (A0, A1, A2) required for the matrix-analytic method. The manuscript must exhibit the explicit infinitesimal generator or the repeating blocks in the QBD section to substantiate this reduction; without it the claimed analytical expressions rest on an unverified structural assumption.
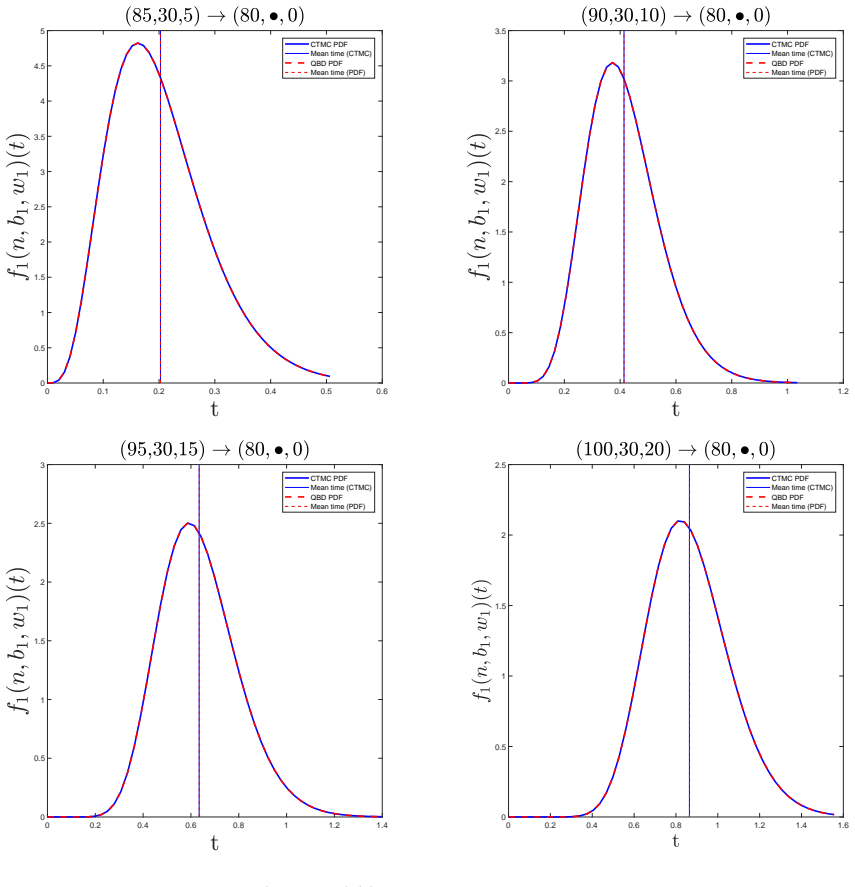
- [Numerical examples and CTMC-Krylov section] The CTMC-Krylov methodology is presented as scalable for large systems, yet the abstract and numerical examples provide no error bounds, convergence rates, or direct validation against discrete-event simulation. In the hospital case-study section, add quantitative accuracy metrics (e.g., Kolmogorov-Smirnov distances or tail-probability errors) between the Krylov approximations and simulation benchmarks.
minor comments (2)
- [Model description] Clarify the precise definition of 'dynamic admission priorities' and the transition rates between customer types; the current description leaves the phase space and rate dependencies ambiguous for replication.
- [Analytical expressions] The abstract states that recursion is used to evaluate long-run distributions; supply the explicit recursive formulas or the matrix-geometric rate matrix R in an appendix or dedicated subsection.
Simulated Author's Rebuttal
We thank the referee for the constructive feedback on our manuscript. We address the two major comments point by point below, agreeing to revisions that strengthen the presentation while clarifying the modeling choices.
read point-by-point responses
-
Referee: [QBD modeling and matrix-analytic derivations] The abstract and modeling description assert that the system with dynamic type evolution and admission priorities can be represented as a standard QBD process admitting matrix-geometric solutions. However, state-dependent rate changes from type transitions (Type 1/2) and priority rules typically destroy the level-independent repeating blocks (A0, A1, A2) required for the matrix-analytic method. The manuscript must exhibit the explicit infinitesimal generator or the repeating blocks in the QBD section to substantiate this reduction; without it the claimed analytical expressions rest on an unverified structural assumption.
Authors: We appreciate this observation. The state space is defined with levels as the total number of customers present and phases encoding the customer-type configuration, server assignments, and abandonment status. Because type-evolution and priority rules act only on the phase variables and the per-customer transition rates remain constant across interior levels, the blocks A0, A1, A2 are level-independent. The current manuscript describes this structure in Section 4 but does not display the explicit generator matrices. We will add the full infinitesimal generator together with the repeating blocks A0, A1, A2 in the revised version so that the matrix-analytic derivations are fully substantiated. revision: yes
-
Referee: [Numerical examples and CTMC-Krylov section] The CTMC-Krylov methodology is presented as scalable for large systems, yet the abstract and numerical examples provide no error bounds, convergence rates, or direct validation against discrete-event simulation. In the hospital case-study section, add quantitative accuracy metrics (e.g., Kolmogorov-Smirnov distances or tail-probability errors) between the Krylov approximations and simulation benchmarks.
Authors: We agree that quantitative validation will improve the numerical section. In the revised manuscript we will augment the hospital case-study results with direct comparisons against discrete-event simulation, reporting Kolmogorov-Smirnov distances, maximum tail-probability errors, and observed convergence behavior of the Krylov subspace method. A brief discussion of error bounds will also be added to the CTMC-Krylov methodology subsection. revision: yes
Circularity Check
No circularity: derivations apply standard matrix-analytic methods to explicitly modeled CTMC/QBD
full rationale
The paper explicitly constructs a CTMC for the system with dynamic priorities, type evolution, and abandonment, then represents it as a QBD to which established matrix-analytic techniques are applied for waiting-time distributions. No step reduces a claimed prediction or analytical expression to a fitted parameter, self-citation, or definitional tautology; the results are obtained by direct application of known recursion and Krylov methods to the constructed state space. The derivation chain is therefore self-contained and independent of its own outputs.
Axiom & Free-Parameter Ledger
Reference graph
Works this paper leans on
-
[1]
Aksamit, A., O’Reilly, M. M., & Palmowski, Z. (2024). Sensitivities of some performance measures of quasi-birth-and-death processes.Stochastic Models. https://doi.org/10.1080/15326349.2024. 2325448
-
[2]
Almehdawe, E., Jewkes, B., & He, Q.-M. (2019). Optimization in a two-stage multi-server service system with customer priorities.Journal of the Operational Research Society,70(2), 326–337. https : //doi.org/10.1080/01605682.2018.1438762
-
[3]
Cao, P., & Xie, J. (2016). Optimal control of a multiclass queueing system when customers can change types.Queueing Systems,82(3-4), 285–313. https://doi.org/10.1007/s11134-015-9466-6 D’Andrea, M., & Scarsini, M. (2025). Strategic Queues with Priority Classes.arXiv preprint arXiv:2502.05906. Den Iseger, P. (2006). Numerical transform inversion using gauss...
-
[4]
A., Woolford, D
Drekic, S., Stanford, D. A., Woolford, D. G., & McAlister, V. C. (2015). A model for deceased-donor transplant queue waiting times.Queueing Systems,79(1), 87–115. https://doi.org/10.1007/ s11134-014-9417-7
2015
-
[5]
Evdokimova, E., De Turck, K., & Fiems, D. (2018). Coupled queues with customer impatience.Perfor- mance Evaluation,118, 33–47. https://doi.org/10.1016/j.peva.2017.10.002
-
[6]
A., & Drekic, S
Fajardo, V. A., & Drekic, S. (2017). Waiting Time Distributions in the Preemptive Accumulating Priority Queue.Methodology and Computing in Applied Probability,19(1), 255–284. https://doi.org/10. 1007/s11009-015-9476-1
2017
-
[7]
Ghanbari, E., Soghrati Ghasbe, S., Aghsami, A., & Jolai, F. (2022). A novel mathematical optimization model for a preemptive multi-priority M/M/C queueing system of emergency department’s pa- tients, a real case study in iran.IISE Transactions on Healthcare Systems Engineering,12(4), 305–321. https://doi.org/10.1080/24725579.2022.2083730
-
[8]
H., & Van Loan, C
Golub, G. H., & Van Loan, C. F. (2013).Matrix computations. Johns Hopkins University press
2013
-
[9]
(2021).Modelling Hospital Escalation Levels as Quasi-Birth-and-Death Processes[Honours Thesis]
Grant, A. (2021).Modelling Hospital Escalation Levels as Quasi-Birth-and-Death Processes[Honours Thesis]. University of Tasmania, Australia
2021
-
[10]
Haviv, M., & Ravner, L. (2016). Strategic bidding in an accumulating priority queue: Equilibrium analysis. Annals of Operations Research,244(2), 505–523. https://doi.org/10.1007/s10479-016-2141-4
-
[11]
(2014).Fundamentals of matrix-analytic methods(Vol
He, Q.-M. (2014).Fundamentals of matrix-analytic methods(Vol. 9781461473305). Springer New York. https://doi.org/10.1007/978-1-4614-7330-5 Horv´ ath, G., Horv´ ath, I., Almousa, S. A.-D., & Telek, M. (2020). Numerical inverse Laplace transformation using concentrated matrix exponential distributions.Performance Evaluation,137. https://doi. org/10.1016/j.p...
-
[12]
Hou, J., & Zhao, X. (2020). Using a priority queuing approach to improve emergency department perfor- mance.Journal of Management Analytics,7(1), 28–43. https://doi.org/10.1080/23270012.2019. 1691945
-
[13]
Joyner, J., & Fralix, B. (2016). A new look at Markov processes of G/M/1-type.Stochastic Models,32(2), 253–274. https://doi.org/10.1080/15326349.2015.1115363
-
[14]
Khademi, A., & Liu, X. (2024). Ergodic Control of Bipartite Matching Queues with Class Change and Matching Failure.Stochastic Systems,14(3), 296–336. https://doi.org/10.1287/stsy.2022.0008
-
[15]
Kim, J., & Kim, B. (2013). Waiting time distribution in an M/PH/1 retrial queue.Performance Evalua- tion,70(4), 286–299. https://doi.org/10.1016/j.peva.2012.12.003 33
-
[16]
Komashie, A., Mousavi, A., Clarkson, P. J., & Young, T. (2015). An Integrated Model of Patient and Staff Satisfaction Using Queuing Theory.IEEE Journal of Translational Engineering in Health and Medicine,3. https://doi.org/10.1109/JTEHM.2015.2400436
-
[17]
(1999).Introduction to matrix analytic methods in stochastic modeling
Latouche, G., & Ramaswami, V. (1999).Introduction to matrix analytic methods in stochastic modeling. SIAM. https://doi.org/10.1137/1.9780898719734
-
[18]
Mandelbaum, A., Massey, W. A., Reiman, M. I., Stolyar, A., & Rider, B. (2002). Queue lengths and waiting times for multiserver queues with abandonment and retrials.Telecommunication Systems, 21(2-4), 149–171. https://doi.org/10.1023/A:1020921829517
-
[19]
Masoumi, M., Aghsami, A., Alipour-Vaezi, M., Jolai, F., & Esmailifar, B. (2022). An M/M/C/K queueing system in an inventory routing problem considering congestion and response time for post-disaster humanitarian relief: A case study.Journal of Humanitarian Logistics and Supply Chain Manage- ment,12(2), 182–219. https://doi.org/10.1108/JHLSCM-12-2020-0119
-
[20]
Neuts, M. F. (1981).Matrix-geometric solutions in stochastic models: An algorithmic approach(Vol. 2). Johns Hopkins University Press. O’Reilly, M. M., Krasnicki, S., Montgomery, J., Heydar, M., Turner, R., Van Dam, P., & Maree, P. (2025). Markov decision process and approximate dynamic programming for a patient assignment scheduling problem.Annals of Oper...
1981
-
[21]
Phung-Duc, T., Masuyama, H., Kasahara, S., & Takahashi, Y. (2010). A simple algorithm for the rate matrices of level-dependent QBD processes.5th International Conference on Queueing Theory and Network Applications, QTNA 2010 - Proceedings, 46–52. https://doi.org/10.1145/1837856. 1837864
-
[22]
Rahmawati, S., Graber, M. A., Hakimi, M., Mukti, A. G., Bastian, I., & Rahman, N. (2021). Cost com- parison of emergency cesarean section in indonesia: The impact of Australian model of diagnosis- related groups as a payment system for patient care in hospitals.Open Access Macedonian Journal of Medical Sciences,9, 216–223. https://doi.org/10.3889/oamjms.2021.5831
-
[23]
Rastpour, A., Ingolfsson, A., & Sandik¸ ci, B. (2022). Algorithms for Queueing Systems with Reneging and Priorities Modeled as Quasi-Birth-Death Processes.INFORMS Journal on Computing,34(3), 1693–1710. https://doi.org/10.1287/ijoc.2021.1141
-
[24]
(2011).Numerical methods for large eigenvalue problems: Revised edition
Saad, Y. (2011).Numerical methods for large eigenvalue problems: Revised edition. SIAM
2011
-
[25]
Sidje, R. B. (1998). Expokit: A software package for computing matrix exponentials.ACM Transactions on Mathematical Software,24(1), 130–156. https://doi.org/10.1145/285861.285868
-
[26]
Stanford, D. A., Taylor, P., & Ziedins, I. (2014). Waiting time distributions in the accumulating priority queue.Queueing Systems,77(3), 297–330. https://doi.org/10.1007/s11134-013-9382-6
-
[27]
Wang, C.-H., Tian, R., Hu, K., Chen, Y.-T., & Ku, T.-H. (2025). A markov decision optimization of medical service resources for two-class patient queues in emergency departments via particle swarm optimization algorithm.Scientific Reports,15(1). https://doi.org/10.1038/s41598-025-86158-w
-
[28]
Wang, J., Baron, O., & Scheller-Wolf, A. (2015). M/M/c queue with two priority classes.Operations Research,63(3), 733–749. https://doi.org/10.1287/opre.2015.1375
-
[29]
Whitt, W., & Zhang, X. (2017). A data-driven model of an emergency department.Operations Research for Health Care,12, 1–15. https://doi.org/10.1016/j.orhc.2016.11.001
-
[30]
L., Hettling, L., & Woll, R
Worlitz, J., Vu, D. L., Hettling, L., & Woll, R. (2019). Perceived Waiting Time and Waiting Satisfaction: A Systematic Literature Review.Proceedings of the 22nd QMOD-ICQSS International Conference on Quality and Service Sciences, 1–12
2019
-
[31]
Wu, Z., Wu, H., Zhao, H., & He, Q.-M. (2026). Training neural networks for the GI/G/K queue.Perfor- mance Evaluation,172, 102555. https://doi.org/https://doi.org/10.1016/j.peva.2026.102555
-
[32]
Yoshiaki, I. (2019). Comparison results for M/G/1 queues with waiting and sojourn time deadlines. Journal of Applied Probability,56(2), 524–532. https://doi.org/10.1017/jpr.2019.25 34
discussion (0)
Sign in with ORCID, Apple, or X to comment. Anyone can read and Pith papers without signing in.