REVIEW 5 major objections 4 minor 23 references
Learning the Treatment Effects on FTIR Signals Subject to Multiple Sources of Uncertainties
T0 review · 5 major / 4 minor · reviewed 2026-08-14 · deepseek-v4-flash
Pith's one-line read A two-step statistical procedure estimates a pre-treatment FTIR template and decomposes the post-treatment change into a single modification pattern and a per-sample strength, giving engineers a quantitative readout of plasma treatment…
desk verdict A useful engineering statistics paper whose chemical-interpretation claim outruns the identifiability of the model; worth refereeing after the authors confront the sign and basis ambiguity of g. read the letter →
The pith
A machine-rendered reading of the paper's core claim, the machinery that carries it, and where it could break.
The reading
What carries the argument
The central object is the rank-one treatment-effect model x0 + δ_i g, where x0 is a normalized template spectrum, g is the pattern of modification satisfying g^T x0 = 0, g^T 1 = 0, and ||g|| = 1, and δ_i is the scalar effect strength. The machinery consists of two optimization stages: a constrained eigenvalue problem for the template x0, and an alternating coordinate-descent algorithm for (δ, g) whose inner step is a rank-one singular value decomposition of the corrected post-treatment residuals; a final ℓ1-minimizing rotation g = g̃ cos φ + (1/√p) cos θ sin φ + x0 sin θ sin φ makes the pattern interpretable. This machinery carries the argument because it reduces a high-dimensional spectral comparison to two small identifiable quantities, one describing the shape of the treatment effect and one describing its magnitude at each treatment level.
What would settle it
Fit the model separately to low-, medium-, and high-dose post-treatment spectra and compare the estimated patterns: if g changes shape across dose ranges, or if a model allowing two patterns g_1 and g_2 reduces the held-out residual variance substantially compared with the single-g model, then the single-pattern assumption fails and δ and g do not directly represent the underlying bond changes.
Extended reading notes
Core claim
The paper claims that, despite offset shift and multiplicative error, the pre-treatment FTIR spectra share a common template x0 that can be recovered by a constrained optimization problem, and that every post-treatment spectrum can be written as the template plus δ_i g, where g is a single modification pattern and δ_i is the treatment strength. Step one minimizes the sum of squared distances between aligned pre-treatment spectra and the template, reducing to a constrained eigenvalue problem. Step two, after projecting the corrected post-treatment residuals onto the space orthogonal to the template and the constant vector, obtains g as the leading right singular vector and δ as the corresponding left singular vector times the singular value. The paper further shows that a re-rotation of g within the space spanned by the template, the constant vector, and the initial estimate g̃ can make g sparse and hence interpretable. The authors assert that in the CFRP plasma case study the estimated δ marks the range of effective plasma height and the estimated g matches known chemical bond changes, including O=C=O, N=C=O, N=C=N, C–H, O–H, and N–H.
Load-bearing premise
The entire decomposition rests on assuming that every post-treatment spectrum is the pre-treatment template plus one fixed shape of change g multiplied by a number δ_i, so the chemistry of the treatment is the same at every strength and only its magnitude changes.
Editorial extensions
If this is right
- The estimated vector of effects δ can be used to identify the effective range of plasma height: in the case study, heights beyond about 10 mm produce little further chemical change.
- The pattern of modification g provides a map of treatment-induced chemical changes across frequency bands and identifies plausible bonds created by plasma exposure, including O=C=O, N=C=O, C–H, O–H, and N–H.
- Because offset and scale are treated as nuisance parameters, the framework extends to other spectroscopic measurements with similar uncertainties, including UV-Vis, XRD, and Raman spectroscopy.
- The method replaces visual, subjective inspection of FTIR signals with a quantitative decomposition that can be used to guide plasma parameter selection in composite surface preparation.
- Simulation results indicate that both the template and the modification pattern can be recovered in shape and that δ trends match the simulated ground truth.
Reading between the lines
- Extension: if the single-pattern assumption is only approximately true, δ can still serve as a treatment-ranking score but should not be read as a direct measure of chemical concentration; a natural extension is to allow several patterns g_1, g_2, ... with treatment-dependent weights.
- Extension: the same template-and-decomposition pipeline could test whether treatment effects are additive across repeated or sequential exposures by checking whether total δ adds linearly over passes.
- Extension: the ℓ1 re-rotation step is a heuristic for interpretability; an objective comparison against a quantitative reference library, rather than visual inspection of an absorption table, would sharpen the bond assignments.
- Extension: since δ and g are identified only up to scaling and rotation within the span of the template and constant vector, cross-experiment comparisons would need external anchoring, for example to X-ray photoelectron spectroscopy measurements of surface composition.
Signed reviews
Editorial analysis
A structured set of objections, weighed in public.
Referee Report
Summary. The paper proposes a two-step statistical procedure for analyzing FTIR spectra collected before and after a surface treatment. In Step 1, a template spectrum is estimated from pre-treatment signals by solving a constrained least-squares problem that accounts for multiplicative and offset uncertainties. In Step 2, the post-treatment deviation from the template is decomposed into a modification pattern g and a per-sample effect magnitude δ through an alternating coordinate-descent algorithm and a rank-one SVD approximation. The method is validated on synthetic data and applied to a plasma-treatment case study on CFRP coupons, where the estimated δ is used to infer the effective plasma-height range and the estimated g is used to identify chemical bonds created by plasma exposure.
Significance. The paper addresses a real and practically important problem: quantifying treatment effects on spectroscopic measurements that are corrupted by multiplicative errors and baseline shifts. The statistical model in Eqs. (1) and (3) is reasonable, and the two-step estimation scheme is computationally tractable. If the identifiability issues were resolved, the δ estimate could provide useful engineering guidance on treatment-strength thresholds, and the preprocessing step could be valuable for handheld spectral metrology. However, as presented, the central claim that g identifies specific chemical bonds created by plasma exposure is not supported by the data because g is identifiable only up to a subspace and up to sign, and the final g is selected by a non-convex post-processing criterion among equally fitting representations. The simulation validation is also only qualitative, comparing shapes rather than magnitudes. The work is therefore best viewed as a method for estimating an equivalence class of modification patterns and a relative effect trend, not as a tool for chemical identification.
major comments (5)
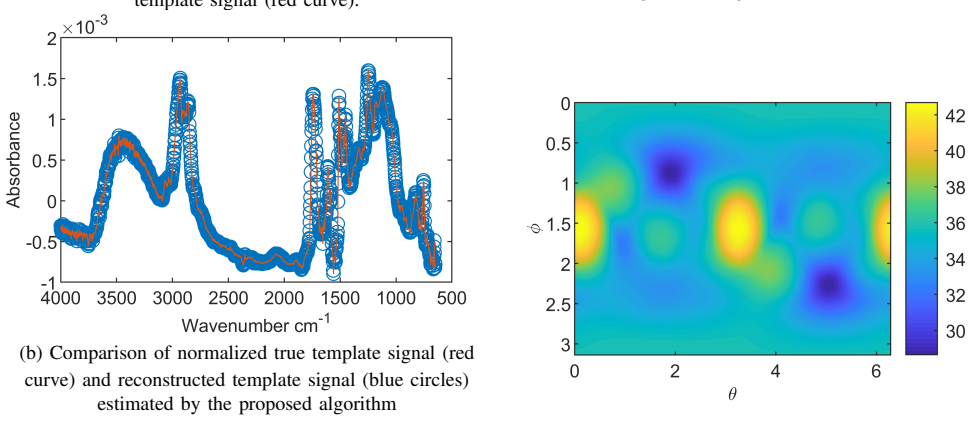
- [Section II-E, Eqs. (8) and (10)] The pattern g is not identifiable from the data: any g' = cosφ·g̃ + (1/√p)cosθ·sinφ·1 + sinθ·sinφ·x0 gives exactly the same post-treatment fit after reparameterizing δ and the alignment factors c_i, d_i. The L1 minimization over (θ, φ) selects one member of this equivalence family based on an interpretability heuristic, not on information in the spectra. Consequently, the chemical-bond claims in Section IV (O=C=O, N=C=O, N=N=N, N=C=N, N=C=S, C–H, O–H, N–H are created) are not consequences of the data alone. Please either provide additional assumptions that identify g, or explicitly reframe the claims as describing a representative of an equivalence class rather than a uniquely recovered pattern.
- [Section IV-B, Figs. 15 and 16] The reported selection of (θ*, φ*) is internally inconsistent with the stated preference. The text says the authors select a local optimum with φ≈0 or φ≈π so that g is mainly determined by g̃, but the real-data optimum is φ*=0.5053 and the simulation optimum is φ*=0.8741, neither of which is close to 0 or π. Additionally, the SVD solution to problem (10) determines g̃ only up to sign; flipping g̃ and δ simultaneously leaves the objective unchanged. The reported sign of δ (positive for small plasma heights) and the interpretation that bonds are 'created' rather than 'destroyed' therefore depend on an unstated sign convention. Please state the convention explicitly and discuss whether the conclusions survive the sign flip.
- [Section II-B, around Eq. (6)] The definition H_i = x0,i x0,i^T (x0,i^T x0,i)^{-1} [I - 11^T/p] is not the projection matrix onto span{x0,i, 1} that the least-squares solution actually requires. The correct projection is [x0,i, 1]([x0,i, 1]^T[x0,i, 1])^{-1}[x0,i, 1]^T. As written, the reduction to f(x0) = Σ ||H_i x0 - x0||^2 and the resulting eigenproblem (6) do not follow. Please correct the formula or show the intermediate algebra in detail.
- [Section III, Figs. 8 and 9] The simulation validation is only qualitative. The text acknowledges that the estimated δ is 'significantly different' from the ground truth and that the magnitude of the estimated g is 'significantly different' from the true g, with only the shapes being similar. Since the paper claims to 'quantify' the treatment effect, please report quantitative error metrics such as correlation, normalized RMSE, or bias after accounting for the non-identifiability, and clarify which aspects of δ and g are recoverable and which are not.
- [Section II-D, Algorithm 1] The block-wise coordinate descent algorithm is not shown to converge to a global optimum of the non-convex problem (8), and no convergence criterion or initialization strategy is specified beyond δ←0 and arbitrary g. Because the objective landscape in Fig. 10 is highly non-convex, the final estimate may depend on initialization. Please provide a convergence analysis or, failing that, a sensitivity analysis over multiple random initializations.
minor comments (4)
- [Section II-B, text after Eq. (5)] The phrase 'the objective of (3)' appears to refer to the wrong equation; it should likely be 'the objective of (5)' or 'the objective in (5)'.
- [Section II-D, Eq. (9)] The notation (c1⊤) ⊙ X is not clearly defined; please state the dimensions of c1, d1, and X and explain the elementwise product operation in a way that a reader can verify Eq. (9) without guessing.
- [Throughout] There are several typographical errors, including 'Ramen spectra' (should be 'Raman spectra') and 'outfit error' (should likely be 'offset error'). These should be corrected in revision.
- [Section IV-A] The elimination of the six post-exposure signals from the 2 mm and 4 mm coupons is described in one sentence; please provide more detail on the criterion used to decide that these signals should be excluded, since this choice directly affects the estimated δ and g.
Circularity Check
No significant circularity in the estimation chain; one minor by-construction element in the sparse-g interpretability step.
-
fitted input called prediction
[Sec. II-E and Sec. IV-B (chemical interpretation)]
"the pattern of modification can be any function obtained from the linear combination of ~g, 1 and x0. ... it is desirable that g be close to zero in most elements. For this reason, we aim to find theta and phi to minimize G(theta,phi)=||g(theta,phi)||_1 ... The pattern of modification g in the rest frequency regions tends to be around zero, which means that plasma does not change the chemical bonds whose characteristic wavenumbers are in those regions."
The post-treatment fit is invariant to replacing g by any element of span{~g,1,x0} (the paper says so explicitly), so the L1 minimization in Sec. II-E is an interpretability convention, not a data-driven estimator. The later statement that the rest frequency regions are unchanged because g is near zero there is therefore partly imposed by the chosen objective rather than learned from the spectra. The sign of the SVD solution for ~g is also arbitrary, so the 'bonds created' versus 'bonds destroyed' reading is a convention as well. This affects the chemical-bond interpretation but does not make the central template/effect estimation circular.
full rationale
The main derivation chain is self-contained. Step 1 estimates x0 from pre-treatment spectra by a derived eigenproblem, and Step 2 estimates ~g and delta from post-treatment spectra by an SVD, with the simulation section validating recovery against known ground truth. The only self-citation, [19], is a comparison rather than a load-bearing uniqueness or modeling assumption. The paper openly acknowledges the non-identifiability of g in Sec. II-E and then selects a sparse representative by an explicit L1 criterion; the subsequent interpretation that flat regions correspond to unaffected bonds is a mild by-construction consequence of that criterion, not a fully independent inference. Non-identifiability and sign ambiguity are better classified as correctness/identifiability concerns than as circularity, and they do not reduce the δ-trend or the simulation validation to the inputs. Score 2 reflects this minor by-construction element while recognizing that the statistical estimation is not circular.
Assumptions & free parameters
free parameters (3)
- per-signal multiplicative factors a0,i and a1,i
- per-signal offset coefficients b0,i and b1,i
- pattern-selection angles theta and phi =
Real data: theta=0.0009, phi=0.5053; simulation: theta=1.8972, phi=0.8741
assumptions (5)
- domain assumption FTIR measurement noise is additive Gaussian on the clean signal before scaling and offset: x = a(x0+epsilon)+b1, with epsilon ~ N(0, sigma^2 I)
- domain assumption A common template x0 underlies all pre-treatment spectra from the same material
- domain assumption A single shared pattern g describes the treatment-induced change at all strengths; only the magnitude delta_i varies
- ad hoc to paper The pattern g is identifiable only up to span{1, x0}, and the final g is selected by minimizing L1 over the equivalent family
- standard math Standard results from matrix algebra, including the constrained eigen-problem solution (Golub 1973) and rank-1 SVD truncation
Cite this review
Pith. "Pith review of Learning the Treatment Effects on FTIR Signals Subject to Multiple Sources of Uncertainties." pith.science (2026). https://pith.science/paper/IQ42FEKW
@misc{pith2026190811001,
  author       = {Pith},
  title        = {Pith review of: Learning the Treatment Effects on FTIR Signals Subject to Multiple Sources of Uncertainties},
  year         = {2026},
  howpublished = {\url{https://pith.science/paper/IQ42FEKW}},
  note         = {Machine review of arXiv:1908.11001}
}
abstract
Fourier-transform infrared spectroscopy (FTIR) is a versatile technique for characterizing the chemical composition of the various uncertainties, including baseline shift and multiplicative error. This study aims at analyzing the effect of certain treatment on the FTIR responses subject to these uncertainties. A two-step method is proposed to quantify the treatment effect on the FTIR signals. First, an optimization problem is solved to calculate the template signal by aligning the pre-treatment FTIR signals. Second, the effect of treatment is decomposed as the pattern of modification $\mathbf{g}$ that describes the overall treatment effect on the spectra and a vector of effect $\boldsymbol{\delta}$ that describes the degree of modification. $\mathbf g$ and $\boldsymbol{\delta}$ are solved by another optimization problem. They have explicit engineering interpretations and provide useful information on how the treatment effect change the surface chemical components. The effectiveness of the proposed method is first validated in a simulation. In a real case study, it's used to investigate how the plasma exposure applied at various heights affects the FTIR signal which indicates the change of the chemical composition on the composite material. The vector of effects indicates the range of effective plasma height, and the pattern of modification matches existing engineering knowledge well.
Figures


Figures from the paper (9 more)




Reference graph
Works this paper leans on
-
[1]
A. Rein and P. Tang, “Analysis of plasma treated carbon fiber reinforced polymer (CFRP) composites by portable fourier transform infrared spectroscopy (FTIR),” Agilent Technologies Application Note , 2014
work page 2014
-
[2]
Bassan, Light scattering during infrared spectroscopic measurements of biomedical samples
P. Bassan, Light scattering during infrared spectroscopic measurements of biomedical samples . PhD thesis, The University of Manchester (United Kingdom), 2011
work page 2011
-
[3]
FTIR spectroscopy for carbon family study,
V . T ¸ ucureanu, A. Matei, and A. M. Avram, “FTIR spectroscopy for carbon family study,” Critical Reviews in Analytical Chemistry , vol. 46, no. 6, pp. 502–520, 2016
work page 2016
-
[4]
Detection of exposure damage in composite materials using fourier transform infrared technology,
R. Duvall, D. Roach, and F. Center, “Detection of exposure damage in composite materials using fourier transform infrared technology,” FAA Airworthiness Assurance Center , 2010
work page 2010
-
[5]
Extended multiplicative signal correction in vibrational spectroscopy, a tutorial,
N. K. Afseth and A. Kohler, “Extended multiplicative signal correction in vibrational spectroscopy, a tutorial,” Chemometrics and Intelligent Laboratory Systems, vol. 117, pp. 92–99, 2012
work page 2012
-
[6]
S. H. Han, H. J. Oh, and S. S. Kim, “Evaluation of fiber surface treatment on the interfacial behavior of carbon fiber-reinforced polypropylene composites,”Composites Part B: Engineering, vol. 60, pp. 98–105, 2014
work page 2014
-
[7]
Carbon fiber surfaces and composite interphases,
M. Sharma, S. Gao, E. M ¨ader, H. Sharma, L. Y . Wei, and J. Bijwe, “Carbon fiber surfaces and composite interphases,” Composites Science and Technology, vol. 102, pp. 35–50, 2014
work page 2014
-
[8]
Surface treatment of carbon fibers-a review,
S. Tiwari and J. Bijwe, “Surface treatment of carbon fibers-a review,” Procedia Technology, vol. 14, pp. 505–512, 2014
work page 2014
Show all 23 references
-
[9]
A review to recent developments in modification of carbon fiber electrodes,
R. M. Kakhki, “A review to recent developments in modification of carbon fiber electrodes,” Arabian Journal of Chemistry , 2014
2014
-
[10]
Effect of plasma surface treatment of poly (dimethylsiloxane) on the permeation of pharmaceutical compounds,
L. J. Waters, C. V . Finch, A. M. H. Bhuiyan, K. Hemming, and J. C. Mitchell, “Effect of plasma surface treatment of poly (dimethylsiloxane) on the permeation of pharmaceutical compounds,” Journal of pharma- ceutical analysis, vol. 7, no. 5, pp. 338–342, 2017
2017
-
[11]
Surface characterization of plasma-modified polyethylene by contact angle experiments and ATR- FTIR spectroscopy,
N. De Geyter, R. Morent, and C. Leys, “Surface characterization of plasma-modified polyethylene by contact angle experiments and ATR- FTIR spectroscopy,” Surface and Interface Analysis: An International Journal devoted to the development and application of techniques for the an...
2008
-
[12]
Surface characteristics of polypropylene film treated by an atmospheric pressure plasma,
O. J. Kwon, S. Tang, S. W. Myung, N. Lu, and H. S. Choi, “Surface characteristics of polypropylene film treated by an atmospheric pressure plasma,” Surface and Coatings Technology , vol. 192, no. 1, pp. 1–10, 2005
2005
-
[13]
Plasma assisted hydrophobic coatings on porous materials: influence of plasma parameters,
S. M. Mukhopadhyay, P. Joshi, S. Datta, J. Zhao, and P. France, “Plasma assisted hydrophobic coatings on porous materials: influence of plasma parameters,” Journal of Physics D: Applied Physics , vol. 35, no. 16, p. 1927, 2002
1927
-
[14]
Plasma surface modification of polymers for improved adhesion: a critical review,
E. Liston, L. Martinu, and M. Wertheimer, “Plasma surface modification of polymers for improved adhesion: a critical review,” Journal of adhesion science and technology , vol. 7, no. 10, pp. 1091–1127, 1993
1993
-
[15]
Quantitative application of in situ ATR-FTIR and raman spectroscopy in crystallization processes,
J. Cornel, C. Lindenberg, and M. Mazzotti, “Quantitative application of in situ ATR-FTIR and raman spectroscopy in crystallization processes,” Industrial & engineering chemistry research , vol. 47, no. 14, pp. 4870– 4882, 2008
2008
-
[16]
Thermal degradation of polyaniline films prepared in solutions of strong and weak acids and in water–FTIR and raman spectroscopic studies,
I. ˇSedˇenkov´a, M. Trchova, and J. Stejskal, “Thermal degradation of polyaniline films prepared in solutions of strong and weak acids and in water–FTIR and raman spectroscopic studies,” Polymer Degradation and Stability, vol. 93, no. 12, pp. 2147–2157, 2008
2008
-
[17]
Composite thermal damage mea- surement with handheld fourier transform infrared spectroscopy,
H. Tucker, T. Ashley, and B. Flinn, “Composite thermal damage mea- surement with handheld fourier transform infrared spectroscopy,” tech. rep., University of Washington, 10 2012
2012
-
[18]
Ramsay, Functional data analysis (Encyclopedia of Statistics in Behavioral Science)
J. Ramsay, Functional data analysis (Encyclopedia of Statistics in Behavioral Science). Wiley Online Library, 2005
2005
-
[19]
Generalized wavelet shrinkage of inline raman spectroscopy for quality monitoring of continuous manufacturing of carbon nanotube buckypaper,
X. Yue, K. Wang, H. Yan, J. G. Park, Z. Liang, C. Zhang, B. Wang, and J. Shi, “Generalized wavelet shrinkage of inline raman spectroscopy for quality monitoring of continuous manufacturing of carbon nanotube buckypaper,” IEEE Transactions on Automation Science and Engineer- in...
2017
-
[20]
Some modified matrix eigenvalue problems,
G. H. Golub, “Some modified matrix eigenvalue problems,” Siam Review, vol. 15, no. 2, pp. 318–334, 1973
1973
-
[21]
G. H. Golub and C. F. Van Loan, Matrix computations , vol. 3. JHU press, 2012
2012
-
[22]
Contact angle measurements and surface analysis of atmo- spheric pressure plasma treated polypropylene,
B. Labs, “Contact angle measurements and surface analysis of atmo- spheric pressure plasma treated polypropylene,” tech. rep., BTG Labs, 2013
2013
-
[23]
spectra data online (FTIR/Ramen search)
Thermo Fisher Scientific, Inc., “spectra data online (FTIR/Ramen search).” http://ftirsearch.com/, 2001. Hongzhen Tian received the B.S. degree in Energy and Power Engineering System and Its Automation from the Xian Jiaotong University, Xian, China, in 2017. She is currently pu...
2001
Reviewed August 14, 2026 · model on record in the stance chip above.
Discussion (0). Continue with ORCID to comment.