REVIEW 4 major objections 4 minor 22 references
Fluidity in Domain Walls in Dilute $^3$He-$^4$He Films on Graphite: Possible 1D Fermi Fluid and Dirac Fermions in Helium Film
T0 review · 4 major / 4 minor · reviewed 2026-08-14 · deepseek-v4-flash
Pith's one-line read This paper reports heat-capacity measurements showing that helium-3 atoms dissolved in dense helium-4 films on graphite remain mobile inside fluid domain-wall superstructures, behaving as a one-dimensional Fermi fluid or as Dirac…
desk verdict New 3He-4He film heat capacity data show a real T^2 regime, but the Dirac-fermion explanation has an internal conflict with the observed 3He-number dependence. read the letter →
The pith
A machine-rendered reading of the paper's core claim, the machinery that carries it, and where it could break.
The reading
What carries the argument
The load-bearing object is the domain-wall (DW) superstructure of the $^4$He monolayer: striped walls (SDWs) at lower densities and honeycomb walls (HDWs) at higher densities, with the walls themselves fluid while the domains between them remain in the $\sqrt{3}\times\sqrt{3}$ commensurate solid. Within these walls the $^3$He atoms move in one dimension (striped case) or on a honeycomb lattice (honeycomb case), and in the honeycomb case the lattice gives a linear dispersion at its Dirac points. The quantitative link is the formula $C = \gamma_2 T^2$ for a two-dimensional gas of Dirac fermions, from which the author estimates the $^3$He speed using the coefficient $\gamma_2$ and the known surface area; the disappearance of the $T^2$ term near $9.1\ \mathrm{nm}^{-2}$ marks the upper-density limit of the honeycomb wall structure.
What would settle it
Look for the predicted wall structure directly: if diffraction or tunneling measurements on $^4$He films on graphite in the $7.2$ to $9.1\ \mathrm{nm}^{-2}$ range find no honeycomb domain-wall order (especially the regular $4\times4$ periodicity near $8.4\ \mathrm{nm}^{-2}$), the Dirac-fermion interpretation fails. Alternatively, measure the heat capacity of dilute $^3$He in $^4$He films under conditions where domain walls are known to be absent; a surviving $T^2$ term would rule out the paper's mechanism.
Extended reading notes
Core claim
The central claim is that, at total areal densities between about $7.2$ and $9.1\ \mathrm{nm}^{-2}$, the $^4$He film on graphite arranges itself into fluid domain-wall superstructures, and the dissolved $^3$He atoms are confined to these walls rather than moving over the whole surface. The measured heat capacity then reflects the motion inside the walls: a linear-in-$T$ contribution with a high-temperature saturation near $N_3 k_\mathrm{B}/2$ in the striped-wall regime, and a $T^2$ term with coefficient proportional to the $^3$He concentration in the honeycomb-wall regime. The author takes the $T^2$ dependence as the thermodynamic signature of Dirac fermions—particles whose energy grows linearly with momentum—moving along the honeycomb lattice of walls, and extracts a characteristic $^3$He speed that peaks near $160\ \mathrm{m/s}$ at the density where the honeycomb periodicity is most regular.
Load-bearing premise
The claim depends on the assumption that $^4$He films at total areal densities of about $7.2$ to $9.1\ \mathrm{nm}^{-2}$ form ordered striped or honeycomb domain-wall superstructures whose walls remain fluid, and that the added $^3$He atoms are confined to those walls; this structure is not directly observed, so if the film instead forms an incommensurate solid or disordered defects, the $T^2$ heat capacity would need another explanation.
Editorial extensions
If this is right
- In the striped-wall density regime, the observed saturation of the heat capacity near $N_3 k_\mathrm{B}/2$ (half the two-dimensional value) directly evidences one-dimensional confinement of the $^3$He atoms.
- Above about $7.2\ \mathrm{nm}^{-2}$, the $T^2$ heat capacity identifies the honeycomb-wall regime; its coefficient $\gamma_2$ scales with the amount of $^3$He, so the effect is carried by the impurities, not by the $^4$He phonons.
- The disappearance of the $T^2$ term around $9.1\ \mathrm{nm}^{-2}$ gives a thermodynamic marker for the collapse of the honeycomb domain-wall structure into an incommensurate solid.
- The estimated $^3$He speed is far larger than the Fermi velocity of a two-dimensional $^3$He film, consistent with the linear Dirac-like dispersion proposed for the honeycomb walls.
Reading between the lines
- If the domain-wall fluidity picture holds, dissolved fermionic impurities act as a sensor of the adsorption structure: heat-capacity measurements of dilute $^3$He could map the phase diagram of other film-substrate systems without direct structural probes.
- The dependence of the extracted speed on the wall periodicity suggests that the Dirac-like dispersion might be tunable by choosing substrates or densities that favor different honeycomb periodicities; the paper notes the most regular structure at the $4\times4$ periodicity near $8.4\ \mathrm{nm}^{-2}$.
- A direct test would be to measure spin relaxation or transport of the $^3$He atoms in the same density range: one-dimensional Fermi-fluid motion and Dirac-fermion motion make different predictions for NMR relaxation times, so the model could be checked without invoking the unobserved wall structure.
Signed reviews
Editorial analysis
A structured set of objections, weighed in public.
Referee Report
Summary. The paper reports heat-capacity measurements of dilute 3He atoms dissolved in submonolayer 4He films adsorbed on graphite. The data show that at total areal densities above the √3×√3 commensurate density the 3He contribution becomes finite, and above about 7.2 nm^-2 it is approximately proportional to T^2, with a coefficient that depends on the 3He coverage and varies non-monotonically with total density. The author proposes that the 4He film forms striped or honeycomb domain-wall superstructures whose interiors are fluid, that the 3He atoms are confined to these walls, and that they behave as a one-dimensional Fermi fluid in the striped case and as Dirac fermions in the honeycomb case. The T^2 heat capacity is presented as evidence for the Dirac-fermion interpretation, and an estimate of the effective 3He velocity is extracted from the T^2 coefficient.
Significance. If established, the paper would offer a new experimental route to one-dimensional and Dirac-like fermion physics in a helium-film platform, and would use dilute 3He as a sensitive probe of the domain-wall structure of 4He films. The experimental design is clever, and the paper carefully excludes several prosaic backgrounds: phonon contributions of 4He, 3He nuclear-spin entropy, and phase-separation heat release. The qualitative observation of a finite, coverage-dependent heat capacity in a density regime where the film is thought to be solid is itself of interest. However, the central Dirac-fermion interpretation currently rests on a small number of assumptions and contains an internal mismatch with the coverage dependence that the paper advertises as a key observation. The paper is therefore a promising experimental report whose interpretation needs substantial strengthening.
major comments (4)
- [Dirac interpretation, Fig. 4] The central interpretive claim is not consistent with the reported dependence of γ2 on ρ3. For massless Dirac fermions at fixed honeycomb area A and velocity v, the low-temperature heat capacity is C = (9gζ(3)k_B^3 A/(2πℏ^2 v^2)) T^2 when |μ| << k_B T; this coefficient contains no N3. The data in Fig. 4 instead show γ2 approximately proportional to ρ3 at a given total density. If the 3He number is doubled, an undoped Dirac system at fixed geometry has the same γ2, while a doped system develops a T-linear contribution for k_B T << |μ|. Reproducing the observed γ2 ∝ ρ3 while retaining a T^2 law therefore requires an unspecified dependence of A or v on ρ3, which is a modification of the model rather than a prediction of it. Since this coverage scaling is highlighted as a key observation, the Dirac interpretation as stated cannot explain the central dataset.
- [Speed estimate and Fig. 5] The printed formula v3 = (9gζ(3)k_B^3 A/(2πℏγ2))^{1/2} is dimensionally inconsistent: k_B^3 A/(ℏγ2) has units of J m^2/s, not m^4/s^2, and the denominator should contain ℏ^2. After this correction, v3 is obtained algebraically from the same γ2 that is plotted in Fig. 4, so the maxima in Fig. 5 and the apparent saturation near 160 m/s are a reparametrization of the fit coefficient, not an independent prediction. Moreover, the extraction assumes the Dirac dispersion that the paper is trying to establish; no consistency check from another observable, such as a density-of-states or magnetic-field response, is provided.
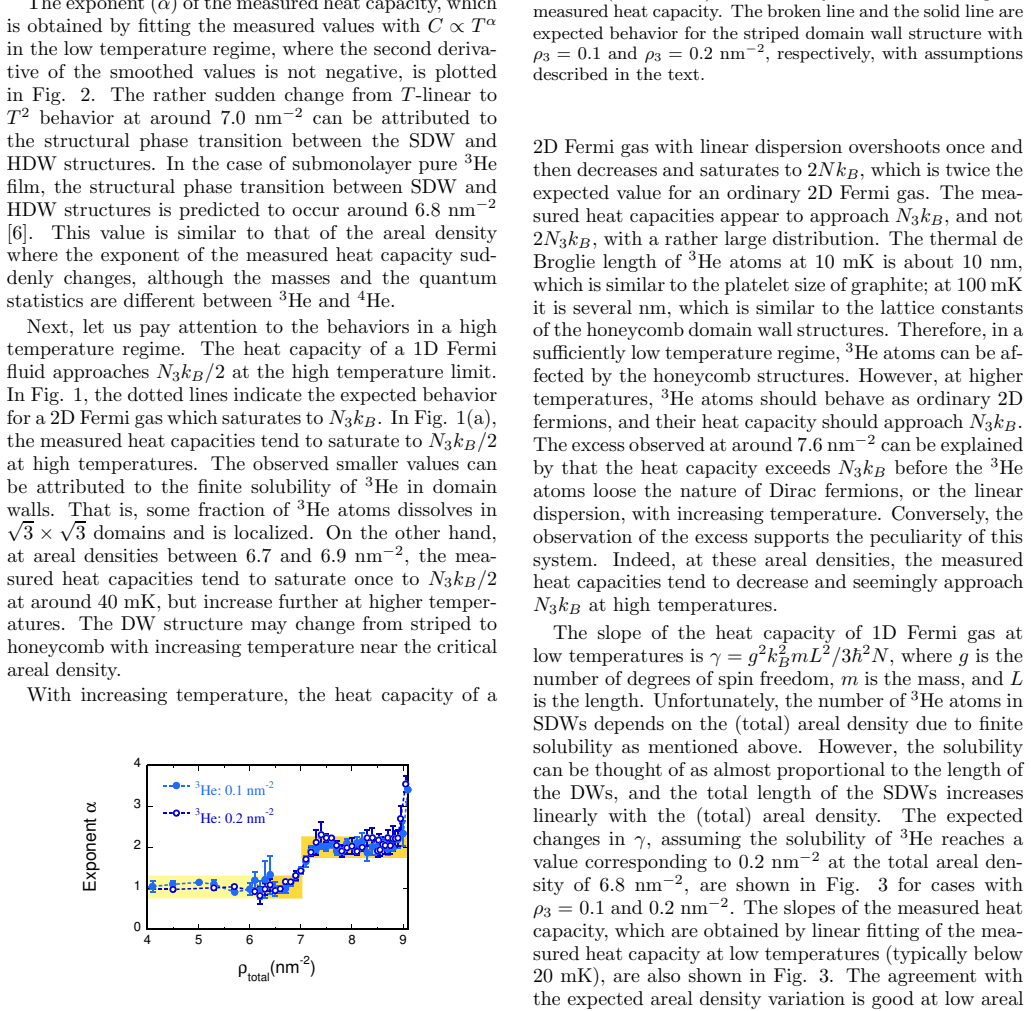
- [Exponent determination, Fig. 2] The T^2 law is the entire basis for the Dirac-fermion claims, but its determination is not robustly documented. The text states that the exponent α is obtained by fitting C ∝ T^α in the low-temperature regime 'where the second derivative of the smoothed values is not negative.' The smoothing procedure, fitting window, and number of points are not specified, and no error bars are shown on α or γ2. Restricting the fit to regions with non-negative second derivative is a selection criterion that can bias the extracted exponent toward 2; the apparent sharp change from approximately T-linear to T^2 at 7.0–7.2 nm^-2 in Fig. 2 should be demonstrated with a well-defined and robustness-checked procedure.
- [Solubility calibration in Fig. 3 and structural assumption] The agreement shown in Fig. 3 for the striped-domain-wall model rests on an assumed solubility calibration. The text says that the expected γ curves are calculated 'assuming the solubility of 3He reaches a value corresponding to 0.2 nm^-2 at the total areal density of 6.8 nm^-2.' This value is chosen without independent input, so the agreement in Fig. 3 is partly built into the model rather than being a test of it. In addition, the entire interpretation depends on the existence of striped and honeycomb domain-wall superstructures that are not directly observed; the paper cites theoretical predictions and explicitly calls the structure 'plausible.' A concrete test distinguishing the domain-wall model from other confining mechanisms is needed before the conclusion that the observations 'strongly suggest' these structures can be supported.
minor comments (4)
- [Abstract and text typos] There are several typographical errors, including 'attentions' (should be 'attention'), 'adsoprtion' (should be 'adsorption'), 't hat' (should be 'that'), and 'loose' (should be 'lose').
- [Fig. 4] The two vertical scales in Fig. 4 are said to differ according to the 3He amount, but the scaling factor is not stated; the reader cannot tell whether the plotted curves represent the raw γ2 values or a rescaled quantity.
- [High-temperature excess discussion] The discussion of the heat capacity exceeding N3kB near 7.6 nm^-2 is qualitative; the text says the excess 'can be explained' but does not quantify the excess, its temperature range, or how strongly it constrains the model.
- [Incommensurate-solid discrepancy] The observation that the T^2 term disappears near 9.1 nm^-2 is stated alongside the fact that domain-wall collapse is expected at 7.9–8.4 nm^-2; the discrepancy is noted but not addressed, which weakens the density-axis correspondence in Figs. 4 and 5.
Circularity Check
Quantitative support for the Dirac and 1D Fermi interpretations is partly circular: the extracted 3He speed is a reparametrization of the fitted T^2 coefficient, and the SDW slope comparison uses a solubility normalization chosen to match the data.
-
fitted input called prediction
[Definition of γ2 and v3, paragraphs preceding Figs. 4 and 5]
"The coefficients of the T^2 term, γ2 is obtained by fitting the measured values with C = γ2T^2 at a low temperature regime (typically below 30 mK). ... The speed of 3He atoms, v3, can be estimated from γ2 with the following formula, v3=(9gζ(3)k3BA/2πℏγ2)1/2, assuming that interactions between 3He atoms are weak, and where g = 4 is the number of degrees of freedom..."
v3 is not independently predicted; the formula is the Dirac heat-capacity relation inverted, so v3 is defined as the velocity that makes the model reproduce the already-fitted γ2. Any measured T^2 coefficient can be converted into a v3 of this form. The later conclusions — velocity maxima at the 4×4 HDW structure, velocity much higher than the 2D Fermi value, and apparent saturation near 160 m/s — are thus properties of the fit parameter, not separate tests of the Dirac-fermion hypothesis. The quantitative agreement is forced by construction rather than by independent input.
-
fitted input called prediction
[Discussion of γ and Fig. 3 (SDW regime)]
"The expected changes in γ, assuming the solubility of 3He reaches a value corresponding to 0.2 nm−2 at the total areal density of 6.8 nm−2, are shown in Fig. 3 for cases with ρ3 = 0.1 and 0.2 nm−2. ... The agreement with the expected areal density variation is good at low areal densities."
The 'expected' 1D Fermi-fluid curve is normalized by assuming the 3He solubility reaches 0.2 nm−2 at 6.8 nm−2, a value taken from the same experimental series being compared. This calibration sets the vertical scale of the predicted γ curve; the comparison then shows self-consistency of the assumed solubility, not an independent quantitative prediction of the model. The linear-with-density trend is a milder independent element, but the purported agreement is partly built into the assumed normalization.
full rationale
The paper's qualitative proposal — that 3He atoms in fluid domain walls give C∝T^2 via 1D or Dirac physics — has independent content: the T^2 power law is a nontrivial fingerprint of massless Dirac fermions and is not used to define the model. However, the quantitative checks are not independent. The Dirac velocity v3 is obtained by inverting the same C=γ2T^2 relation used to fit the data, so Fig. 5 is a reparametrization of the fitted coefficient; its features are therefore not confirmatory. Similarly, the SDW γ comparison in Fig. 3 uses an assumed solubility anchor at 6.8 nm−2 that is calibrated to the measured series, making the 'expected' curve partly data-normalized. These are the circular elements. The structural assumption of HDW/SDW superstructures relies on external theory [16] and self-citations [5,6], but this is not circular because the cited predictions predate the present data. The paper is also honest that the Dirac interpretation is 'one possible explanation' and that 1D Luttinger evidence is not yet obtained. Overall, the central inference is not fully forced by a self-citation chain, but its quantitative support reduces in part to fitted parameters, giving a partial-circularity score of 6.
Assumptions & free parameters
free parameters (2)
- 3He solubility calibration in SDW model =
0.2 nm^-2 at total density 6.8 nm^-2
- Dirac degeneracy g =
4
assumptions (6)
- domain assumption Existence of domain wall superstructures in 4He films on graphite
- domain assumption Fluidity inside domain walls
- domain assumption 3He confinement to domain walls
- domain assumption SDW to HDW transition at about 6.8 nm^-2 applies to 4He films
- domain assumption Weak interactions among 3He atoms
- standard math Standard heat capacity formulas for 1D Fermi gas and 2D Dirac fermions
invented entities (1)
-
3He quasiparticles with linear (Dirac) dispersion in honeycomb domain walls
Cite this review
Pith. "Pith review of Fluidity in Domain Walls in Dilute $^3$He-$^4$He Films on Graphite: Possible 1D Fermi Fluid and Dirac Fermions in Helium Film." pith.science (2026). https://pith.science/paper/IS2DJA4W
@misc{pith2026190801991,
  author       = {Pith},
  title        = {Pith review of: Fluidity in Domain Walls in Dilute $^3$He-$^4$He Films on Graphite: Possible 1D Fermi Fluid and Dirac Fermions in Helium Film},
  year         = {2026},
  howpublished = {\url{https://pith.science/paper/IS2DJA4W}},
  note         = {Machine review of arXiv:1908.01991}
}
abstract
The heat capacity of a small amount of $^3$He atoms dissolved in submonolayer $^4$He film has been measured. The measured heat capacity is finite and suggests that $^3$He atoms are mobile at an areal density regime higher than that of the $\sqrt{3}\times\sqrt{3}$ phase, where $^4$He films are believed to be solid. At higher areal densities, the measured heat capacity is proportional to $T^2$ and depends on the amounts of $^3$He atoms. These behaviors are anomalous to that of a two-dimensional Fermi fluid, and cannot be explained by uniform melting of $^4$He films. One possible explanation for these anomalous behaviors is that helium atoms exhibit fluidity only inside the domain walls of the adsorption structure, and the dissolved $^3$He atoms gather into them and behave as a one-dimensional Fermi fluid or as Dirac fermions, depending on the structure of the domain walls. The behaviors of the measured heat capacity strongly suggest this possibility.
Figures


Figures from the paper (2 more)


Reference graph
Works this paper leans on
-
[1]
This behavior suggests that the 3He atoms are mobile, although at this areal density regime, the 4He film is be- lieved to be solid. Furthermore, at the higher areal densi- ties than 7.2 nm − 2 the measured heat capacity is propor- tional to T 2 (as shown in Fig. 1(b)) and the magnitude of the measured heat capacity is almost proportional to the amount of ...
work page 2000
-
[2]
A. H. Castro Neto, F. Guinea, N. M. R. Peres, K. S. Novoselov, and K. Geim, Rev. Mod. Phys., 81, 109 (2009)
work page 2009
-
[3]
H. Godfrin and H. J. Lauter, Progress in Low Tempera- ture Physics, vol XIV, edited by W. P. Halperin (Elsevier, Amsterdam, 1995), Chap. 4, pp. 213–320
work page 1995
- [4]
- [5]
-
[6]
Masashi Morishita and Takeo Takagi, Phys. Rev. Lett., 87, 185301 (2001)
work page 2001
-
[7]
Masashi Morishita and Takeo Takagi, Physica B, 329- 333, 137 (2003)
work page 2003
-
[8]
F. Ziouzia, J. Ny´ eki, B. Cowan and J. Saunders, Physica B, 329-333, 252 (2003)
work page 2003
Show all 22 references
-
[9]
Greywall and Paul A
Dennis S. Greywall and Paul A. Busch, Phys. Rev. Lett., 5 67, 3535 (1991)
1991
-
[10]
D. S. Greywall, Phys. Rev. B, 47, 309 (1993)
1993
-
[11]
Low Temp
Masashi Morishita, J. Low Temp. Phys., 171, 664 (2013)
2013
-
[12]
Morishita and H
M. Morishita and H. Nagatani and H. Fukuyama, Phys. Rev. B, 65, 104524 (2002)
2002
-
[13]
Low Temp
Masashi Morishita, J. Low Temp. Phys., 183, 245 (2016)
2016
-
[14]
Low Temp
Masashi Morishita, J. Low Temp. Phys., 187, 453 (2017)
2017
-
[15]
Casey, H
A. Casey, H. Patel, J. Ny´ eki, B. P. Cowan and J. Saun- ders, Phys. Rev. Lett., 98, 216401 (2007)
2007
-
[16]
Matsumoto, D
Y. Matsumoto, D. Tsuji, S. Murakawa, H. Akisato, H. Kambara, and H. Fukuyama, J. Low Temp. Phys., 138, 271 (2005)
2005
-
[17]
Philippe Corboz, Massimo Boninsegni, Lode Pollet, and Matthias Troyer, Phys. Rev. B, 78, 245414 (2008)
2008
-
[18]
M. H. W. Chan, R. B. Hallock and L. Reatto, J. Low Temp. Phys., 172, 317 (2013)
2013
-
[19]
Leticia Tarruell, Daniel Greif, Thomas Uehlinger, Gre gor Jotzu, and Tilman Esslinger, Nature, 483, 302 (2012)
2012
-
[20]
Gomes, Warren Mar, Wonhee Ko, Fran- cisco Guinea, and Hari C
Kenjiro K. Gomes, Warren Mar, Wonhee Ko, Fran- cisco Guinea, and Hari C. Manoharan, Nature, 483, 306 (2012)
2012
-
[21]
Takako Konoike, Kazuhito Uchida, and Toshihito Osada, J. Phys. Soc. Jpn., 81, 043601 (2012)
2012
-
[22]
Oscar Vafek, Phys. Rev. Lett., 98, 216401 (2007)
2007
Reviewed August 14, 2026 · model on record in the stance chip above.
Discussion (0). Continue with ORCID to comment.