REVIEW 3 major objections 5 minor 41 references
Heterogeneities in electricity grids strongly enhance non-Gaussian features of frequency fluctuations under stochastic power input
T0 review · 3 major / 5 minor · reviewed 2026-08-14 · deepseek-v4-flash
Pith's one-line read Wind-driven grid frequency fluctuations have Gaussian cores and exponential tails whose size is set by grid structure, not just wind strength.
desk verdict A well-constructed simulation study whose central tail-enhancement claim is undermined by pooling all nodes into one histogram; the variance-mixture artifact is real and needs node-resolved analysis before the conclusion can stand. read the letter →
The pith
A machine-rendered reading of the paper's core claim, the machinery that carries it, and where it could break.
The reading
What carries the argument
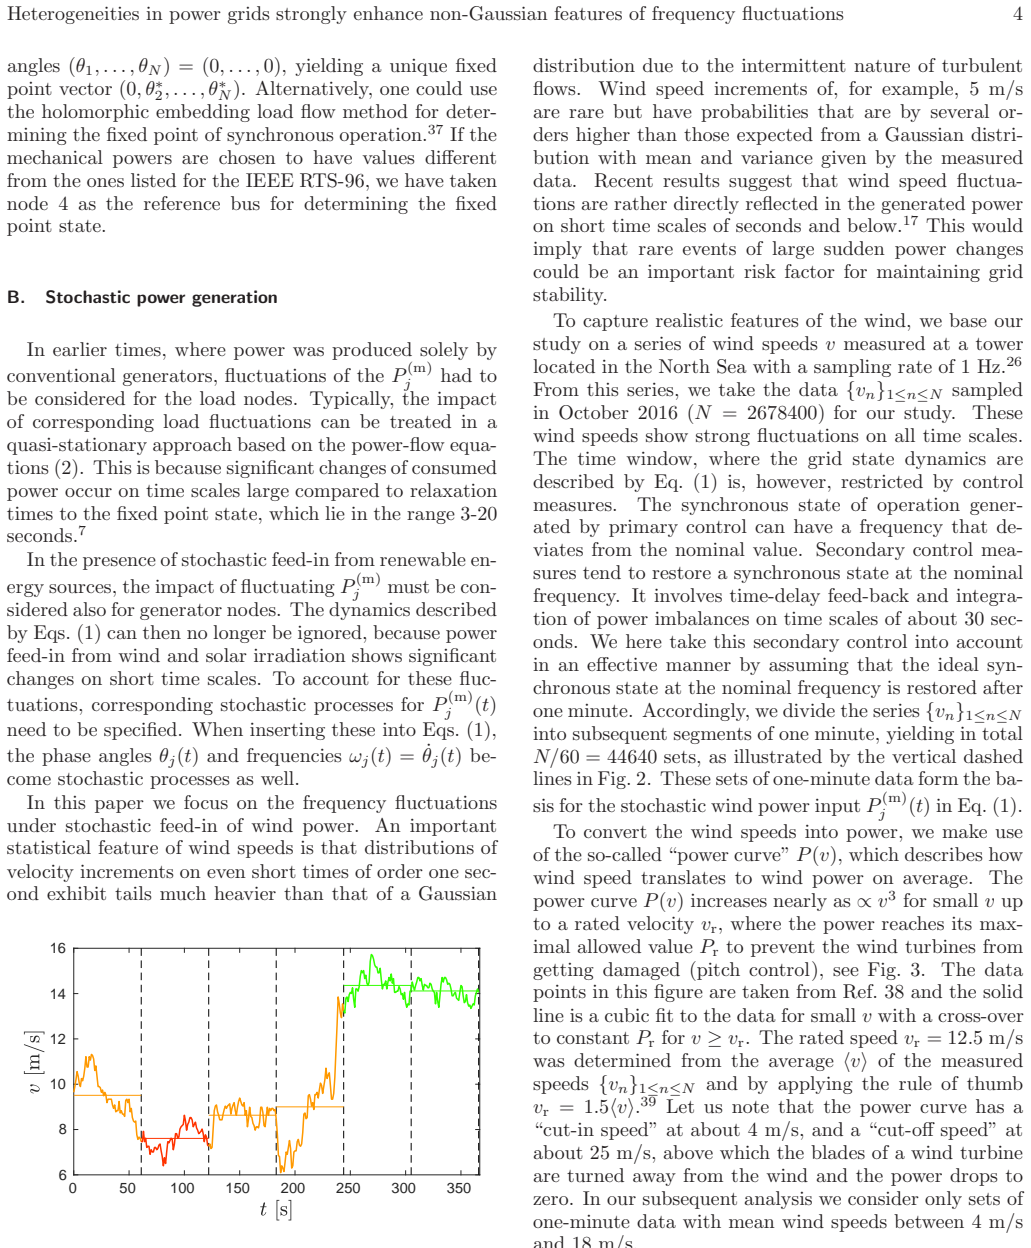
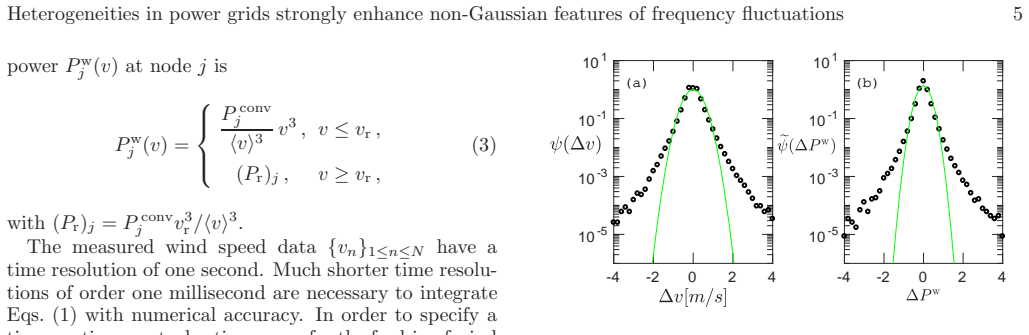
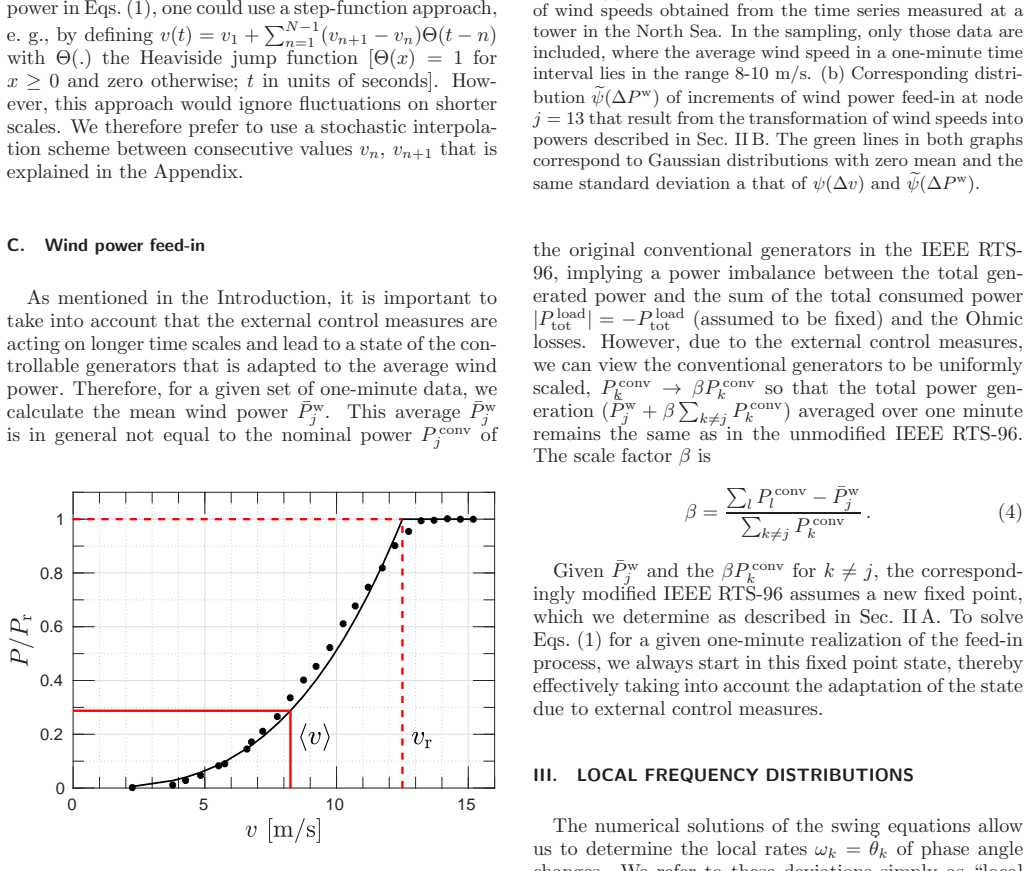
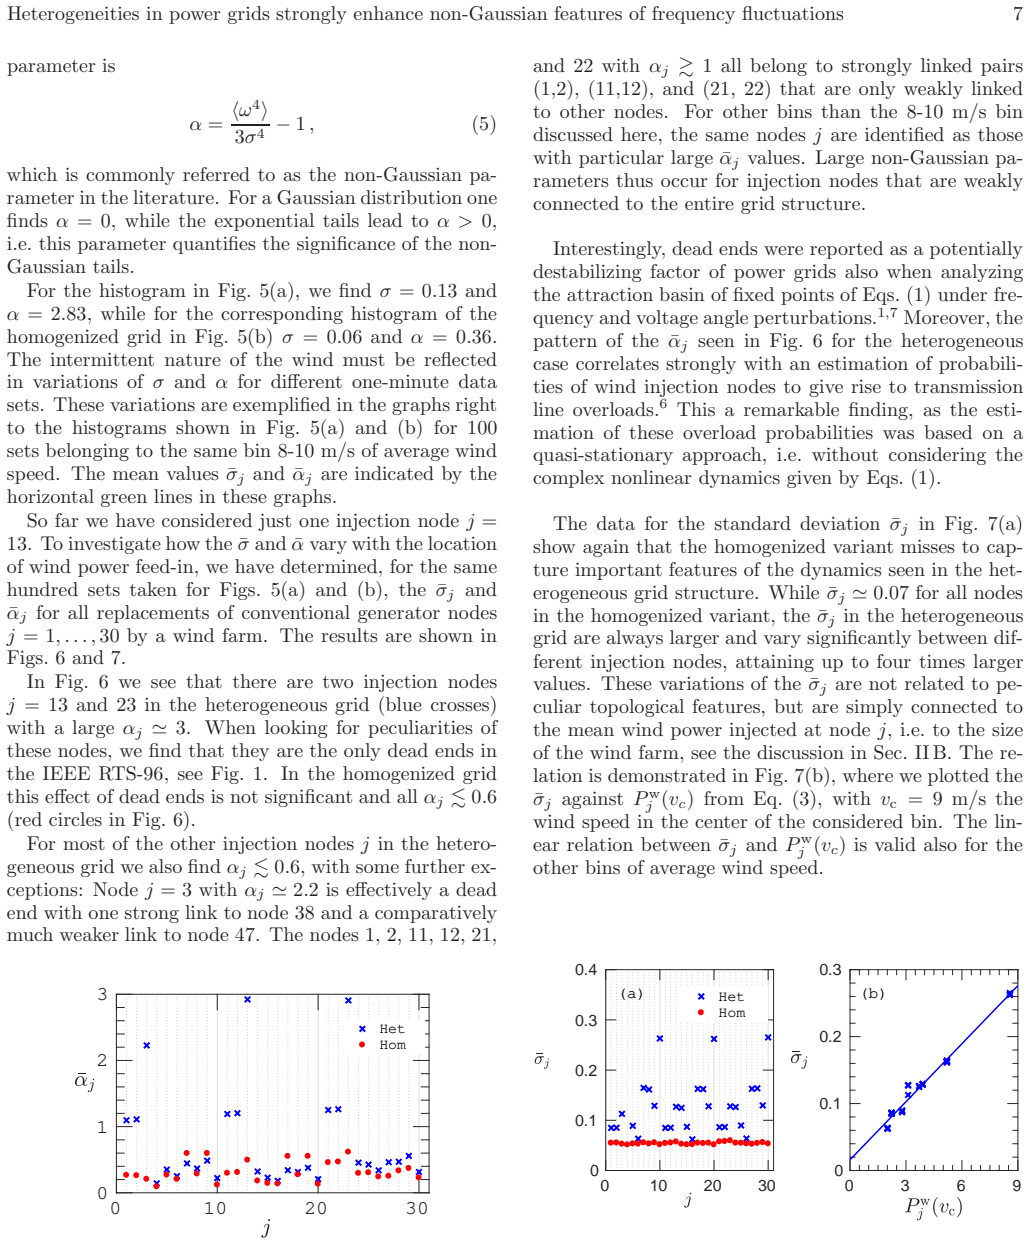
The load-bearing object is the swing equation of the synchronous machine model, $H_j\ddot\theta_j + D_j\dot\theta_j = P_j^{(m)} - \sum_k K_{jk}\sin(\theta_j-\theta_k-\gamma_{jk})$, with coupling strengths $K_{jk}=|V_j||V_k||Y_{jk}|$ from the admittance matrix. The stochastic input is a measured North Sea wind series converted to power through a cubic power curve and interpolated at $5\times10^{-4}$ s time steps, with the grid state reset to a new fixed point every minute to mimic secondary control. The diagnostic that carries the argument is the non-Gaussian parameter $\alpha=\langle\omega^4\rangle/(3\sigma^4)-1$, zero for a Gaussian and positive for exponential tails; the paper computes its average over many one-minute realizations for each of the 30 possible injection nodes in the heterogeneous RTS-96 grid and in its arithmetic-mean homogenization. The dead-end structure of nodes 13 and 23, with node 3 as a quasi-dead-end, is what makes those injection sites stand out.
What would settle it
Rerun the same one-minute wind sequences on a homogenized grid that preserves total transmission capacity and total load exactly while equalizing line admittances, or that uses geometric means instead of arithmetic means, and check whether dead-end injection nodes still show $\bar\alpha_j \gtrsim 3$; if they do, the claimed enhancement is an artifact of the averaging baseline rather than of heterogeneity itself.
Extended reading notes
Core claim
The authors find that when a conventional generator in the RTS-96 test grid is replaced by a wind farm driven by measured one-second North Sea wind speeds, the resulting local frequency deviations in the swing-equation dynamics have histograms with a Gaussian core and nearly exponentially decaying tails. The non-Gaussian parameter $\alpha=\langle\omega^4\rangle/(3\sigma^4)-1$ is small for most injection nodes but reaches values around 3 for the two injection nodes that are topological dead ends, and it is also elevated for nodes weakly linked to the rest of the grid. In a homogenized version of the same grid, obtained by arithmetic averaging of line admittances and of consumed and generated powers, all non-Gaussian parameters stay below about 0.6, so the heterogeneity of the real grid is what makes the tails dangerous. The standard deviation of the frequency fluctuations grows essentially linearly with the mean injected wind power, whereas the tail parameter is controlled by grid position.
Load-bearing premise
The entire heterogeneity effect is measured against a single homogenized comparison grid built by arithmetic averaging; if a different reasonable way of averaging the same grid keeps the heavy tails, the causal claim about heterogeneity collapses.
Editorial extensions
If this is right
- Homogenized grid models systematically underestimate the probability of rare large frequency deviations under wind feed-in.
- Injecting wind power at dead-end or weakly connected nodes produces the most pronounced non-Gaussian tails, making such sites more likely sources of large local frequency fluctuations.
- The standard deviation of frequency fluctuations grows linearly with the mean injected wind power, so larger wind farms degrade frequency quality in proportion to their size.
- A Gaussian core plus near-exponential tail is a robust shape across one-minute windows and injection nodes, so tail risk cannot be captured by variance alone.
- Heavy tails in one-second wind increments are converted into heavy tails of frequency fluctuations, so wind intermittency matters for stability on second-scale time horizons.
Reading between the lines
- The same mechanism probably applies to stochastic solar feed-in, since the combination of intermittent input and weak topology is what generates the tails.
- Because the non-Gaussian parameter pattern correlates with quasi-stationary overload-risk estimates, a screening tool based on power-flow equations alone may identify tail-risk nodes without full swing-dynamics simulations.
- If the linear sigma-power scaling holds broadly, frequency-quality degradation could be budgeted from mean injection alone, but tail risk would need a topology-aware correction factor.
- A natural test is to measure real local frequency data at an existing dead-end wind-farm node: if the histograms show only Gaussian tails, the model contrast would need rethinking.
Signed reviews
Editorial analysis
A structured set of objections, weighed in public.
Referee Report
Summary. The paper studies short-term local frequency fluctuations in the IEEE RTS-96 under stochastic wind power injection. The authors replace each of the 30 conventional generator nodes in turn with a wind farm, drive the swing equations with measured North Sea wind speed data (one-minute segments, with a stochastic Ornstein-Uhlenbeck interpolation between 1 Hz samples), and account for secondary control by resetting the grid to the fixed point of the one-minute mean power. They compare the heterogeneous grid with a homogenized variant built from arithmetic means of line admittances and powers. The main reported result is that histograms of local frequencies pooled over all non-injection nodes have a Gaussian core and nearly exponential tails, quantified by the standard deviation sigma and the non-Gaussian parameter alpha = <omega^4>/(3 sigma^4) - 1. The authors find alpha approximately 3 for injection at dead-end nodes 13 and 23 in the heterogeneous grid, while all alpha values are below about 0.6 in the homogenized grid, and they conclude that grid heterogeneities strongly enhance non-Gaussian frequency fluctuations.
Significance. If the claimed effect is real, it is practically important: standard homogenized models would systematically underestimate the probability of rare, large frequency deviations and would miss the special risk posed by weakly connected injection nodes. The paper has clear strengths: it uses a realistic test grid, real measured wind data rather than synthetic noise, a transparent control-adaptation assumption, and a well-defined comparison protocol. The numerical setup is described in enough detail that the experiments could in principle be reproduced. The reader should note, however, that the paper does not provide machine-checked proofs or code, and the central statistical claim rests on aggregated histograms without quantitative fitting or uncertainty quantification.
major comments (3)
- [Sec. III, Eq. (5), Figs. 5-6] The non-Gaussian parameter alpha is computed from histograms pooled over all nodes other than the injection node, not from node-resolved distributions. For any mixture of zero-mean Gaussian node frequencies with weights w_k and variances sigma_k^2, Eq. (5) yields alpha = (sum w_k sigma_k^4)/(sum w_k sigma_k^2)^2 - 1, which is positive whenever the sigma_k differ, even if no single node has any non-Gaussian tail. The paper does not report per-node histograms or per-node alpha values, so the stark contrast between alpha approximately 2.8 for the heterogeneous grid and alpha approximately 0.36 for the homogenized grid is consistent with a trivial variance-mixing artifact; the authors must rule this out before attributing the enhancement to physical heterogeneities.
- [Sec. III, Fig. 5 and Sec. IV] The exponential-tail claim is not backed by any quantitative fitting procedure. The text in Sec. IV explicitly states that the shapes of individual histograms were not fitted, and the figures show only a Gaussian line overlaid on log-scale histograms. A goodness-of-fit test, a tail-shape estimator, or at least confidence intervals on alpha would be needed to distinguish an exponential tail from a finite mixture of Gaussians or other heavy-tailed alternatives. Error bars on mean alpha and mean sigma across the 100 one-minute sets are also missing.
- [Sec. II A, Figs. 5-6] The conclusion that heterogeneities strongly enhance non-Gaussian features is defined entirely by comparison with one homogenized variant using arithmetic means. Since the abstract and title make a causal claim about heterogeneity itself, the authors should justify why arithmetic means are the appropriate baseline or show that qualitatively similar results are obtained under other natural homogenizations (e.g., preserving total line capacity or per-node weighted means). Without such a robustness check, the 'enhancement' may be an artifact of the chosen averaging scheme.
minor comments (5)
- [Abstract and Sec. III] The phrase 'local frequency distributions' should specify that the histograms are pooled over all nodes other than the injection node; the current wording may mislead readers into thinking these are single-node distributions.
- [Sec. II B and Sec. III] The text says sets with mean wind speeds between 4 and 18 m/s are considered, but the bin list in Sec. III includes 18-20 m/s; please reconcile this inconsistency.
- [Fig. 5, right panels] The variation of sigma and alpha over 100 sets is shown as scattered markers, but the axes scale and the number of points are not described; adding the mean and standard deviation as error bars would improve readability.
- [Eq. (5)] The notation assumes zero-mean omega; this should be stated explicitly when the parameter is introduced.
- [Sec. III, Fig. 6] The identification of nodes 1, 2, 11, 12, 21, and 22 as 'strongly linked pairs that are only weakly linked to other nodes' is qualitative; a quantitative connectivity measure (e.g., effective resistance or algebraic connectivity contribution) would strengthen the claim.
Circularity Check
No circularity: the non-Gaussian frequency statistics are computed simulation outputs, not reductions to fitted inputs or self-citation.
full rationale
The paper's load-bearing claims are numerical observations from a simulation of the swing equation with measured wind input. The histograms and the parameters sigma and alpha are computed statistics, not fit parameters, and the paper explicitly declines to fit individual histogram shapes. The homogenized-grid comparison is defined in the text as arithmetic averaging of line admittances and powers, with detailed parameter values delegated to the authors' earlier Ref. 7; this is a methodological self-citation rather than a derivation step that makes the result equivalent to its input, because the homogenized dynamics are still simulated and the contrast is measured. The Ornstein-Uhlenbeck interpolation parameters are input model parameters from a bachelor thesis, not quantities predicted or fitted to the frequency output. A separate statistical concern is that alpha is computed on node-pooled histograms, so some positive kurtosis could arise from a mixture of Gaussian node statistics with different variances; however, that is a validity and interpretation issue, not circularity in the derivation chain, and the prompt restricts circularity findings to demonstrated reductions by construction. Consequently no circular step is identified.
Assumptions & free parameters
free parameters (2)
- Rated wind speed v_r =
12.5 m/s
- Ornstein-Uhlenbeck parameters gamma and Gamma =
gamma = 0.54, Gamma = gamma/2 = 0.27 per second
assumptions (6)
- domain assumption Swing equation with synchronous machine model and fixed voltage magnitudes governs phase angle dynamics (Eq. 1).
- domain assumption Damping constants D_j effectively account for primary control measures.
- ad hoc to paper Secondary control can be approximated by resetting the grid state to the fixed point of the one-minute average power each minute.
- ad hoc to paper The homogenized grid baseline is defined by arithmetic means of line admittances and consumed and generated powers.
- ad hoc to paper Between 1-second wind speed samples, the wind speed follows an Ornstein-Uhlenbeck process biased toward linear interpolation (Eqs. A1 to A3).
- domain assumption The wind turbine power curve is cubic up to rated speed and saturates above it (Eq. 3).
Cite this review
Pith. "Pith review of Heterogeneities in electricity grids strongly enhance non-Gaussian features of frequency fluctuations under stochastic power input." pith.science (2026). https://pith.science/paper/IV4DWP4B
@misc{pith2026190807997,
  author       = {Pith},
  title        = {Pith review of: Heterogeneities in electricity grids strongly enhance non-Gaussian features of frequency fluctuations under stochastic power input},
  year         = {2026},
  howpublished = {\url{https://pith.science/paper/IV4DWP4B}},
  note         = {Machine review of arXiv:1908.07997}
}
read the original abstract
Stochastic feed-in of fluctuating renewable energies is steadily increasing in modern electricity grids and this becomes an important risk factor for maintaining power grid stability. Here we study the impact of wind power feed-in on the short-term frequency fluctuations in power grids based on an IEEE test grid structure, the swing equation for the dynamics of voltage phase angles, and a series of measured wind speed data. External control measures are accounted for by adjusting the grid state to the average power feed-in on a time scale of one minute. The wind power is injected at a single node by replacing one of the conventional generator nodes in the test grid by a wind farm. We determine histograms of local frequencies for a large number of one-minute wind speed sequences taken from the measured data and for different injection nodes. These histograms exhibit a common type of shape, which can be described by a Gaussian distribution for small frequencies and a nearly exponentially decaying tail part. Non-Gaussian features become particularly pronounced for wind power injection at locations, which are weakly connected to the main grid structure. This effect is only present when taking into account the heterogeneities in transmission line and node properties of the grid, while it disappears upon homogenizing of these features. The standard deviation of the frequency fluctuations increases linearly with the average injected wind power.
Figures

Figures from the paper (3 more)

Reference graph
Works this paper leans on
-
[1]
author author P. Menck , author J. Heitzig , author J. Kurths , \ and\ author H. Schellnhuber ,\ @noop journal journal Nat. Commun. \ volume 5 ,\ pages 3969 ( year 2014 ) NoStop
work page 2014
-
[2]
@noop note P.\ Schultz, J.\ Heitzig, and J.\ Kurths, Eur.\ Phys.\ J.: Spec.\ Top.\ 225, 2593 (2014) NoStop
work page 2014
-
[3]
author author D. Jung \ and\ author S. Kettemann ,\ @noop journal journal Phys. Rev. E \ volume 94 ,\ pages 012307 ( year 2016 ) NoStop
work page 2016
-
[4]
author author S. Auer , author K. Kleis , author P. Schultz , author J. Kurths , \ and\ author F. Hellmann ,\ 10.1140/epjst/e2015-50265-9 journal journal Eur. Phys. J. Spec. Top. \ volume 225 ,\ pages 609 ( year 2016 ) NoStop
-
[5]
author author S. Auer , author F. Hellmann , author M. Krause , \ and\ author J. Kurths ,\ 10.1063/1.5001818 journal journal Chaos \ volume 27 ,\ pages 127003 ( year 2017 ) ,\ http://arxiv.org/abs/https://doi.org/10.1063/1.5001818 https://doi.org/10.1063/1.5001818 NoStop
-
[6]
author author C. Schiel , author P. G. \ Lind , \ and\ author P. Maass ,\ 10.1038/s41598-017-11465-w journal journal Sci. Rep. \ volume 7 ,\ pages 11562 ( year 2017 ) NoStop
-
[7]
author author M. F. \ Wolff , author P. G. \ Lind , \ and\ author P. Maass ,\ 10.1063/1.5040689 journal journal Chaos \ volume 28 ,\ pages 103120 ( year 2018 ) NoStop
-
[8]
author author P. Schultz , author J. Heitzig , \ and\ author J. Kurths ,\ @noop journal journal New J. Phys. \ volume 16 ,\ pages 125001 ( year 2014 ) NoStop
work page 2014
Show all 41 references
-
[9]
Kim , author S
author author H. Kim , author S. H. \ Lee , author J. Davidsen , \ and\ author S.-W. \ Son ,\ @noop journal journal New J. Phys. \ volume 20 ,\ pages 113006 ( year 2018 ) NoStop
2018
-
[10]
author author U. P. \ M \"u ller , author L. Wienholt , author D. Kleinhans , author I. Cussmann , author W.-D. \ Bunke , author G. Ple mann , \ and\ author J. Wendiggensen ,\ 10.1088/1742-6596/977/1/012003 journal journal J. Phys.: Conf. Ser. \ volume 977 ,\ pages 012003 ( ye...
-
[11]
Matke, W
http://www.scigrid.de note C. Matke, W. Medjroubi, and D. Kleinhans, SciGRID - A n O pen S ource R eference M odel for the E uropean T ransmission N etwork (v0.2), 2016. Stop
2016
-
[12]
@noop note M.\ Anghel, K.\ A.\ Werley, and A.\ E.\ Motter, 40th Annual Hawaii International Conference on System Sciences (HICSS'07) (IEEE Computer Society, 2007). pp. 2174-2180 NoStop
2007
-
[13]
Chertkov , author M
author author M. Chertkov , author M. Stepanov , author F. Pan , \ and\ author R. Baldick ,\ in\ @noop booktitle Proceedings of the 50th IEEE Conference on Decision and Control and European Control Conference, CDC-ECC 2011 - Orlando, FL, United States \ ( year 2011 )\ pp.\ pag...
2011
-
[14]
Schmietendorf , author J
author author K. Schmietendorf , author J. Peinke , author R. Friedrich , \ and\ author O. Kamps ,\ @noop journal journal Eur. Phys. J. Spec. Top. \ volume 223 ,\ pages 2577 ( year 2014 ) NoStop
2014
-
[15]
Nishikawa \ and\ author A
author author T. Nishikawa \ and\ author A. Motter ,\ @noop journal journal New J. Phys. \ volume 17 ,\ pages 015012 ( year 2015 ) NoStop
2015
-
[16]
Schmietendorf , author J
author author K. Schmietendorf , author J. Peinke , \ and\ author O. Kamps ,\ 10.1140/epjb/e2017-80352-8 journal journal Eur. Phys. J. B \ volume 90 ,\ pages 222 ( year 2017 ) NoStop
2017 doi
-
[17]
a hne , author J. Schottler , author M. W \
author author H. H \"a hne , author J. Schottler , author M. W \"a chter , author J. Peinke , \ and\ author O. Kamps ,\ http://stacks.iop.org/0295-5075/121/i=3/a=30001 journal journal EPL \ volume 121 ,\ pages 30001 ( year 2018 ) NoStop
2018
-
[18]
H\"ahne , author K
author author H. H\"ahne , author K. Schmietendorf , author S. Tamrakar , author J. Peinke , \ and\ author S. Kettemann ,\ 10.1103/PhysRevE.99.050301 journal journal Phys. Rev. E \ volume 99 ,\ pages 050301 ( year 2019 ) NoStop
2019 doi
-
[19]
Sch \"a fer , author C
author author B. Sch \"a fer , author C. Beck , author K. Aihara , author D. Witthaut , \ and\ author M. Timme ,\ 10.1038/s41560-017-0058-z journal journal Nat. Energy \ volume 3 ,\ pages 119 ( year 2018 a ) NoStop
2018 doi
-
[20]
Albert , author I
author author R. Albert , author I. Albert , \ and\ author G. L. \ Nakarado ,\ 10.1103/PhysRevE.69.025103 journal journal Phys. Rev. E \ volume 69 ,\ pages 025103 ( year 2004 ) NoStop
2004 doi
-
[21]
\ Wang \ and\ author L.-L
author author J.-W. \ Wang \ and\ author L.-L. \ Rong ,\ https://doi.org/10.1016/j.ssci.2009.02.002 journal journal Saf. Sci. \ volume 47 ,\ pages 1332 ( year 2009 ) NoStop
2009 doi
-
[22]
Hines , author E
author author P. Hines , author E. Cotilla-Sanchez , \ and\ author S. Blumsack ,\ https://doi.org/10.1063/1.3489887 journal journal Chaos \ volume 20 ,\ pages 033122 ( year 2010 ) NoStop
2010 doi
-
[23]
Andrychowicz and B
@noop note M. Andrychowicz and B. Olek, Optimal structure of the RES in distribution systems , in 13th International Conference on the European Energy Market (2016), pp.\ 1-5. Stop
2016
-
[24]
Schmietendorf , author O
author author K. Schmietendorf , author O. Kamps , author M. Wolff , author P. G. \ Lind , author P. Maass , \ and\ author J. Peinke ,\ @noop title Bridging between load-flow and K uramoto-like power grid models: A flexible approach to integrating electrical storage units , \ ...
2018 arXiv
-
[25]
Grigg , author P
author author C. Grigg , author P. Wong , author P. Albrecht , author R. Allan , author M. Bhavaraju , author R. Billinton , author Q. Chen , author C. Fong , author S. Haddad , author S. Kuruganty , \ and\ author et al. ,\ @noop journal journal IEEE Trans. Pow. Sys. \ volume ...
1999
-
[26]
The FINO project is supported by the German Government through BMWi and PTJ
note FINO I project and database (2016). The FINO project is supported by the German Government through BMWi and PTJ. Available at http://www.bsh.de NoStop
2016
-
[27]
Rohden , author A
author author M. Rohden , author A. Sorge , author M. Timme , \ and\ author D. Witthaut ,\ 10.1103/PhysRevLett.109.064101 journal journal Phys. Rev. Lett. \ volume 109 ,\ pages 064101 ( year 2012 ) NoStop
2012 doi
-
[28]
Sch \"a fer , author D
author author B. Sch \"a fer , author D. Witthaut , author M. Timme , \ and\ author V. Latora ,\ 10.1038/s41467-018-04287-5 journal journal Nat. Commun. \ volume 9 ,\ pages 1975 ( year 2018 b ) NoStop
1975 doi
-
[29]
Tamrakar , author M
author author S. Tamrakar , author M. Conrath , \ and\ author S. Kettemann ,\ 10.1038/s41598-018-24685-5 journal journal Sci. Rep. \ volume 8 ,\ pages 6459 ( year 2018 ) NoStop
2018 doi
-
[30]
Machowski , author J
author author J. Machowski , author J. Bialek , \ and\ author J. Bumby ,\ @noop title Power System Dynamics \ ( publisher John Wiley & Sons, New Jersey ,\ year 2008 ) NoStop
2008
-
[31]
Filatrella , author A
author author G. Filatrella , author A. H. \ Nielsen , \ and\ author N. F. \ Pedersen ,\ 10.1140/epjb/e2008-00098-8 journal journal Eur. Phys. J. B \ volume 61 ,\ pages 485 ( year 2008 ) NoStop
2008 doi
-
[32]
note See https://www.entsoe.eu for ``UCTE Operation Handbook'' (2004). Stop
2004
-
[33]
Kuramoto ,\ in\ 10.1007/BFb0013365 booktitle Mathematical Problems in Theoretical Physics ,\ series Lecture Notes in Physics , Vol
author author Y. Kuramoto ,\ in\ 10.1007/BFb0013365 booktitle Mathematical Problems in Theoretical Physics ,\ series Lecture Notes in Physics , Vol. volume 39 ,\ editor edited by\ editor H. Araki \ ( publisher Springer Verlag, Berlin ,\ year 1975 )\ pp.\ pages 420--422 NoStop
-
[34]
author author J. A. \ Acebr\'on , author L. L. \ Bonilla , author C. J. \ P\'erez Vicente , author F. Ritort , \ and\ author R. Spigler ,\ 10.1103/RevModPhys.77.137 journal journal Rev. Mod. Phys. \ volume 77 ,\ pages 137 ( year 2005 ) NoStop
-
[35]
author author F. A. \ Rodrigues , author T. K. D. \ Peron , author P. Ji , \ and\ author J. Kurths ,\ 10.1016/j.physrep.2015.10.008 journal journal Phys. Rep. \ volume 610 ,\ pages 1 ( year 2016 ) NoStop
2015 doi
-
[36]
author author A. E. \ Motter , author S. A. \ Myers , author M. Anghel , \ and\ author T. Nishikawa ,\ https://doi.org/10.1038/nphys2535 journal journal Nat. Phys. \ volume 9 ,\ pages 191 EP ( year 2013 ) NoStop
2013 doi
-
[37]
Trias ,\ in\ 10.1109/PESGM.2012.6344759 booktitle IEEE Power and Energy Society General Meeting \ ( year 2012 )\ pp.\ pages 1--8 NoStop
author author A. Trias ,\ in\ 10.1109/PESGM.2012.6344759 booktitle IEEE Power and Energy Society General Meeting \ ( year 2012 )\ pp.\ pages 1--8 NoStop
2012
-
[38]
Milan , author M
author author P. Milan , author M. W\"achter , \ and\ author J. Peinke ,\ @noop journal journal J. Renewable Sustainable Energy \ volume 6 ,\ pages 033119 ( year 2014 ) NoStop
2014
-
[39]
author author J. F. \ Manwell , author J. G. \ McGowan , \ and\ author A. L. \ Rogers ,\ @noop title Wind energy explained \ ( publisher John Wiley & Sons, Ltd ,\ year 2009 ) NoStop
2009
-
[40]
author author P. C. \ B \"o ttcher , author A. Otto , author S. Kettemann , \ and\ author C. Agert ,\ @noop title Time delay effects in the control of synchronous electricity grids , \ howpublished arXiv:1907.13370 (2019) NoStop
2019 arXiv
-
[41]
note M.\ Brune, ``Modeling of wind speeds with the Langevin equation'' (in German), bachelor thesis (2018), Osnabr \"u ck University. Stop
2018
Reviewed August 14, 2026 · model on record in the stance chip above.
Discussion (0). Continue with ORCID to comment.