REVIEW 3 major objections 4 minor 15 references
Measurement of the Extragalactic Background Light with VERITAS
T0 review · 3 major / 4 minor · reviewed 2026-08-14 · deepseek-v4-flash
Pith's one-line read Using 16 blazar spectra across 10 years, VERITAS constrains the intensity of the extragalactic background light near the poorly-known cosmic infrared region.
desk verdict A genuine new EBL constraint from 10 years of VERITAS blazar spectra, but the result's upper-limit character depends on untested priors about intrinsic spectral shape; the ApJ paper, not this proceedings, is the one to referee. read the letter →
The pith
A machine-rendered reading of the paper's core claim, the machinery that carries it, and where it could break.
The reading
What carries the argument
The core mechanism is a shape-weighting procedure over 480,000 randomly generated EBL spectral energy distributions. Each generic EBL shape is used to de-absorb the observed blazar spectra, the resulting intrinsic spectra are fit, and shapes are down-weighted by $\exp(-\chi^2/2)$ if they demand non-convex intrinsic spectra or spectral indices harder than 1. Summing the weights over all sources turns the accepted EBL shapes into a probability density for the EBL intensity at each wavelength, from which containment bands are computed.
What would settle it
Observe a well-measured blazar whose intrinsic spectrum, after correction with a plausible EBL, is significantly harder or concave (hardens with energy), violating the assumed prior; that would invalidate the method. Alternatively, a future direct measurement that finds a diffuse EBL at wavelengths around 10 microns exceeding the galaxy-count lower limit by more than the VERITAS 95% containment band would contradict the result.
Extended reading notes
Core claim
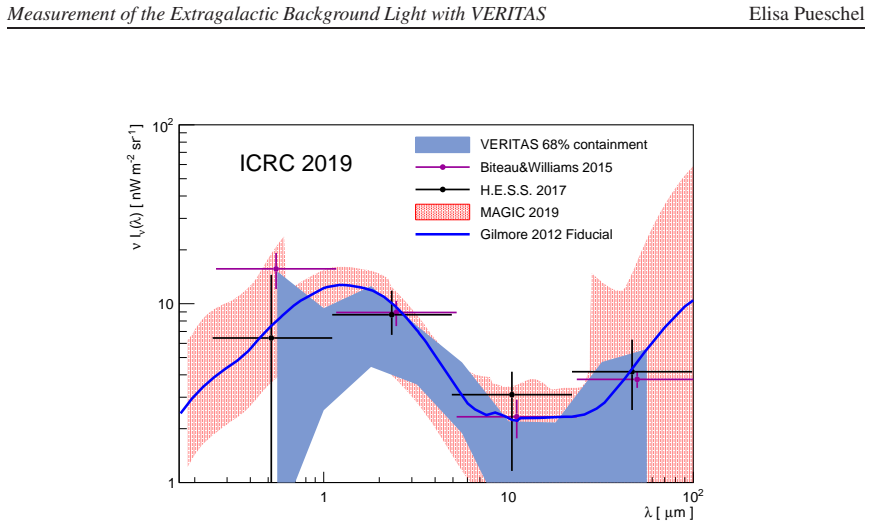
The central claim is that the EBL in the cosmic infrared region can be measured from gamma-ray absorption rather than from direct sky brightness. Jointly analyzing 16 spectra from 14 VERITAS blazars, the method yields a 68% containment band on the EBL intensity from 0.56 to 56 micron, with the tightest constraint near 10 microns. Within this band the EBL is consistent with the cumulative light of resolved galaxies, and the comparison with other gamma-ray measurements and theoretical models shows no significant deviation. The paper concludes that any additional diffuse component, whether from unresolved sources or more exotic processes, is limited by the data.
Load-bearing premise
The analysis assumes that every blazar's true intrinsic gamma-ray spectrum is convex and has a power-law index no harder than 1; if any source's intrinsic emission is harder or concave, the inferred EBL intensity will be biased.
Editorial extensions
If this is right
- If the result holds, the EBL intensity at 0.56–56 micron is known to within the stated band without assuming an EBL spectral template.
- The agreement with galaxy counts bounds the energy that could be carried by diffuse background light, including from unresolved galaxy populations or particle decay.
- At wavelengths near 10 microns, the VERITAS data give the strongest current gamma-ray-based constraints on the EBL.
- Extending the same analysis to nearby hard-spectrum blazars such as Mrk 501, Mrk 421, and M87 could widen the EBL wavelength coverage.
Reading between the lines
- The weighting technique could be applied to larger blazar samples from next-generation Cherenkov observatories to sharpen the measurement and either confirm or close the remaining gap to galaxy-count lower limits.
- The convexity and $\Gamma \geq 1$ priors are the method's only spectral assumptions; replacing them with independent models of blazar jet emission would give a cross-check that does not rely on those priors.
- If the EBL really sits near the galaxy-count floor, then unresolved source populations must contribute little at these wavelengths, a prediction that future deep galaxy surveys can test directly.
Signed reviews
Editorial analysis
A structured set of objections, weighed in public.
Referee Report
Summary. This ICRC 2019 proceedings paper reports an indirect measurement of the extragalactic background light (EBL) intensity in the 0.56-56 micron range from VERITAS observations of 16 spectra of 14 blazars. The analysis generates 480,000 generic EBL SEDs by drawing splines through 12 wavelength grid points, computes the corresponding gamma-ray opacity, corrects each observed spectrum to an 'intrinsic' spectrum, and down-weights EBL shapes producing poorly fit or physically disfavored intrinsic spectra. The joint weighted result is presented as 68% and 95% containment bands that agree with galaxy-count lower limits and with earlier gamma-ray measurements, leaving limited room for a diffuse EBL component. The paper is a short proceedings contribution; the method is described qualitatively and the statistical and systematic treatment is summarized rather than fully documented.
Significance. If the result is robust, it is a useful, shape-independent measurement of the near- and mid-infrared EBL that is particularly constraining near 10 microns, and it is a valuable cross-check with H.E.S.S., MAGIC, and archival analyses. The analysis includes a large VERITAS sample, a stated treatment of energy-scale, redshift-evolution, and redshift-distance systematics, and a comparison with lower/upper limits from galaxy counts and direct measurements. These are genuine strengths. The central claim is, however, conditional on priors imposed on intrinsic blazar spectra (no spectral hardening; a spectral-index threshold); because the paper does not provide a closure test or independent validation of these priors, the agreement with galaxy counts could be partly manufactured by a downward bias in the inferred EBL intensity. The method is not circular in the narrow sense, but it is a measurement under priors rather than an assumption-free determination.
major comments (3)
- [Section 3, paragraph beginning 'Several requirements are imposed'] The stated intrinsic spectral-index condition, 'the intrinsic spectral index Γ cannot be too hard (Γ≤1)', is internally inconsistent if Γ is the standard photon index in dN/dE ∝ E^{-Γ}, since harder spectra correspond to smaller Γ. As printed, the inequality permits arbitrarily hard spectra, which is the opposite of the stated intent. Because this threshold is one of the two priors that break the intrinsic-spectrum/EBL degeneracy, the sign of the bound and the exact convention must be stated unambiguously, and the implementation must be checked against the intended constraint (presumably Γ≥1 in the standard convention).
- [Section 3 and Section 5] The convexity and Γ≥1 priors are load-bearing: the observed spectra are products of intrinsic spectra and EBL attenuation, so without external constraints the same observed spectrum can be reproduced by a harder intrinsic spectrum with more EBL absorption or a softer intrinsic spectrum with less absorption. The priors select the latter, biasing the EBL intensity downward if any of the 16 intrinsic spectra is genuinely concave (hardening) or harder than the threshold. No closure test is presented. The paper should add simulations in which mock VERITAS-like spectra are produced from a known EBL SED, with intrinsic spectra that include concave shapes and indices at or beyond the threshold, and should show that the recovered 68% band contains the injected EBL. Reporting the fraction of EBL shapes down-weighted by the priors per source would also help quantify how much of the result is driven by the assumptions.
- [Section 4, item 1] Varying the spectral-index threshold by ±10% of the observed index is a rescaling of the same prior and does not test the qualitative convexity requirement or the choice of the index cutoff. The statement that this 'accounts for' the VERITAS energy-scale uncertainty also needs a derivation: the mapping from energy-scale errors to an uncertainty on the prior boundary is assumed, not demonstrated. A quantitative systematic band obtained by repeating the analysis with the convexity prior relaxed (e.g., allowing concave intrinsic spectra) is needed to support the claim of a full treatment of systematics.
minor comments (4)
- [Section 3] The functional forms of the power law, power-law-with-exponential-cutoff, and log-parabola fit models are not defined; add the explicit equations and state the energy range and number of bins per spectrum used in the fits.
- [Section 3] The term 'convex' is used in a nonstandard way: a spectrum that 'cannot become harder with increasing energy' is concave in the usual log-log representation of νF_ν versus E. Please define the term or rephrase to avoid confusion.
- [Section 5 / References] Reference [15], described as 'submitted to ApJ,' appears to be the detailed analysis behind this proceedings paper; if it has since been accepted or published, update the citation and clarify the relationship between the two papers.
- [Table 1] For sources with two fit models (1ES 1959+650 and 3C 66A), it is not clear whether the high- and low-state spectra are fitted jointly in the EBL analysis or separately; state this explicitly.
Circularity Check
No significant circularity: the EBL band is inferred from observed gamma-ray spectra under explicit physical priors on intrinsic spectra, not reconstructed from EBL inputs by construction.
full rationale
The derivation chain is: observed VERITAS spectra are corrected for absorption using many randomly generated generic EBL spectral shapes; each corrected spectrum is fit with power-law, power-law-with-cutoff, or log-parabola models under convexity and index priors; the fit chi-square assigns a weight exp(-chi^2/2) to each EBL shape; and the weighted distributions define the containment bands. Nothing in this chain defines the output EBL intensity in terms of itself, and no fitted parameter is renamed as a prediction. The convexity and Gamma<=1 conditions are external physical priors that break the intrinsic-spectrum/EBL degeneracy; if those priors are wrong the inferred band could be biased, but that is a modeling and robustness limitation, not a circular reduction. The paper explicitly treats energy-scale, EBL-evolution, and redshift uncertainties in Section 4, and it compares the resulting band with external measurements and a theoretical model in Figure 2. The self-citations to VERITAS calibration and reconstruction software are instrumental details, and the adaptation of a comparison figure from a VERITAS paper is not load-bearing evidence for the EBL measurement. No equation in the paper equates the derived EBL band to an input quantity, so there is no circularity by construction.
Assumptions & free parameters
free parameters (3)
- Redshift evolution factor fevo =
1.7
- Intrinsic spectral index minimum Gamma >= 1 =
1.0 (varied by +/-10% of observed index)
- Prior intensity range for EBL grid points =
1.0 to 50 nW m^-2 sr^-1
assumptions (4)
- standard math Gamma-gamma pair production is the dominant attenuation mechanism for >100 GeV gamma rays.
- domain assumption The EBL evolution with redshift follows (1+z)^(3-fevo) with fevo=1.7.
- domain assumption Intrinsic blazar gamma-ray spectra are convex and have spectral index Gamma >= 1.
- domain assumption The observed spectra of the selected blazars are well described by power-law, power-law with cutoff, or log-parabola functions.
Cite this review
Pith. "Pith review of Measurement of the Extragalactic Background Light with VERITAS." pith.science (2026). https://pith.science/paper/IZJQ7EVS
@misc{pith2026190804163,
  author       = {Pith},
  title        = {Pith review of: Measurement of the Extragalactic Background Light with VERITAS},
  year         = {2026},
  howpublished = {\url{https://pith.science/paper/IZJQ7EVS}},
  note         = {Machine review of arXiv:1908.04163}
}
abstract
The extragalactic background light records the history of infrared, optical and ultraviolet light radiation including re-radiation since the epoch of reionization. While challenging to measure directly, it can be measured indirectly via its impact on observed spectra of extragalactic gamma-ray emitters. VERITAS, a ground-based imaging atmospheric-Cherenkov telescope array sensitive to gamma rays above 100 GeV, has accrued 10 years of observations of hard-spectrum blazars. The energy and redshift range covered enables the measurement of the EBL in the range 0.56-56~$\mu$m, accessing the poorly constrained cosmic infrared background region. New constraints on the EBL resulting from the joint analysis using 16 spectra from 14 VERITAS-observed blazars will be presented. The method is independent of assumptions about the shape of the EBL spectrum, and includes a full treatment of systematic and statistical uncertainties. The measured spectrum is in good agreement with lower limits from galaxy counts, limiting the potential contribution from a diffuse component.
Figures

Reference graph
Works this paper leans on
- [1]
-
[2]
Matsuura, S. et al. 2017, ApJ, 837, 7
work page 2017
-
[3]
Zemcov, M. et al. 2017, Nature Communications, 8, 15003
work page 2017
-
[4]
Driver S. P . et al., 2016, ApJ, 827, 108
work page 2016
- [5]
-
[6]
Domínguez, A. et al. 2011, MNRAS, 410, 2556
work page 2011
-
[7]
Gilmore, R.C. et al. 2012, MNRAS, 422, 3189
work page 2012
-
[8]
Holder, J. et al. (VERITAS collaboration), 2006, ApJ, 25 , 391
work page 2006
Show all 15 references
-
[9]
Park, N. et al. (VERITAS Collaboration). 2015, Proc. of t he 34th ICRC, PoS(ICRC2015)771
2015
-
[10]
& Holder, J
Maier, G. & Holder, J. 2017, Proc. of the 35 th ICRC, ArXiv e-prints, arXiv:1708.04048
2017 arXiv
-
[11]
2016, Astropartic le Physics, 89, 1
Krause, M., Pueschel, E., & Maier, G. 2016, Astropartic le Physics, 89, 1
2016
-
[12]
Abdalla, H. et al. (H.E.S.S. collaboration). 2010, A&A , 520, A83
2010
-
[13]
Acciari, V .A. et al. (MAGIC collaboration). 2019, MNRA S, 486, 4233
2019
-
[14]
& Williams, D
Biteau, J. & Williams, D. A. 2015, ApJ, 812, 60
2015
-
[15]
Abeysekara, U. et al. (VERITAS collaboration). 2019, submitted to ApJ 5
2019
Reviewed August 14, 2026 · model on record in the stance chip above.
Discussion (0). Continue with ORCID to comment.