REVIEW 4 major objections 5 minor 39 references
The initial evolution of SN 1993J: Piston phase versus standard model
T0 review · 4 major / 5 minor · reviewed 2026-08-07 · deepseek-v4-flash
Pith's one-line read The observed break in SN 1993J's outer expansion velocity at a few hundred days is the transition from a piston phase to the standard self-similar phase, with transition time $t_{\rm CN}\approx200$ days.
desk verdict Plausible new interpretation of SN 1993J's early VLBI break as the piston-to-CN transition, but the forward-shock identification of the rim needs quantitative support before the derived mass-loss rate and X-ray timing can be trusted. read the letter →
The pith
A machine-rendered reading of the paper's core claim, the machinery that carries it, and where it could break.
The reading
What carries the argument
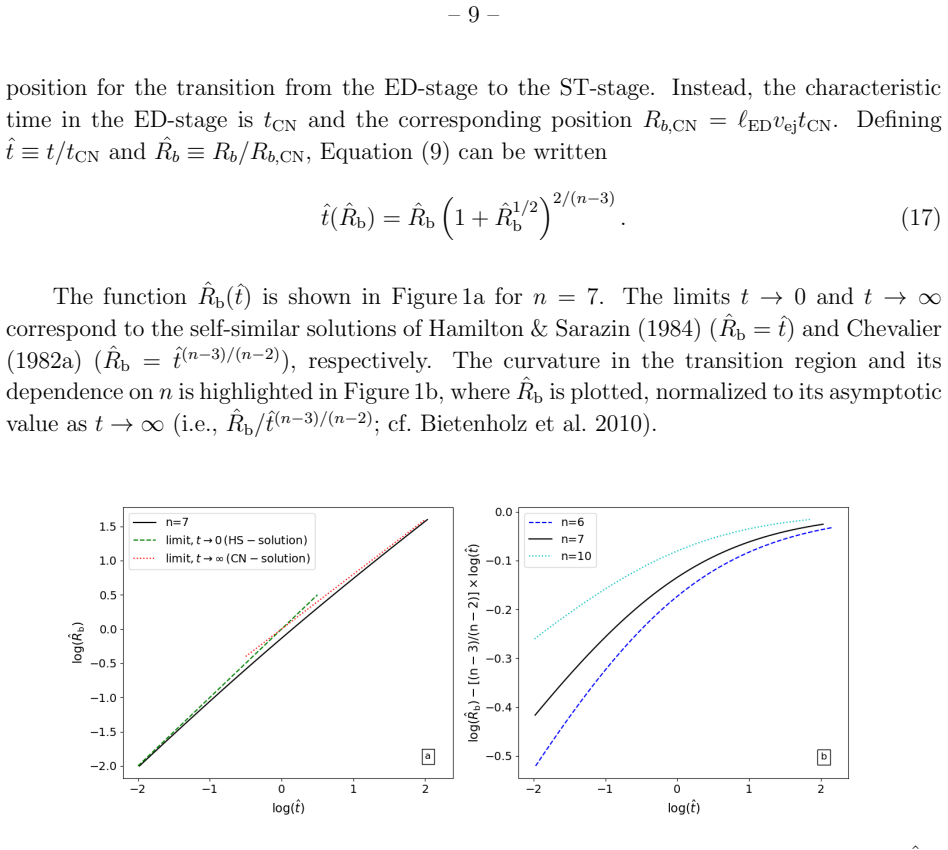
The load-bearing object is the unified analytic description of the ejecta-dominated phase of a supernova, in which the forward-shock radius obeys $\hat t(\hat R_b)=\hat R_b(1+\hat R_b^{1/2})^{2/(n-3)}$ after normalizing time and radius to the transition values. In the limits $\hat R_b\ll1$ and $\hat R_b\gg1$ this reduces to the piston-phase law $R_b\propto t$ and the standard-phase law $R_b\propto t^{(n-3)/(n-s)}$; the break time $t_{\rm CN}$ is where the two asymptotic laws cross. The machinery also gives explicit expressions for the reverse-shock velocity, swept-up mass, cooling time, and X-ray transparency time in the two phases, which is what converts the observed radius evolution into quantitative predictions for the X-ray and radio light curves.
What would settle it
A decisive check would be early VLBI imaging at frequencies or epochs where opacity is negligible: if the local slope $m=d\log R_b/d\log t$ does not follow the predicted transition curve with $t_{\rm CN}\approx200$ days, or if the X-ray light curve shows the flattening or increase around day 20 that the piston-phase model explicitly removes, the phase-transition identification would be ruled out.
Extended reading notes
Core claim
The central claim is that the observed change in the outer radius evolution $R_b(t)$ of SN 1993J is not a change in the circumstellar density or the ejecta density gradient, but the passage from the piston-dominated self-similar solution to the standard self-similar interaction solution, with the transition occurring at $t_{\rm CN}\approx200$ days. Using the unified analytic solution that smoothly joins the two self-similar phases, the paper shows that this one transition time, together with the measured forward-shock radius, yields a self-consistent set of parameters: $v_{\rm ej}\approx2.1\times10^9$ cm s$^{-1}$, $w_{\rm core}\approx0.51$, and $\dot M_w/v_w\approx2.2\times10^{-5}$ in the adopted scaling. The same framework explains the early X-ray spectrum as reverse-shock emission that becomes optically thin near day 20, identifies the simultaneous radio and X-ray breaks at $\approx3100$ days as the reverse shock reaching the core, and attributes the box-like $\rm H\alpha$ profile to the partially ionized zone in the envelope-to-core transition region.
Load-bearing premise
The entire chain rests on identifying the VLBI-measured outer rim of the radio emission with the forward shock radius; if the rim instead tracks the contact discontinuity or is biased by early optical depth, the derived transition time, mass-loss rate, and X-ray timing lose their foundation.
Editorial extensions
If this is right
- The reverse shock in the piston phase becomes optically thin to X-rays around day 20, so the absence of a flattening or rise in SN 1993J's early X-ray light curve is expected rather than a contradiction.
- The total explosion energy comes out consistent with standard core-collapse models, removing the factor-of-10 discrepancy produced by interpreting the early phase as a steep-density-gradient self-similar phase.
- The progenitor's mass-loss rate is fixed at $\dot M_{w,-5}/v_{w,6}\approx2$ with no need for a variable wind before explosion.
- The simultaneous breaks in the radio and X-ray light curves at $\approx3100$ days mark the reverse shock entering the core, giving $v_{\rm core}\approx1.1\times10^4$ km/s and directly relating the mass-loss rate to the ejecta energy.
- The box-like $\rm H\alpha$ and optical line profiles originate in the partially ionized transition region between envelope and core, which explains why their edge velocity declines so slowly after day 500.
Reading between the lines
- Any radio supernova whose VLBI radius shows a nearly constant-velocity early phase could be analyzed the same way, using the normalized transition curve to infer $t_{\rm CN}$, the ejecta velocity, and the wind density from a few radius measurements.
- If the 3100-day breaks are core entry, the late-time spectral evolution (such as the observed transition to $\rm [O\,III]$ dominance) should proceed on a timescale set by $t_{\rm CN}$ and $v_{\rm core}$, which later observations could check.
- The model's exact curvature prediction for $R_b(t)$ during the transition could be tested more sharply by resolved imaging at frequencies with negligible early opacity, where the local slope $m=d\log R_b/d\log t$ should follow the predicted curve.
Editorial analysis
A structured set of objections, weighed in public.
Referee Report
Summary. The paper argues that the early evolution of SN 1993J, as traced by VLBI observations of the outer rim of the radio emission, is not a single self-similar phase but begins in the Hamilton-Sarazin piston phase and transitions to the Chevalier self-similar phase at t_CN about 200 days. Using Truelove and McKee's unified solution, the author derives the transition-time formula, identifies the observed slope break with t_CN, and then uses the assumed 3100-day achromatic break as the reverse shock entering the ejecta core to infer w_core = 0.51, v_core about 1.1 times 10^9 cm/s, and a mass-loss rate roughly Mdot_5 / v_w,6 = 2. The piston-phase reverse-shock properties are used to explain the early soft X-ray behavior, the absence of a late X-ray flattening, and the box-like H-alpha profiles, and to argue against a varying mass-loss rate from the progenitor star.
Significance. If the central identification is correct, the paper offers a coherent and economical resolution of several long-standing tensions in SN 1993J: it avoids the very high explosion energy required by a large-n interpretation of the early phase, removes the need for a variable mass-loss rate, and explains the early X-ray light-curve behavior and the H-alpha box profiles. The analytic machinery is well grounded in Truelove and McKee (1999), and the internal consistency checks--Eq. (13) giving w_core about 0.51 from the 3100-day/200-day ratio, Eq. (26) giving N22 about 28 against the observed about 38, and the derived mass-loss rate being near standard values--are encouraging. The paper also makes falsifiable predictions, including t_thin about 19 days and the absence of a late X-ray flattening during the piston phase. Its main weakness is that the cornerstone identification of the VLBI slope break with t_CN rests on an unquantified assumption about what the radio rim traces, and the t_CN estimate itself is read from noisy data; these issues make the quantitative results conditional until addressed.
major comments (4)
- [§4.1, §5] The claim that the observed slope break at a few hundred days is the HS-to-CN transition assumes that the VLBI-measured outer rim tracks the forward-shock radius R_b(t). The paper states in §5 that this will be assumed, and in §4.1 it acknowledges that early optical depth and concentration of emission near the contact discontinuity (Martí-Vidal et al. 2024) both lower the deduced R_b, but it dismisses these as 'unlikely to seriously affect the transition time' without a quantitative argument. Because R_cd/R_b is not constant across the unified solution, an opacity-biased or contact-discontinuity-tracking surface can produce an apparent slope break at a time different from t_CN. Since t_CN enters Eq. (18) (mass-loss rate), Eq. (13) (w_core), and Eq. (29) (X-ray transparency), this is a load-bearing assumption. Please provide a quantitative test, for example by computing the predicted local slope m(t) for the observed rim if it traced R_cd(t) or an opacity-weighted surface under the HS and CN solutions, and show that the inferred t_CN shifts by less than the claimed factor of 2.
- [§4.1, Fig. 2] The value t_CN = 200 days is read from the local slope m(t), but Fig. 2 shows large scatter and the paper admits an uncertainty 'within a factor of 2.' This uncertainty propagates into the derived quantities: w_core from Eq. (13) depends on the ratio t_core/t_CN, Eq. (18) then scales the mass-loss rate, and Eq. (29) gives t_thin proportional to t_CN^{19/25}. The paper should propagate the factor-of-2 uncertainty through the derived quantities and demonstrate that the qualitative conclusions (piston phase, no X-ray flattening, Mdot about 2) are robust over the allowed range, or state explicitly which quantitative claims survive only for t_CN = 200 days.
- [§4.1, §6 item 7] The derivation of w_core = 0.51 from Eq. (13) presupposes that the simultaneous breaks at about 3100 days in the radio and X-ray light curves mark the reverse shock entering the core. This identification is inherited from Björnsson (2015) and Martí-Vidal et al. (2024) and is not derived here; the text says 'Assuming this to be correct.' The value w_core then feeds Eq. (18) and the v_core used for the H-alpha box-profile interpretation, and the conclusions list item 7 states this as an outcome. Please either present independent support for the 3100-day identification or explicitly label w_core, the mass-loss rate, and the H-alpha interpretation as conditional on that external assumption.
- [§4.3, §5] Several of the numerical agreements are presented as confirmations, but they are consistency checks rather than independent predictions: the ASCA column-density comparison (N22 = 28 versus 38) uses the mass-loss rate derived from the same observed t_CN, and the X-ray transparency time t_thin = 19 days is evaluated with parameters calibrated to the VLBI break. The paper should clearly distinguish postdictions from predictions and identify what a future observation would need to measure in order to falsify the scenario.
minor comments (5)
- [Eq. (18)] The coefficient '4.7 × 10 w2 core' appears to be missing a superscript on the 10; it should read 4.7 × 10^1 w_core^2 (or 47 w_core^2).
- [Eq. (11)] The denominator '1 4πϕed n(n − 3)' is typeset ambiguously; it should be 1/[4π ϕ_ED n(n−3)] or similar.
- [§3, after Eq. (15)] The sentence 'the value of t_CN is independent of the core properties' is contradicted by Eq. (16), which varies with both w_core and q; please rephrase to state the quantity held fixed, for example the outer envelope density normalization.
- [Fig. 1(b) caption] The phrase 'all curves limit to 0 as t → ∞' appears to be missing a closing parenthesis or period; the caption should be completed.
- [§5, H-alpha box profiles] The H-alpha box-profile explanation would be strengthened by a synthetic line-profile calculation; as written it is a plausible consistency argument rather than a demonstration.
Circularity Check
The mass-loss rate and core-crossing deductions are not independent: t_CN is read from the very break the paper explains, and w_core is imported from same-author prior work.
-
fitted input called prediction
[Section 4.1, Eq. (18), and Section 6, item 6]
"However, focusing on the evolution during the first ∼ 10^3 days, one may argue that tCN = 200 days should be a good estimate to within a factor of 2. ... Together with tCN = 200 days, this yields Ẍw,−5/vw,6 = 1.7E51."
The observed break in the VLBI expansion is used to set t_CN = 200 days, and Equation (18) is then inverted to obtain the mass-loss rate. The quoted 'derived' Ẍ/vw is therefore just the inverse of the fit used to set the transition epoch; it is not a prediction from the model. All downstream quantities that depend on Ẍ/vw, such as the X-ray transparency time, inherit this fitted input, so the agreement with ASCA is an internal consistency check rather than an independent confirmation.
-
self citation load bearing
[Section 4.1, after Eq. (18)]
"It has been argued in Björnsson (2015) and Martí-Vidal et al. (2024) that the abrupt monochromatic decline of the radio light curves at ≈ 3100 days was due to the reverse shock entering the core region. Assuming this to be correct, a value for vcore can be estimated from Equation (13). With tcore = 3100 and tCN = 200 days, the result is wcore = 0.51."
The 3100-day break is identified as reverse-shock/core crossing only by citing prior work by the present author and coauthors. This identification is load-bearing because it supplies w_core = 0.51, which then enters Eq. (18) to determine Ẍ/vw. The paper's later conclusion that the 3100-day breaks mark core crossing therefore rests on a self-citation chain rather than on an independent, established result.
full rationale
The central identification of the observed slope break with the Hamilton–Sarazin to Chevalier transition is not circular in itself: Truelove & McKee's unified solution is an external, independent construction, and the paper compares the predicted local slope evolution with the observed m(t) data, which provides some nontrivial content. However, the quantitative results are not independent predictions. The transition epoch t_CN is read from the same observed break that the paper claims to explain, and that fitted epoch is then used in Eq. (18) to infer the mass-loss rate. The 3100-day core-crossing epoch is imported from same-author prior work, and the resulting w_core enters the same Eq. (18). Thus the derived mass-loss rate, X-ray transparency time, and core-crossing interpretation reduce, in part, to inputs fitted from, or self-cited for, the very phenomena they are supposed to explain. The ASCA comparison is internal consistency, not an external falsification. This is partial circularity, not a complete reduction: the model's predicted curvature and the late-time radio/X-ray comparisons retain independent empirical content.
Assumptions & free parameters
free parameters (6)
- t_CN =
200 days
- n =
7 (or 6)
- vej =
2.1e9 cm/s
- wcore =
0.51
- q =
approximately 2
- E51 =
1.3
assumptions (7)
- domain assumption The unified solution of Truelove and McKee (1999) accurately describes the adiabatic, spherically symmetric ejecta-CSM interaction.
- domain assumption The ejecta has a power-law envelope (rho proportional to v^{-n}) and a power-law core (rho proportional to w^{-q}), with n > 5.
- domain assumption The progenitor wind has constant mass-loss rate and velocity (s=2 CSM).
- domain assumption The VLBI outer rim traces the forward shock radius.
- ad hoc to paper The simultaneous breaks at about 3100 days in radio and X-ray light curves are caused by the reverse shock entering the ejecta core.
- ad hoc to paper The optical H-alpha and low-ionization line emission in the box-profile phase arises from the partially ionized zone near the envelope-core transition, not from a cold shell.
- domain assumption Bremsstrahlung and line-cooling rates and the X-ray absorption column formula from Fransson et al. (1996) apply to SN 1993J.
Cite this review
Pith. "Pith review of The initial evolution of SN 1993J: Piston phase versus standard model." pith.science (2026). https://pith.science/paper/J3KMSNRT
@misc{pith2026250607137,
  author       = {Pith},
  title        = {Pith review of: The initial evolution of SN 1993J: Piston phase versus standard model},
  year         = {2026},
  howpublished = {\url{https://pith.science/paper/J3KMSNRT}},
  note         = {Machine review of arXiv:2506.07137}
}
read the original abstract
The evolution of SN 1993J is unlikely to be self-similar. Spatially resolved VLBI-observations show that the velocity of the outer rim of the radio emission region brakes at a few hundred days. The reason for this break remains largely unknown. It is argued here that it is due to the transition between an initial piston phase to a later phase, which is described by the standard model. The properties of the reverse shock are quite different for a piston phase as compared to the standard self-similar model. This affects the expected X-ray emission; for example, the reverse shock becomes transparent to X-ray emission much earlier in the piston phase. Furthermore, it is shown that the observed box-like emission line profiles of H_alpha and other optical lines are consistent with an origin from the transition region between the envelope and the core. It is also pointed out that identifying the observed, simultaneous breaks at approximately 3100 days in the radio and X-ray light curves with the reverse shock reaching the core, makes it possible to directly relate the mass-loss rate of the progenitor star to observables.
Figures


Reference graph
Works this paper leans on
-
[1]
Bartel, N., Bietenholz, M.F., Rupen, M.P., et al., 1994, , 368, 610
work page 1994
-
[2]
Bartel, N., Bietenholz, M.F., Rupen, M.P., et al., 2002, , 581, 404
work page 2002
-
[3]
Bietenholz, M., Bartel, N., Rupen, M.P., et al. 2010, Proceeding of Science: 10th European VLBI Network Symposium and EVN Users Meeting: VLBI and the New Generation of Radio Arrays. Manchester, UK. Published online at http://pos.sissa.it/cgi-bin/reader/conf.cgi?confid=125, id.57
work page 2010
-
[4]
Bj\" o rnsson, C.-I., 2015, , 813, 43
work page 2015
-
[5]
Blinnikov, S.I., Eastman, R., Bartunov, O.S., Popolitov, V.A., & Woosley, S.E., 1998, , 496, 454
work page 1998
-
[6]
Brose, R., Sushch, I., Pohl, M., Luken, K.J., Filipovi\' c & Lin, R., 2019, , 627, A166
work page 2019
-
[7]
Chandra, P., Dwarkadas, V.V., Ray, A., Immler, S., & Pooley, D., 2009, , 699, 388
work page 2009
-
[8]
Chevalier, R.A., 1982a, , 258, 790
Show all 39 references
-
[9]
Chevalier, R.A., 1982b, , 259, 302
-
[10]
Chevalier, R.A., & Fransson, C., 1994, , 420, 268
1994
-
[11]
Coughlin, E.R., 2024, , 975, L14
2024
-
[12]
de Witt, A., Bietenholz, M.F., Kamble, A., et al., 2016, , 455, 511
2016
-
[13]
Dickel, J.R., van Breugel, W.J.M., & Strom, R.G., 1991, , 101, 2151
1991
-
[14]
Fransson, C., Lundqvist, P., & Chevalier, R.A., 1996, , 993, 1008
1996
-
[15]
Fransson, C., & Bj\" o rnsson, C.-I., 1998, , 509, 861
1998
-
[16]
Fransson, C., Challis, P.M., Chevalier, R.A., et al., 2005, , 622, 991
2005
-
[17]
Freedman, W.L., Hughes, S.M., Madore, B.F., et al., 1994, , 427, 628
1994
-
[18]
Gotthelf, E.V., Koralesky,B., Rudnik, L., Jones, T.W., Hwang, U., & Petre, R., 2001, , 552, L39
2001
-
[19]
Hamilton, A.J.S., & Sarazin, C.L., 1984, , 281, 682
1984
-
[20]
Jun, B.-I., & Norman, M.L., 1996, , 465, 800
1996
-
[21]
Krauss, M.I., Soderberg, A.M., Chomiuk, l., et al., 2012, , 750, L40
2012
-
[22]
Kundu, E., Lundqvist, P., Sorokina, E., et al., 2019, , 875, 17
2019
-
[23]
Lewis, J.M., Walton, N.A., Meikle, W.P.S., et al., 1994, , 266, L27
1994
-
[24]
Marcaide, J.M., Mart\' i -Vidal, I., Alberdi, A., et al., 2009, , 505, 927
2009
-
[25]
Marion, G.H., Vinko, J., Kirshner, R.P., et al., 2014, , 781, 69
2014
-
[26]
Mart\' i -Vidal, I., Bj\" o rnsson, C.-I., P\' e rez Torres, M.A., Lundqvist, P., & Marcaide, J.M., 2024, , 691, A171
2024
-
[27]
Matheson, T., Filippenko, A.V., Barth, A.J., et al., 2000a, , 120, 1487
-
[28]
Matheson, T., Filippenko, A.V., Ho, L.C., Barth, A.J., & Leonard, D.C., 2000b, , 120, 1499
-
[29]
Milisavljevic, D., Fesen, R.A., Chevalier, R.A., Kirshner, R.P., Challis, P., & Turatto, M., 2012, , 751, 25
2012
-
[30]
Nadyozhin, D.K., 1985, , 112, 225
1985
-
[31]
Similarity and Dimensional Methods in Mechanics (10th ed.; Boca Raton: CRC)
Sedov, L.I., 1992. Similarity and Dimensional Methods in Mechanics (10th ed.; Boca Raton: CRC)
1992
-
[32]
Suzuki, T., & Nomoto, K., 1995, , 455, 658
1995
-
[33]
Swartz, D.A., Ghosh, K.K., McCollough, M.L., et al., 2003, , 114, 213
2003
-
[34]
Truelove, J.K., & McKee, C.F., 1999, , 120, 299
1999
-
[35]
Uno, S., Mitsuda, K., Inoue, H., et al., 2002, , 565, 419
2002
-
[36]
2007, , 671, 1959
Weiler, K.W., Williams, C.L., Panagia, N., et al. 2007, , 671, 1959
2007
-
[37]
Woosley, S.E., Eastman, R.G., Weaver, T.A., & Pinto, P.A., 1994, , 429, 300
1994
-
[38]
Woosley, S.E., 2019, , 878, 49
2019
-
[39]
Zimmerman, H.-U., Aschenbach, B., 2003, , 406, 969
2003
Reviewed August 7, 2026 · model on record in the stance chip above.
Discussion (0). Sign in to comment.