REVIEW 4 major objections 5 minor 33 references
A Connection between Spectral Width and Energetics As Well As Peak Luminosity in Fermi Gamma-Ray Bursts
T0 review · 4 major / 5 minor · reviewed 2026-08-14 · deepseek-v4-flash
Pith's one-line read The paper claims that the spectral width of a gamma-ray burst's prompt-emission spectrum correlates positively with its isotropic-equivalent energy and peak luminosity, so wider bursts are more energetic and more luminous.
desk verdict The observer-frame width correlations are solid; the rest-frame W–Eiso/Liso claim rests on a brightness-dependent model-selection effect and a post-hoc outlier cut that the paper itself cannot rule out. read the letter →
The pith
A machine-rendered reading of the paper's core claim, the machinery that carries it, and where it could break.
The reading
What carries the argument
The machine carrying the argument is the spectral width $W=\log(E_2/E_1)$, where $E_1$ and $E_2$ are the lower and upper energies at half maximum of the $E F_E$ spectrum. The paper computes $W$ from the Fermi GBM catalog's 'BEST' model fits, which include the Band function, a cutoff power law, and a smoothly broken power law; this matters because using only Band fits would overestimate the width. The authors also use an absolute width analogue and its rest-frame counterpart, showing that the correlations with $E_{\mathrm{iso}}$ and $L_{\mathrm{iso}}$ tighten when that quantity is used, so the width itself, not the fitted model, is doing the explanatory work.
What would settle it
A decisive test is to simulate BAND spectra with known input luminosities and energies, fold them through the GBM detector response at a range of signal-to-noise ratios, fit them with the same COMP and BAND models used for the catalog, and recompute W from the recovered best-fit parameters; if the recovered widths no longer track the input energy and luminosity once model-selection ambiguity is included, the observed correlation is a fitting artifact rather than an intrinsic property.
Extended reading notes
Core claim
On its own terms, the paper's discovery is that the relative spectral width of GRB prompt emission, previously studied mainly as a diagnostic of radiation mechanisms, is also an energetics indicator. Using the Fermi GBM catalog's best-fitting spectral model rather than a Band-only assumption, the authors find that the median width of long bursts exceeds that of short bursts, with the short bursts extending the long-burst trend to lower widths. In the rest frame, they report Spearman correlations between $W$ and $E_{\mathrm{iso}}$ and between $W$ and the 1024 ms peak luminosity for time-integrated F spectra, and tighter correlations when an absolute width measure is used. The authors are explicit that scatter is large and that model-selection effects contaminate the width, but they conclude that the correlations are intrinsic enough that spectral shape is tied to GRB energetics.
Load-bearing premise
The result depends on the Fermi catalog's best-fit spectral parameters being reliable: if those fits are biased for faint bursts, both the measured width and the derived energy and luminosity are biased in ways that could create or distort the correlation.
Editorial extensions
If this is right
- If the correlation holds up, spectral width becomes a redshift-independent luminosity indicator: a measured width would place a burst on the $E_{\mathrm{iso}}$ or $L_{\mathrm{iso}}$ scale, and a calibrated relation could produce a Hubble diagram for GRBs.
- Prompt-emission models would need to explain why more energetic bursts produce broader spectra, narrowing the space of viable radiation mechanisms beyond the blackbody and synchrotron cases the paper already disfavors.
- Because short bursts extend the long-burst trend to smaller widths, the same width–energetics scaling may connect the two GRB classes despite their different progenitors.
- The width–energy correlation sits alongside the established peak-energy–isotropic-energy correlation, suggesting that spectral shape encodes energetics through more than just the peak energy $E_p$.
Reading between the lines
- The paper does not test whether the correlation survives when the width and the energy or luminosity are derived from independent data; a natural extension would be to measure widths from time-resolved spectra alone and energies from bolometric light curves, then compare.
- Because the correlations are stronger for time-integrated F spectra than for peak-flux P spectra, an implicit physical claim is that the emission episode as a whole carries the energetics signal; this could be tested by checking whether the relation steepens when spectra are summed over longer intervals.
- A practical consequence left implicit is that a confirmed $W$–$L_{\mathrm{iso}}$ relation gives a purely spectral distance indicator that does not require $E_p$ or a light-curve fit, potentially extending GRB cosmology to bursts without measured redshift.
- The paper's own COMP-versus-BAND simulation could be repurposed as a falsifier: inject BAND spectra with known $E_{\mathrm{iso}}$ and $L_{\mathrm{iso}}$ through the GBM response, recover best-fit widths, and see whether the recovered $W$ still tracks the input luminosity despite the model-selection ambiguity.
Signed reviews
Editorial analysis
A structured set of objections, weighed in public.
Referee Report
Summary. This paper re-examines the spectral width W of gamma-ray burst (GRB) prompt-emission spectra, defined via the full-width at half-maximum in the EF(E) representation, using the BEST spectral fits (BAND, COMP, SBPL) from the Fermi GBM Burst Catalog. The authors compute W for both peak-flux (P) and time-integrated (F) spectra, compare the distributions for long and short bursts, and then test correlations of W with duration, fluence, peak flux, and, for a redshift-known subsample, with isotropic-equivalent energy E_iso and isotropic-equivalent peak luminosity L_iso. They report positive correlations in the observer frame, and positive rest-frame correlations for F spectra which become stronger after removing ~30% of the data as outliers and after switching from the relative width to an absolute width. The paper concludes that wider bursts have larger energy and luminosity and suggests possible use of W as a luminosity indicator.
Significance. If the rest-frame W–E_iso and W–L_iso correlations are genuine, they would add a new observable spectral-shape indicator to the known empirical relations (e.g., Amati, Yonetoku) and could potentially be calibrated as a distance indicator. A strength of the paper is that it explicitly performs simulations to test the reliability of the model selection, rather than taking the BEST catalog at face value. However, those same simulations identify a serious brightness-dependent model-selection bias that the paper does not correct, and the rest-frame claim rests on correlations that are modest and obtained after post-hoc data selections. The central claim is therefore plausible but not established to the standard implied by the abstract.
major comments (4)
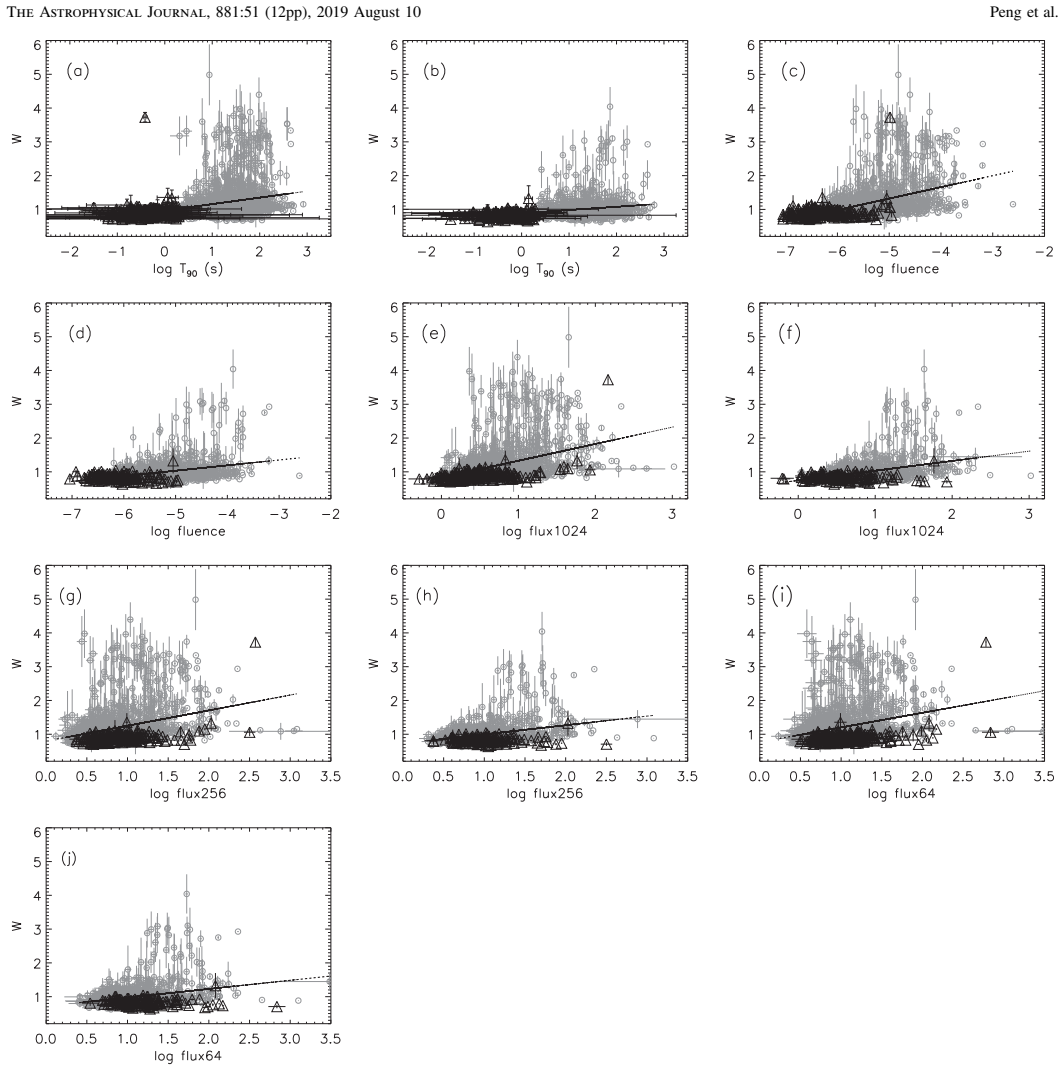
- The simulation in Section 4 directly undercuts the main conclusion. Table 8 shows that the probability of preferring COMP over an injected BAND spectrum increases strongly with decreasing fluence: 0/10000 for GRB171010792 (fluence 6.33e-4), about 33% for GRB120711115, about 57% for GRB170705115, and about 80% for GRB081222204 (fluence 1.19e-5). Combined with Table 2, where COMP widths are systematically smaller (median 0.93–1.02) than BAND/SBPL widths (1.27–1.89), this brightness-dependent mis-selection can produce exactly the positive W–fluence and W–peak flux correlations reported in Section 3.2, and hence the rest-frame W–E_iso/L_iso correlations in Section 3.3. The problem is compounded by Equations (4)–(6), where E_iso and L_iso are k-corrected with the same fitted spectral model that defines W, so any brightness-dependent spectral bias enters both sides of the correlation. The authors acknowledge that 'the spectral parameters are affected by the spectral brightness' but do not correct for this effect or quantify how much of the measured correlation it can generate; this is load-bearing for the central claim.
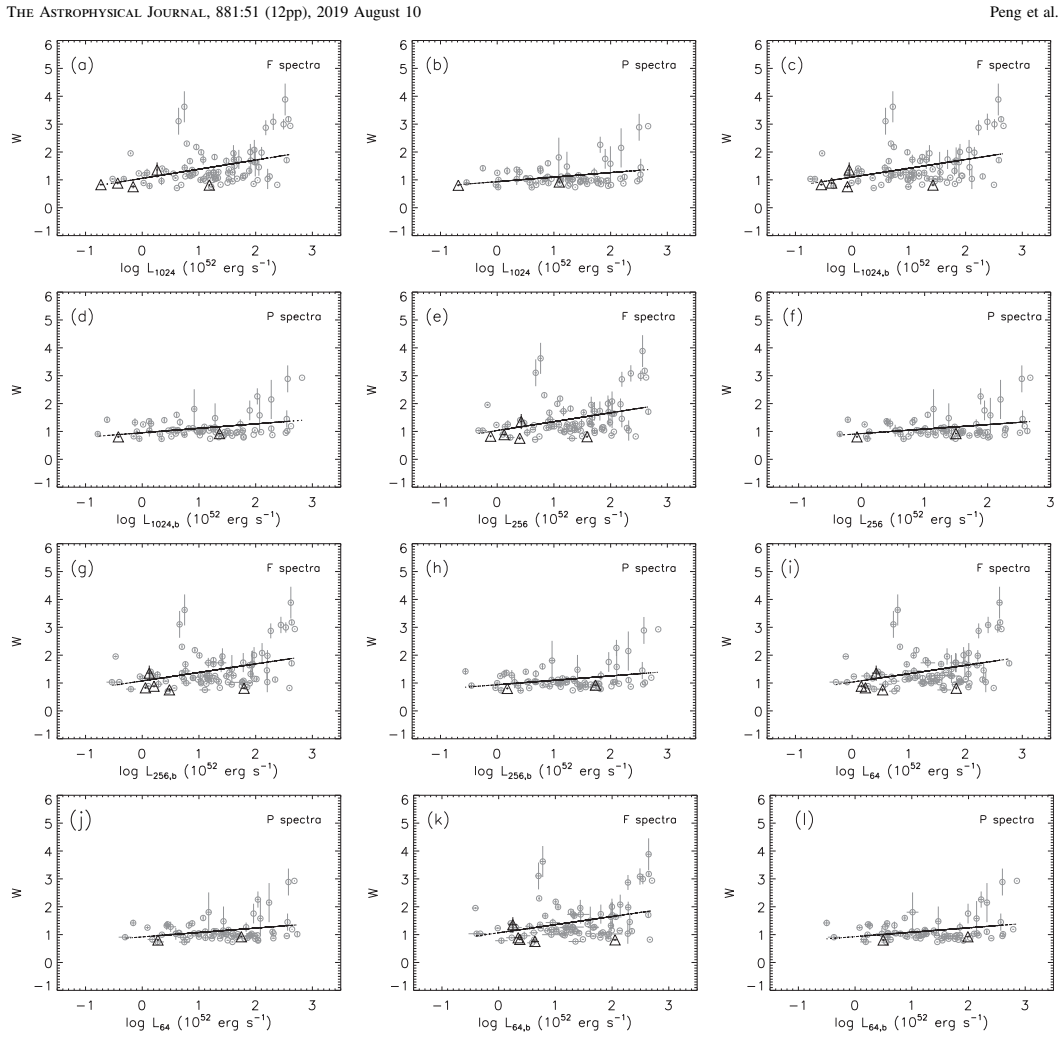
- The rest-frame correlations are not significant for P spectra in any of the parameter pairs: the Spearman coefficients range from 0.08 to 0.17 with all p-values greater than 0.15. The only significant correlations are in the F spectra, with R around 0.26–0.43. Despite this, the abstract and conclusion state without qualification that 'the spectral widths are correlated with energy and peak luminosity in GRBs with known redshifts.' The wording should be limited to the time-integrated F spectra and the modest strength of the correlations should be stated explicitly.
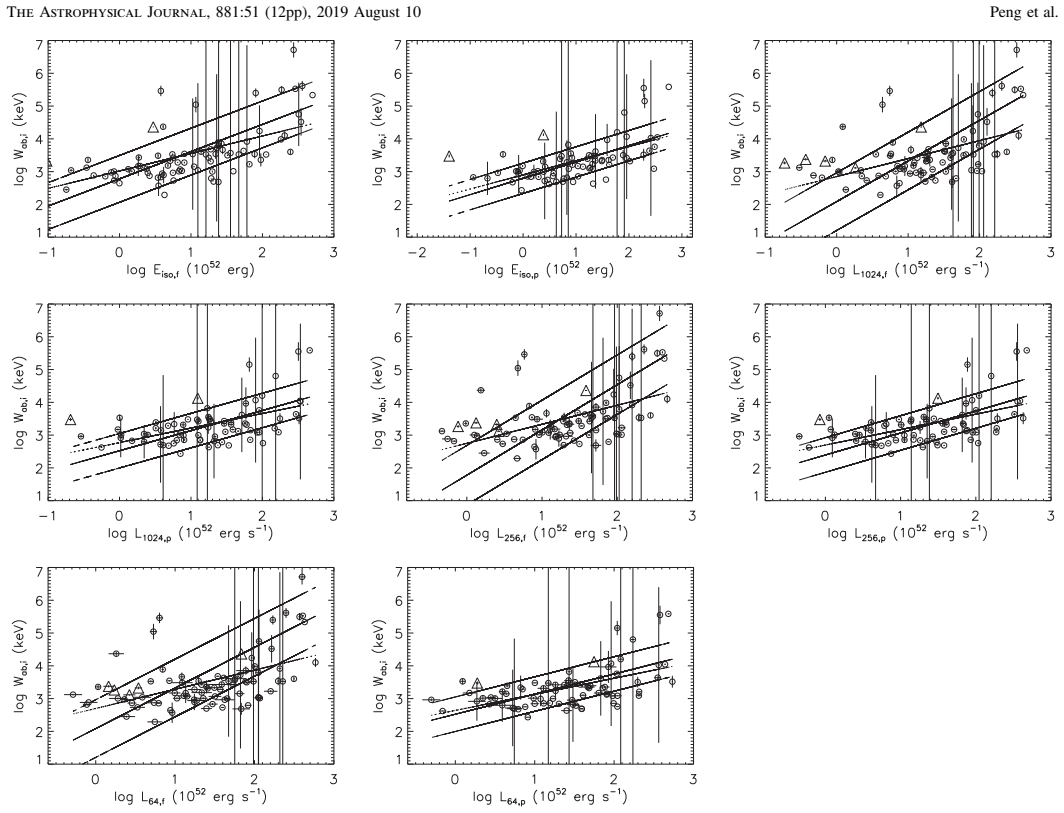
- The large increase in correlation coefficients (from R≈0.3–0.4 to R>0.6) is obtained through two post-hoc procedures: first, removing the outer ~30% of the data as 'outliers' based on an iterative one-intrinsic-scatter cut, and second, replacing the relative width with the absolute width. Neither procedure is justified a priori, and the outlier removal is applied after inspecting the scatter plots and the weak correlations, which creates a serious risk of selection bias. The one-intrinsic-scatter criterion from Hyper-fit is not a standard robust-correlation estimator, and the paper does not report the final sample sizes after the cut, making the results difficult to reproduce or interpret.
- The claim that short bursts 'extend' the long-burst correlation is based on only two (P spectra) and five (F spectra) short bursts with redshifts in the rest-frame sample. Such small numbers cannot support a claim of extension, especially given that the correlations within the long-burst subsample alone are weak (R≈0.24–0.38 for F spectra). This should be presented as a qualitative suggestion requiring a larger sample, not as a result of the present analysis.
minor comments (5)
- The definition of the absolute width is garbled as printed (the equation reads 'Wab = log. 2ab 21'); please provide a clear definition showing how the absolute width differs from the relative width of Equation (1).
- The abstract states 'Our analysis results consist with the previous results'; this should be 'are consistent with.'
- The text reports K-S probabilities of 5.14e-24 and 5.69e-43 for the long versus short width distributions, then states that the distributions are 'perfectly compatible when taking into account the variances.' This is contradictory and should be rephrased to indicate that while the medians differ significantly, there is substantial overlap.
- For short P-spectra bursts, the W–fluence correlation is negative (R=-0.23, p=0.007), which is not discussed in the text; this apparent anti-correlation deserves comment, especially given the small number of short bursts.
- The sentence 'The correlations of the long burst set are weaker than that of the entire burst set' has subject–verb disagreement; it should be 'those of the entire burst set.'
Circularity Check
The rest-frame width–energetics correlation is partly an artifact of the shared BEST spectral fit and brightness-dependent model selection, not a fully independent physical relation.
-
fitted input called prediction
[Section 4, Table 8; Section 3.2, Tables 2 and 4]
"the median widths of the SBPL and BAND model are much larger than that of the COMP model, especially for the F spectra. ... From Table 8 the number of favor for the COMP model instead of the Band model is very different for different fluence classes and the number seems to increase with the decrease of the fluence. ... Based on the median number, our simulation result shows an ∼46% confidence level of improvements in COMP over BAND regardless of S/N."
The spectral-width values are taken from the catalog's BEST model, and the BEST choice is brightness-dependent: dimmer simulated BAND spectra are preferentially re-fit as COMP, while the brightest simulated burst never prefers COMP. Because COMP widths are systematically narrower than BAND/SBPL widths, the W–fluence and W–peak-flux correlations in Section 3.2, and the rest-frame W–Eiso/Liso correlations built on them, can be produced by the model-selection step itself. The paper's own simulation states that 'the spectral parameters are affected by the spectral brightness and the dimmer the bursts, the less accurate the spectral parameters,' so the claimed correlation is partly a fitted-input selection effect rather than an independent physical prediction.
-
other
[Section 3.3, Equations (4)–(6)]
"W = log(E2/E1), where E1 and E2 are the lower and upper energy bounds of the full width at half maximum of the EFE versus E spectra, respectively. ... The isotropic energy E iso and luminosity, L iso ... is given by ... k= ... Eiso = 4π d_L^2 S/(1+z) k ... Liso = 4π d_L^2 F k."
The rest-frame correlation is computed from the same BEST-fit spectral function on both axes: W is the FWHM width of the fitted EFE spectrum, while the k-correction in Eiso/Liso is an integral over that same fitted N(E). The fluence S and peak flux F are also the catalog values associated with the same fit. Thus W and Eiso/Liso are not independent observables: any model-selection or parameter-estimation bias in the fitted spectrum shifts both the width and the k-corrected energy/luminosity in tandem. The 'cosmological rest frame' step therefore does not provide an independent confirmation; it re-expresses the observer-frame correlation using the same fitted parameters.
full rationale
The paper is not circular in the strict definitional sense: W = log(E2/E1) and the k-correction are different functions, and a pure normalization change would move Eiso/Liso without moving W. However, the central rest-frame claim is substantially weakened by shared fitted inputs. The same BEST-model spectrum supplies W, fluence/peak flux, and the k-correction, and the authors' own Section 4 simulations show the COMP-versus-BAND choice is brightness dependent and only about 46% confident. Since COMP widths are systematically smaller than BAND/SBPL widths, the W–fluence and W–luminosity correlations can be manufactured by model selection. The paper itself concedes 'Whether these correlations are intrinsic or not is still uncertain.' I therefore assign a moderate partial-circularity score of 4 rather than 6, because the observer-frame W–T90 and W–peak-flux comparisons are not forced by construction, and the simulation-based caveat is openly disclosed.
Assumptions & free parameters
free parameters (2)
- Outlier cut at one intrinsic scatter (~30% of data removed) =
Outer ~30% removed using Hyper-fit residuals
- Spectral parameter selection cuts =
alpha > -2.0, beta < -2.05
assumptions (4)
- domain assumption The Fermi GBM catalog's BEST model selection correctly identifies the true spectral model for each burst.
- domain assumption Band, COMP, and SBPL functions provide adequate descriptions of GRB spectra for width measurement.
- domain assumption Standard flat LCDM cosmology with H0 = 70, Omega_M = 0.3, Omega_Lambda = 0.7.
- domain assumption Redshifts in the sample are accurate and the bursts are cosmological sources at those distances.
Cite this review
Pith. "Pith review of A Connection between Spectral Width and Energetics As Well As Peak Luminosity in Fermi Gamma-Ray Bursts." pith.science (2026). https://pith.science/paper/J66PPTNX
@misc{pith2026190804663,
  author       = {Pith},
  title        = {Pith review of: A Connection between Spectral Width and Energetics As Well As Peak Luminosity in Fermi Gamma-Ray Bursts},
  year         = {2026},
  howpublished = {\url{https://pith.science/paper/J66PPTNX}},
  note         = {Machine review of arXiv:1908.04663}
}
read the original abstract
We have revisited the spectral width in the EF E spectrum of gamma-ray bursts with the BEST peak flux P and time-integrated F spectral data provided by the Fermi GBM Burst Catalog. We first compute the BEST spectral widths to compare with some typical physics models. Our analysis results consist with the previous results: blackbody emission alone cannot explain the observed spectrum and most of the observed spectra cannot be interpreted by the synchrotron radiation. We then check the correlations between the spectral width and the observable model-independent burst properties of duration, fluence, and peak flux and find that positive correlations exist between them for both the P and F spectra. Moreover, the short burst appears to extend the correlation found for the long burst. We further demonstrate that these positive correlations also exist in the cosmological rest frame; that is, the spectral width correlates with the isotropic-equivalent energy E iso as well as the isotropic-equivalent peak luminosity L iso for different energy bands and timescales. Our results show that the wider bursts have larger energy and luminosity. Moreover, short bursts would appear to extend this trend qualitatively. Taking the Amati relation into account, we tend to believe that the spectral shape is related to energy and luminosity.
Figures


Figures from the paper (4 more)


Reference graph
Works this paper leans on
- [1]
- [2]
-
[3]
L., Matteson, J., Ford, L., et al
Band, D. L., Matteson, J., Ford, L., et al. 1993, ApJ, 413, 281
work page 1993
-
[4]
Bharali, P., Sahayanathan, S., Misra, R., et al. 2017, NewA, 55, 22
work page 2017
-
[5]
Eichler, D., Livio, M., Piran, T., & Schramm, D. N. 1989, Natur, 340, 126
work page 1989
-
[6]
W., Ghisellini, G., Lazzati, D., et al
Ghirlanda, G. W., Ghisellini, G., Lazzati, D., et al. 2004, ApJ, 616, 331
work page 2004
-
[7]
W., van Paradijs, J., Kouveliotou, C., et al
Giblin, T. W., van Paradijs, J., Kouveliotou, C., et al. 1999, ApJL, 524, L47
work page 1999
-
[8]
Goldstein, A., Preece, R. D., Mallozzi, R. S., et al. 2013, ApJS, 208, 21 González, M. M., Sacahui, J. R., Ramirez, J. L., et al. 2012, ApJ, 755, 140
work page 2013
Show all 33 references
-
[9]
2006, The Journal of Experimental Education, 74, 251
Goodwin, L., & Leech, N. 2006, The Journal of Experimental Education, 74, 251
2006
-
[10]
W., et al
Gruber, D., Goldstein, A., von Ahlefeld, V. W., et al. 2014, ApJS, 211, 12
2014
-
[11]
2010, ApJ, 725, 225
Guiriec, S., Briggs, M., Connaughton, V., et al. 2010, ApJ, 725, 225
2010
-
[12]
2011, ApJL, 727, L33
Guiriec, S., Connaughton, V., Briggs, M., et al. 2011, ApJL, 727, L33
2011
-
[13]
2013, ApJ, 770, 32
Guiriec, S., Daigne, F., Hascoët, R., et al. 2013, ApJ, 770, 32
2013
-
[14]
2015b, ApJ, 814, 10 Horváth, I
Guiriec, S., Mochkovitch, R., Piran, T., et al. 2015b, ApJ, 814, 10 Horváth, I. 1998, ApJ, 508, 757 Horváth, I. 2002, A&A, 392, 791 Horváth, I., & Tóth, B. G. 2016, Ap&SS, 361, 155
1998
-
[15]
D., Briggs, M
Kaneko, Y., Preece, R. D., Briggs, M. S., et al. 2006, ApJS, 166, 298
2006
-
[16]
1994, ApJL, 432, L107
Katz, J. 1994, ApJL, 432, L107
1994
-
[17]
1993, ApJL, 413, L101 Lü, H
Kouveliotou, C., Meegan, C., Fishman, G., et al. 1993, ApJL, 413, L101 Lü, H. J., Liang, E. W., Zhang, B.-B., & Zhang, B. 2010, ApJ, 725, 1965
1993
-
[18]
I., & Woosley, S
MacFadyen, A. I., & Woosley, S. E. 1999, ApJ, 524, 262
1999
-
[19]
E., & Paggi, A
Massaro, F., Grindlay, J. E., & Paggi, A. 2010, ApJL, 714, L299
2010
-
[20]
1986, ApJL, 308, L43
Paczynski, B. 1986, ApJL, 308, L43
1986
-
[21]
1998, ApJL, 494, L45
Paczynski, B. 1998, ApJL, 494, L45
1998
-
[22]
D., Briggs, M., Giblin, T., et al
Preece, R. D., Briggs, M., Giblin, T., et al. 2002, ApJ, 581, 1248
2002
-
[23]
D., Briggs, M
Preece, R. D., Briggs, M. S., Mallozzi, R., et al. 1998, ApJ, 496, 849
1998
-
[24]
D., Goldstein, A., Bhat, N., et al
Preece, R. D., Goldstein, A., Bhat, N., et al. 2016, ApJ, 821, 12
2016
-
[25]
2013, MNRAS, 430, 163
Qin, Y., & Chen, Z. 2013, MNRAS, 430, 163
2013
-
[26]
Robotham, A. S. G., & Obreschkow, D. 2015, PASA, 32, 33
2015
-
[27]
R., González, M
Sacahui, J. R., González, M. M., Fraija, N., et al. 2013, EAS Publications Series, 61, 301
2013
-
[28]
2003, ApJL, 583, L67
Schaefer, B. 2003, ApJL, 583, L67
2003
-
[29]
2015, A&A, 454, 1132
Tarnopolski, M. 2015, A&A, 454, 1132
2015
-
[30]
2014, NatPh, 10, 351
Uhm, Z., & Zhang, B. 2014, NatPh, 10, 351
2014
-
[31]
Woosley, S. E. 1993, ApJ, 405, 273
1993
-
[32]
2004, ApJ, 609, 935
Yonetoku, D., Murakami, T., Nakamura, T., et al. 2004, ApJ, 609, 935
2004
-
[33]
2016, A&A, 588, 135 12 The Astrophysical Journal, 881:51 (12pp), 2019 August 10 Peng et al
Yu, H., Preece, R., Greiner, J., et al. 2016, A&A, 588, 135 12 The Astrophysical Journal, 881:51 (12pp), 2019 August 10 Peng et al
2016
Reviewed August 14, 2026 · model on record in the stance chip above.
Discussion (0). Continue with ORCID to comment.