REVIEW 4 major objections 6 minor 46 references
Trinity VII. Predictions for the Observable Correlation Functions of Accreting Black Holes
T0 review · 4 major / 6 minor · reviewed 2026-08-07 · deepseek-v4-flash
Pith's one-line read The Trinity model, fit without any quasar clustering data, predicts the observed quasar correlation functions at 0<z<3.5 within error bars, implying that clustering adds little new information about where quasars live.
desk verdict Trinity's quasar clustering predictions are a useful validation, but the 'no correlation functions' claim is overstated and the comparison needs quantitative grounding. read the letter →
The pith
A machine-rendered reading of the paper's core claim, the machinery that carries it, and where it could break.
The reading
What carries the argument
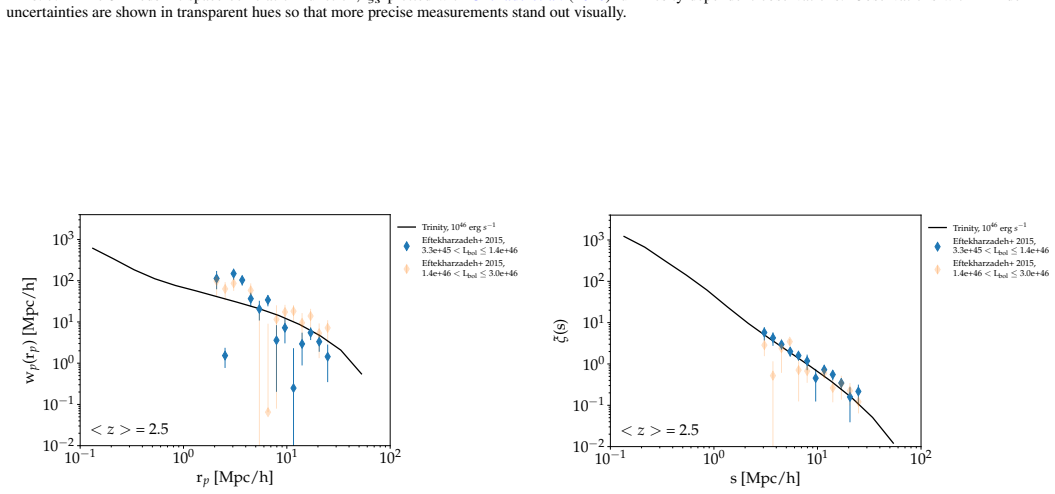
The load-bearing object is the Trinity empirical model of the halo–galaxy–SMBH connection, which assigns each dark matter halo a probability $f_{>L_{\mathrm{thresh}}}(M_h,z)=\int_{L_{\mathrm{thresh}}}^{\infty} P(L|M_h,z)\,dL$ of hosting an actively accreting black hole above a given bolometric luminosity. Applied to the MDPL2 dark matter simulation, this weighting yields predicted projected and redshift-space correlation functions. The decisive feature is that Trinity was never fit to clustering measurements, so the agreement with observed $w_p$ and $\xi(s)$ is a pure, out-of-sample prediction of the model's placement of quasars within halos.
What would settle it
A measurement of quasar clustering for a well-characterized sample at $L_{\mathrm{bol}} \sim 10^{44}\,\mathrm{erg\,s^{-1}}$ at $z \sim 3$ with bias errors smaller than $\sim0.1$ dex would test the paper's luminosity-dependence claim: Trinity predicts that such a sample should cluster within $\sim0.3$ dex of the $L>10^{46}\,\mathrm{erg\,s^{-1}}$ population, so a larger deviation would falsify that prediction.
Extended reading notes
Core claim
The paper's central claim is that Trinity — a self-consistent empirical model of the halo–galaxy–SMBH connection that deliberately excluded quasar clustering from its fitting data — nonetheless reproduces the observed two-point projected and redshift-space quasar correlation functions across $0<z<3.5$ within the quoted uncertainties. Because the prediction was generated by the best-fit model with no correlation-function constraints, the agreement indicates that the halo-occupation information accessible through quasar clustering is largely redundant with information already present in AGN occupation fractions and luminosity functions. The paper further finds that predicted quasar clustering varies by less than $\sim0.3$ dex in bias between bolometric luminosity thresholds of $10^{42}$ and $10^{46}\,\mathrm{erg\,s^{-1}}$ at fixed redshift, since most SMBH growth occurs in halos of roughly $10^{12}$–$10^{13}\,M_\odot$. This shallow luminosity dependence explains the observed lack of luminosity dependence in quasar clustering.
Load-bearing premise
The comparison equates every observed optical quasar sample with a single bolometric luminosity cut at $L_{\mathrm{bol}} > 10^{46}\,\mathrm{erg\,s^{-1}}$, even though real surveys use magnitude and color cuts spanning a range of bolometric luminosities; if those selection differences correspond to different host halo mass distributions, the agreement could be coincidental.
Editorial extensions
If this is right
- Because Trinity was not constrained by clustering data, agreement implies that quasar autocorrelation functions add no significant new information about SMBH halo occupation beyond AGN occupation fractions.
- The predicted variation in clustering bias with luminosity stays below $\sim0.3$ dex from $10^{42}$ to $10^{46}\,\mathrm{erg\,s^{-1}}$, consistent with observations and identifying where the trend would need rare, bright quasars to be seen.
- The model predicts the largest luminosity dependence on scales below $\sim5\,\mathrm{Mpc\,h^{-1}}$, but quasar number densities are too low for autocorrelations to exploit it; quasar–galaxy cross-correlations are the natural probe.
- Because most luminous quasars occupy halos in a narrow mass range at every redshift tested, splitting samples by luminosity or black hole mass yields little clustering contrast — a restriction-of-range effect.
Reading between the lines
- A sharper out-of-sample test would be to refit Trinity with quasar clustering included: the paper's logic predicts the posterior should barely move, so a large shift would expose hidden tension between clustering and occupation-fraction constraints.
- The shallow luminosity dependence implies that current luminosity-binned samples would need roughly an order of magnitude more area to detect the predicted differences, a target that upcoming wide-area quasar surveys could plausibly meet.
- The restriction-of-range argument suggests that grouping quasars by black hole virial mass will continue to show little clustering contrast, but the same argument implies that cross-correlating quasars with galaxies selected by stellar mass could reveal the underlying halo mass trend.
- One testable extension is to compare Trinity's predicted quasar–galaxy cross-correlation functions against existing cross-correlation measurements, which the paper does not compute but which would validate the same halo-occupation placement at higher signal-to-noise.
Editorial analysis
A structured set of objections, weighed in public.
Referee Report
Summary. The paper presents predictions of the projected and redshift-space two-point correlation functions of quasars from the Trinity empirical model, applied to the MDPL2 N-body simulation. Trinity's best-fit halo-galaxy-SMBH connection, which the authors state was not constrained by quasar clustering data, is used with a single bolometric luminosity threshold (L > 10^46 erg/s) to weight halos by the predicted fraction of time they host AGN above the threshold. The predicted wp(rp) and xi(s) are compared visually with a compilation of observed quasar clustering measurements from 2QZ, 2SLAQ, 2QDESp, SDSS, BOSS, and eBOSS over 0 < z < 3.5. The authors claim agreement within observational error bars and conclude that quasar clustering does not add significant information beyond AGN occupation fractions. They also predict a shallow luminosity dependence of quasar clustering and recommend quasar-galaxy cross-correlations as a more promising probe.
Significance. If the agreement is robust, the paper would provide an important demonstration that the halo-galaxy-SMBH connection inferred from luminosity functions and occupation fractions is consistent with quasar clustering, an independent test of Trinity. The luminosity-dependent predictions are falsifiable and useful, and the recommendation for cross-correlations is well reasoned. The paper also compiles a valuable set of observations. However, the lack of a quantitative comparison statistic and the a priori mapping of observed samples to a single luminosity threshold currently prevent the central claim from being fully supported.
major comments (4)
- [Section 2.3 and Abstract] Section 2.3 states that the galaxy-halo connection P(M*|Mh,z) is constrained by 'galaxy number densities and correlation functions,' while the Abstract and Section 1 say Trinity used 'constraints other than correlation functions' and 'no correlation function data.' These statements are contradictory. The paper's main claim that quasar clustering provides no additional information requires only that no quasar clustering data were used; please revise the Abstract and Introduction to say 'no quasar clustering constraints' and clarify in Section 2.3 that galaxy correlation functions do enter the model. Otherwise the reader cannot judge whether the prediction is truly independent of clustering data.
- [Section 3 and Section 5] Section 3 adopts L_thresh = 10^46 erg/s for all observed samples, citing 'typical luminosities' from Ross et al. (2009), but Table 1 includes surveys with very different depths (e.g., BOSS reaches two magnitudes deeper; 2SLAQ reaches g=21.85), and Appendix A shows the same samples contain quasars with L_bol = 10^45 - 10^46 erg/s. The model itself predicts some luminosity dependence (Fig. 5, especially at high L and small scales). If the effective luminosity distribution of an observed sample is centered below 10^46 erg/s, the predicted wp and xi(s) could differ from the single-threshold curve by more than the error bars, making the agreement coincidental. The acknowledgement in Section 5 that 'we cannot reproduce exactly' the selection criteria is not sufficient; please forward-model the bolometric luminosity distributions of each survey or demonstrate that the predictions are insensitive to a plausible range of effective L_thresh.
- [Section 4, Figures 1-4] The central claim that Trinity 'accurately predicts quasar correlation functions within observed error bars' is supported only by visual inspection. No goodness-of-fit statistic is reported, and the model is shown as a single curve with no uncertainty from the Trinity posterior or from the simulation box. This makes it impossible to judge whether deviations (e.g., the apparent downturn in xi(s) at ~2-5 Mpc for z < 2) are statistically significant. Please add a quantitative measure of agreement (e.g., chi-square with degrees of freedom, or a comparison of the inferred bias) and, if feasible, error bands on the model predictions.
- [Section 4, redshift-space xi(s)] The unscattered prediction appears to underpredict xi(s) at small separations in several redshift bins (e.g., z = 2.0-3.0 at ~2-3 Mpc). The paper introduces a 'tested' random scatter of 700 km/s, but this value is not derived from the model or the data; it is an additional parameter. If the agreement with xi(s) relies on this scatter, the claim that the model predicts the redshift-space clustering within error bars is not established for the unscattered model. Please either (a) show that the unscattered prediction is consistent within the quoted errors, or (b) treat the scatter as a systematic and state explicitly how the conclusions change without it.
minor comments (6)
- [Figure 10 caption] The caption for Figure 10 reads 'This is an example figure. Captions appear below each figure,' which is clearly placeholder text; a real caption must be provided, and the cross-reference 'Fig. 9 and ??' in Appendix A should be fixed.
- [Figures 1-4 and Table 1] The survey name is typeset inconsistently as 'da ˆAngela' in several captions and in Table 1; use 'da Ângela' consistently throughout.
- [Section 4] The phrases 'z≲2.0 at ≲5 Mpc' and 'z=2.0-3.0 from ~2-3 Mpc' are ambiguous; please specify the exact redshift bins and scale ranges intended.
- [Abstract] The abstract reports a change in 'bias' of ≲0.3 dex, but the paper computes wp(rp) and xi(s) directly; please define how bias is derived from these correlation functions.
- [Section 2.3] The weighted correlation function estimator is not described; please specify how the weights f>Lthresh are incorporated (e.g., a weighted Landy-Szalay estimator) and how the mean number density normalization is handled.
- [Section 4] The restriction to r_p < 25 Mpc/h is based on a private communication with S. Eftekharzadeh; please provide a public reference or a documented analysis of the systematic issue to make the cut reproducible.
Circularity Check
No circularity: Trinity's quasar correlation functions are an out-of-sample prediction; the only flagged inconsistency is a parenthetical mention of galaxy correlation functions, which does not reduce the prediction to its inputs.
full rationale
The paper's derivation chain is: take the best-fit Trinity model (Zhang et al. 2023b), which was constrained by galaxy stellar mass functions, SMBH-bulge relation, quasar luminosity functions, and AGN occupation fractions; apply it to MDPL2 halos to obtain the probability f>L_thresh(M_h,z) that a halo hosts an AGN above a luminosity threshold; compute wp and xi(s) by weighting halos with f. No quasar clustering measurement appears in the likelihood, so the comparison in Figures 1-4 is an out-of-sample prediction. The choice L_thresh=1e46 erg/s is justified by the reported typical luminosities of the observed samples and the observationally weak luminosity dependence; Appendix A plots luminosity-binned data, so the comparison is not forced by fitting the threshold to the data. I flag one internal inconsistency: Section 2.3's parenthetical 'galaxy number densities and correlation functions (giving P(M*|Mh,z))' conflicts with the abstract and Section 2.2, which list galaxy number densities but not galaxy correlation functions. If galaxy correlation functions were used, the quasar prediction inherits information from galaxy clustering, weakening the 'no correlation functions at all' framing; however, it remains independent of quasar clustering and is not equal by construction to any fitted quantity. The model is self-cited, but that is standard use of a published model; no uniqueness theorem or ansatz is imported. Hence no circular step.
Assumptions & free parameters
free parameters (2)
- Redshift-space velocity scatter =
700 km/s
- Bolometric luminosity threshold L_thresh =
10^46 erg/s
assumptions (4)
- domain assumption Flat LambdaCDM cosmology with h=0.67, Omega_m=0.307, Omega_L=0.693, n=0.96, sigma8=0.823.
- domain assumption The MDPL2 simulation with Rockstar halo finder and Consistent Trees provides a faithful halo population and clustering on scales 0.1-25 Mpc/h.
- domain assumption The best-fit Trinity model is representative of the posterior distribution.
- domain assumption The Trinity luminosity distribution P(L|Mh,z) from the best-fit model is correct.
Cite this review
Pith. "Pith review of Trinity VII. Predictions for the Observable Correlation Functions of Accreting Black Holes." pith.science (2026). https://pith.science/paper/J7PSRT7B
@misc{pith2026250605612,
  author       = {Pith},
  title        = {Pith review of: Trinity VII. Predictions for the Observable Correlation Functions of Accreting Black Holes},
  year         = {2026},
  howpublished = {\url{https://pith.science/paper/J7PSRT7B}},
  note         = {Machine review of arXiv:2506.05612}
}
abstract
The quasar correlation function assesses the occurrence of quasar pairs as a function of separation, which is strongly influenced by quasar host halo masses. The empirical Trinity model recently inferred the redshift-dependent relationship between supermassive black hole (SMBH) mass, galaxy mass, and halo mass, using constraints other than correlation functions (e.g., quasar luminosity functions, active galactic nuclei occupation fractions, and SMBH mass-bulge mass relations). Hence, comparing the predicted quasar correlation functions from Trinity to real observations is an important test of Trinity's inferred SMBH -- halo relation. In this work, we use a compilation of observed two-point projected and redshift-space correlation functions from $0 \leq z \leq 3.5$. We find that Trinity accurately predicts quasar correlation functions within observed error bars, although observations do not have much constraining power at lower redshifts due to smaller observable volumes and lower quasar number densities. This finding is consistent with Trinity having the correct placement of quasars within their host galaxies and dark matter halos, without requiring quasar clustering constraints during model fitting. Using Trinity, we also predict the clustering as a function of quasar bolometric luminosity, finding that existing survey uncertainties are too large to show measurable differences ($\lesssim 0.3$ dex change in bias for $10^{42}$ erg s$^{-1}$ compared to $10^{46}$ erg s$^{-1}$ SMBHs across redshifts). This fact arises because most SMBH growth (and hence quasar luminosity) occurs in halos in a similar mass range ($10^{12}-10^{13} M_\odot$).
Figures


Figures from the paper (8 more)




Reference graph
Works this paper leans on
-
[1]
Aird J., Coil A. L., 2021, @doi [ ] 10.1093/mnras/stab312 , https://ui.adsabs.harvard.edu/abs/2021MNRAS.502.5962A 502, 5962
-
[2]
Aird J., Coil A. L., Georgakakis A., 2018, @doi [ ] 10.1093/mnras/stx2700 , https://ui.adsabs.harvard.edu/abs/2018MNRAS.474.1225A 474, 1225
-
[3]
Behroozi P. S., Wechsler R. H., Wu H.-Y., 2013a, @doi [ ] 10.1088/0004-637X/762/2/109 , https://ui.adsabs.harvard.edu/abs/2013ApJ...762..109B 762, 109
-
[4]
Behroozi P. S., Wechsler R. H., Wu H.-Y., Busha M. T., Klypin A. A., Primack J. R., 2013b, @doi [ ] 10.1088/0004-637X/763/1/18 , https://ui.adsabs.harvard.edu/abs/2013ApJ...763...18B 763, 18
-
[5]
Behroozi P., Wechsler R. H., Hearin A. P., Conroy C., 2019, @doi [ ] 10.1093/mnras/stz1182 , https://ui.adsabs.harvard.edu/abs/2019MNRAS.488.3143B 488, 3143
-
[6]
Bongiorno A., et al., 2012, @doi [ ] 10.1111/j.1365-2966.2012.22089.x , https://ui.adsabs.harvard.edu/abs/2012MNRAS.427.3103B 427, 3103
arXiv 2012
-
[7]
Chehade B., et al., 2016, @doi [ ] 10.1093/mnras/stw616 , https://ui.adsabs.harvard.edu/abs/2016MNRAS.459.1179C 459, 1179
-
[8]
Conroy C., White M., 2013, @doi [ ] 10.1088/0004-637X/762/2/70 , https://ui.adsabs.harvard.edu/abs/2013ApJ...762...70C 762, 70
Show all 46 references
-
[9]
M., et al., 2005, @doi [ ] 10.1111/j.1365-2966.2004.08379.x , https://ui.adsabs.harvard.edu/abs/2005MNRAS.356..415C 356, 415
Croom S. M., et al., 2005, @doi [ ] 10.1111/j.1365-2966.2004.08379.x , https://ui.adsabs.harvard.edu/abs/2005MNRAS.356..415C 356, 415
2005
-
[10]
J., 2009, @doi [ ] 10.1111/j.1365-2966.2009.14429.x , https://ui.adsabs.harvard.edu/abs/2009MNRAS.394.1109C 394, 1109
Croton D. J., 2009, @doi [ ] 10.1111/j.1365-2966.2009.14429.x , https://ui.adsabs.harvard.edu/abs/2009MNRAS.394.1109C 394, 1109
2009
-
[11]
S., et al., 2016, @doi [ ] 10.3847/0004-6256/151/2/44 , https://ui.adsabs.harvard.edu/abs/2016AJ....151...44D 151, 44
Dawson K. S., et al., 2016, @doi [ ] 10.3847/0004-6256/151/2/44 , https://ui.adsabs.harvard.edu/abs/2016AJ....151...44D 151, 44
2016 doi
-
[12]
Eftekharzadeh S., et al., 2015, @doi [ ] 10.1093/mnras/stv1763 , https://ui.adsabs.harvard.edu/abs/2015MNRAS.453.2779E 453, 2779
2015 doi
-
[13]
J., et al., 2011, @doi [ ] 10.1088/0004-6256/142/3/72 , https://ui.adsabs.harvard.edu/abs/2011AJ....142...72E 142, 72
Eisenstein D. J., et al., 2011, @doi [ ] 10.1088/0004-6256/142/3/72 , https://ui.adsabs.harvard.edu/abs/2011AJ....142...72E 142, 72
2011 doi
- [14]
-
[15]
H \"a ring N., Rix H.-W., 2004, @doi [ ] 10.1086/383567 , https://ui.adsabs.harvard.edu/abs/2004ApJ...604L..89H 604, L89
2004 doi
-
[16]
F., Hernquist L., Cox T
Hopkins P. F., Hernquist L., Cox T. J., Kere s D., 2008, @doi [ ] 10.1086/524362 , https://ui.adsabs.harvard.edu/abs/2008ApJS..175..356H 175, 356
2008 doi
-
[17]
Klypin A., Yepes G., Gottl \"o ber S., Prada F., He S., 2016, @doi [ ] 10.1093/mnras/stw248 , https://ui.adsabs.harvard.edu/abs/2016MNRAS.457.4340K 457, 4340
2016 doi
-
[18]
C., 2013, @doi [ ] 10.1146/annurev-astro-082708-101811 , https://ui.adsabs.harvard.edu/abs/2013ARA&A..51..511K 51, 511
Kormendy J., Ho L. C., 2013, @doi [ ] 10.1146/annurev-astro-082708-101811 , https://ui.adsabs.harvard.edu/abs/2013ARA&A..51..511K 51, 511
2013 doi
-
[19]
G., Eisenstein D
Krolewski A. G., Eisenstein D. J., 2015, @doi [ ] 10.1088/0004-637X/803/1/4 , https://ui.adsabs.harvard.edu/abs/2015ApJ...803....4K 803, 4
2015 doi
-
[20]
Laurent P., et al., 2017, @doi [ ] 10.1088/1475-7516/2017/07/017 , https://ui.adsabs.harvard.edu/abs/2017JCAP...07..017L 2017, 017
2017 doi
-
[21]
Li J., et al., 2021, @doi [ ] 10.3847/1538-4357/ac2301 , https://ui.adsabs.harvard.edu/abs/2021ApJ...922..142L 922, 142
2021 doi
-
[22]
J., Ma C.-P., 2013, @doi [ ] 10.1088/0004-637X/764/2/184 , https://ui.adsabs.harvard.edu/abs/2013ApJ...764..184M 764, 184
McConnell N. J., Ma C.-P., 2013, @doi [ ] 10.1088/0004-637X/764/2/184 , https://ui.adsabs.harvard.edu/abs/2013ApJ...764..184M 764, 184
2013 doi
-
[23]
P., Naab T., White S
Moster B. P., Naab T., White S. D. M., 2018, @doi [ ] 10.1093/mnras/sty655 , https://ui.adsabs.harvard.edu/abs/2018MNRAS.477.1822M 477, 1822
2018 doi
-
[24]
P., 2017, @doi [ ] 10.1146/annurev-astro-081913-040019 , https://ui.adsabs.harvard.edu/abs/2017ARA&A..55...59N 55, 59
Naab T., Ostriker J. P., 2017, @doi [ ] 10.1146/annurev-astro-081913-040019 , https://ui.adsabs.harvard.edu/abs/2017ARA&A..55...59N 55, 59
2017 doi
-
[25]
Planck Collaboration et al., 2016, @doi [ ] 10.1051/0004-6361/201525830 , https://ui.adsabs.harvard.edu/abs/2016A&A...594A..13P 594, A13
2016 doi
-
[26]
C., et al., 2018, @doi [ ] 10.3847/1538-4357/aabd7f , https://ui.adsabs.harvard.edu/abs/2018ApJ...858..110P 858, 110
Powell M. C., et al., 2018, @doi [ ] 10.3847/1538-4357/aabd7f , https://ui.adsabs.harvard.edu/abs/2018ApJ...858..110P 858, 110
2018 doi
-
[27]
C., Krumpe M., Coil A., Miyaji T., 2024, @doi [arXiv e-prints] 10.48550/arXiv.2403.03978 , https://ui.adsabs.harvard.edu/abs/2024arXiv240303978P p
Powell M. C., Krumpe M., Coil A., Miyaji T., 2024, @doi [arXiv e-prints] 10.48550/arXiv.2403.03978 , https://ui.adsabs.harvard.edu/abs/2024arXiv240303978P p. arXiv:2403.03978
-
[29]
Rodr \' guez-Puebla A., Behroozi P., Primack J., Klypin A., Lee C., Hellinger D., 2016, @doi [ ] 10.1093/mnras/stw1705 , https://ui.adsabs.harvard.edu/abs/2016MNRAS.462..893R 462, 893
2016 doi
-
[30]
P., et al., 2009, @doi [ ] 10.1088/0004-637X/697/2/1634 , https://ui.adsabs.harvard.edu/abs/2009ApJ...697.1634R 697, 1634
Ross N. P., et al., 2009, @doi [ ] 10.1088/0004-637X/697/2/1634 , https://ui.adsabs.harvard.edu/abs/2009ApJ...697.1634R 697, 1634
2009 doi
-
[31]
P., et al., 2007, @doi [ ] 10.1086/518474 , https://ui.adsabs.harvard.edu/abs/2007AJ....134..102S 134, 102
Schneider D. P., et al., 2007, @doi [ ] 10.1086/518474 , https://ui.adsabs.harvard.edu/abs/2007AJ....134..102S 134, 102
2007 doi
-
[32]
Shankar F., et al., 2020a, @doi [Nature Astronomy] 10.1038/s41550-019-0949-y , https://ui.adsabs.harvard.edu/abs/2020NatAs...4..282S 4, 282
-
[33]
Shankar F., et al., 2020b, @doi [ ] 10.1093/mnras/stz3522 , https://ui.adsabs.harvard.edu/abs/2020MNRAS.493.1500S 493, 1500
-
[34]
Shanks T., et al., 2015, @doi [ ] 10.1093/mnras/stv1130 , https://ui.adsabs.harvard.edu/abs/2015MNRAS.451.4238S 451, 4238
2015 doi
-
[35]
Shen Y., 2009, @doi [ ] 10.1088/0004-637X/704/1/89 , https://ui.adsabs.harvard.edu/abs/2009ApJ...704...89S 704, 89
2009 doi
-
[36]
Shen Y., et al., 2009, @doi [ ] 10.1088/0004-637X/697/2/1656 , https://ui.adsabs.harvard.edu/abs/2009ApJ...697.1656S 697, 1656
2009 doi
-
[37]
A., 2012, @doi [Research in Astronomy and Astrophysics] 10.1088/1674-4527/12/8/004 , https://ui.adsabs.harvard.edu/abs/2012RAA....12..917S 12, 917
Silk J., Mamon G. A., 2012, @doi [Research in Astronomy and Astrophysics] 10.1088/1674-4527/12/8/004 , https://ui.adsabs.harvard.edu/abs/2012RAA....12..917S 12, 917
2012 doi
-
[38]
J., Croom S
Smith R. J., Croom S. M., Boyle B. J., Shanks T., Miller L., Loaring N. S., 2005, @doi [ ] 10.1111/j.1365-2966.2005.08870.x , https://ui.adsabs.harvard.edu/abs/2005MNRAS.359...57S 359, 57
2005
-
[39]
S., Dav \'e R., 2015, @doi [ ] 10.1146/annurev-astro-082812-140951 , https://ui.adsabs.harvard.edu/abs/2015ARA&A..53...51S 53, 51
Somerville R. S., Dav \'e R., 2015, @doi [ ] 10.1146/annurev-astro-082812-140951 , https://ui.adsabs.harvard.edu/abs/2015ARA&A..53...51S 53, 51
2015 doi
-
[40]
L., Robertson B
Tinker J. L., Robertson B. E., Kravtsov A. V., Klypin A., Warren M. S., Yepes G., Gottl \"o ber S., 2010, @doi [ ] 10.1088/0004-637X/724/2/878 , https://ui.adsabs.harvard.edu/abs/2010ApJ...724..878T 724, 878
2010 doi
-
[41]
Vogelsberger M., Marinacci F., Torrey P., Puchwein E., 2020, @doi [Nature Reviews Physics] 10.1038/s42254-019-0127-2 , https://ui.adsabs.harvard.edu/abs/2020NatRP...2...42V 2, 42
2020 doi
-
[42]
H., Tinker J
Wechsler R. H., Tinker J. L., 2018, @doi [ ] 10.1146/annurev-astro-081817-051756 , https://ui.adsabs.harvard.edu/abs/2018ARA&A..56..435W 56, 435
2018 doi
-
[43]
Yang J., et al., 2023, @doi [ ] 10.3847/1538-4365/acf99b , https://ui.adsabs.harvard.edu/abs/2023ApJS..269...27Y 269, 27
2023 doi
-
[44]
G., et al., 2000, @doi [ ] 10.1086/301513 , https://ui.adsabs.harvard.edu/abs/2000AJ....120.1579Y 120, 1579
York D. G., et al., 2000, @doi [ ] 10.1086/301513 , https://ui.adsabs.harvard.edu/abs/2000AJ....120.1579Y 120, 1579
2000 doi
-
[45]
F., 2023a, @doi [arXiv e-prints] 10.48550/arXiv.2305.19315 , https://ui.adsabs.harvard.edu/abs/2023arXiv230519315Z p
Zhang H., Behroozi P., Volonteri M., Silk J., Fan X., Aird J., Yang J., Hopkins P. F., 2023a, @doi [arXiv e-prints] 10.48550/arXiv.2305.19315 , https://ui.adsabs.harvard.edu/abs/2023arXiv230519315Z p. arXiv:2305.19315
-
[46]
F., Yang J., Aird J., 2023b, @doi [ ] 10.1093/mnras/stac2633 , https://ui.adsabs.harvard.edu/abs/2023MNRAS.518.2123Z 518, 2123
Zhang H., Behroozi P., Volonteri M., Silk J., Fan X., Hopkins P. F., Yang J., Aird J., 2023b, @doi [ ] 10.1093/mnras/stac2633 , https://ui.adsabs.harvard.edu/abs/2023MNRAS.518.2123Z 518, 2123
-
[47]
da \^A ngela J., et al., 2008, @doi [ ] 10.1111/j.1365-2966.2007.12552.x , 383, 565
2008
Reviewed August 7, 2026 · model on record in the stance chip above.
Discussion (0). Sign in to comment.