REVIEW 6 minor 2 cited by
Real-world energy data of 200 feeders from low-voltage grids with metadata in Germany over two years
T0 review · 0 major / 6 minor · reviewed 2026-08-03 · deepseek-v4-flash
Pith's one-line read A new public dataset records 200 German low-voltage feeders at one-minute resolution over two years, with detailed metadata on solar panels, heat pumps, and EV chargers.
desk verdict A genuinely useful public dataset of 200 German LV feeders at 1-minute resolution over two years, described by a careful, transparent data descriptor; the main risk is metadata accuracy, which the authors openly acknowledge. read the letter →
The pith
A machine-rendered reading of the paper's core claim, the machinery that carries it, and where it could break.
The reading
What carries the argument
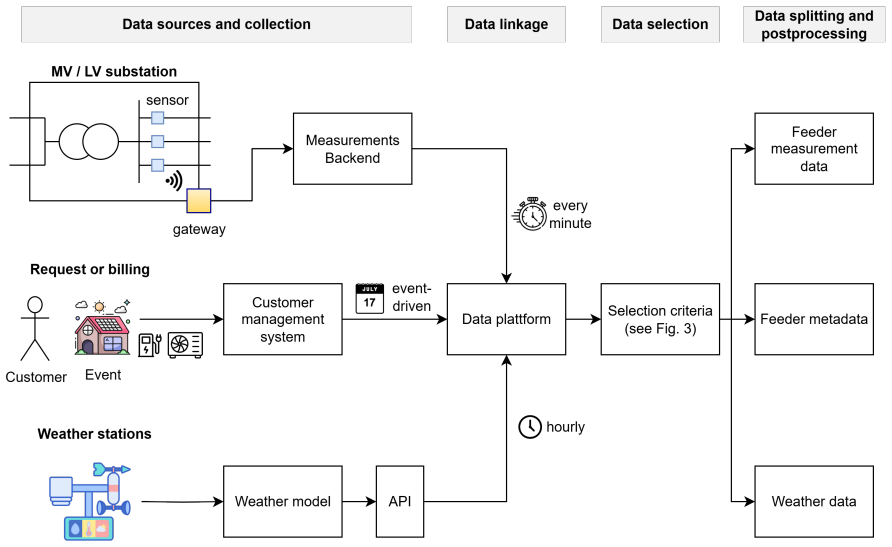
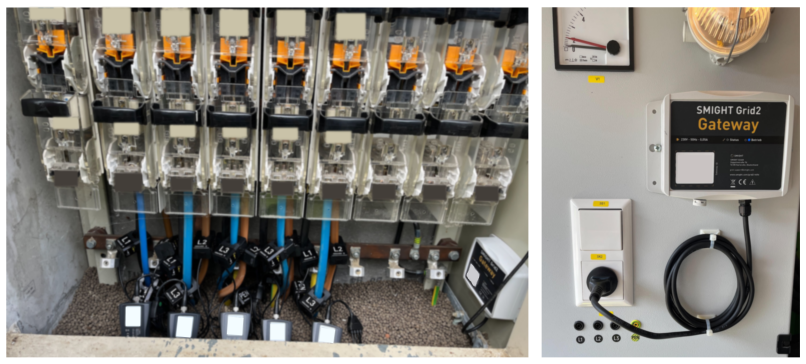
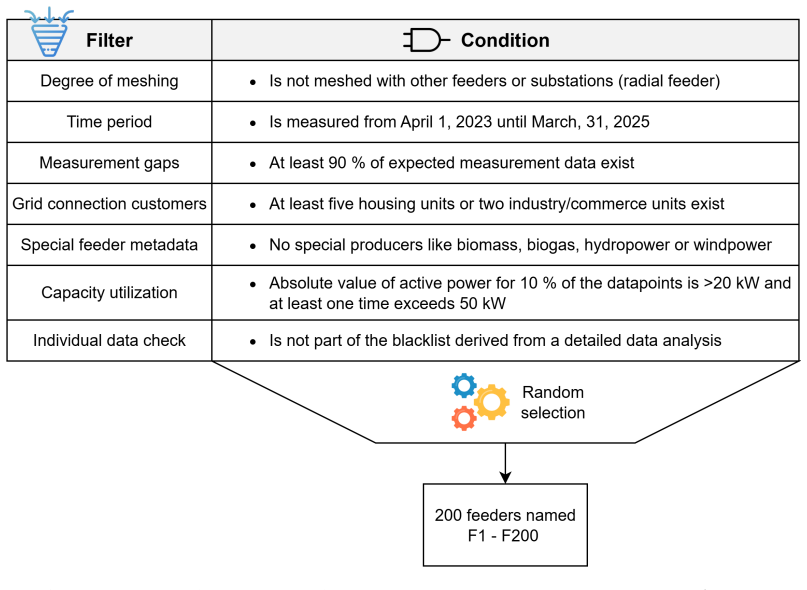
The dataset itself is the central object, produced by a measurement chain: clip-on current sensors on each feeder phase measure RMS currents, a gateway measures a single-phase voltage and derives active/reactive power and power factor, and a customer management system supplies equipment-level metadata, matched via zip code to hourly weather from a numerical weather prediction model. A set of selection filters (radial grid, ≥90% data completeness, privacy thresholds, capacity utilization) ensures high-quality, interpretable feeders.
What would settle it
Compare the recorded installed PV capacity against the measured midday feed-in peaks for a random sample of feeders; if many feeders show persistent unexplained shortfalls or surpluses, the metadata's trustworthiness—and with it the dataset's flagship interpretability—is called into question.
Extended reading notes
Core claim
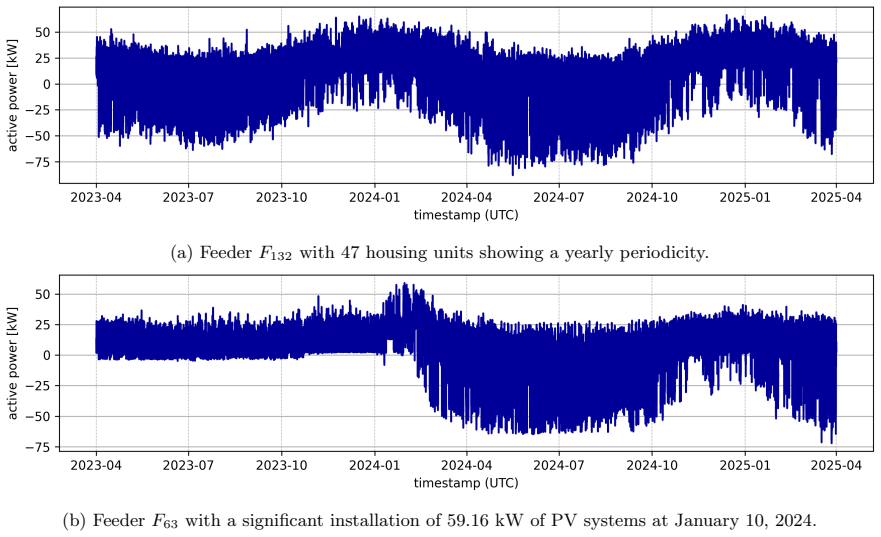
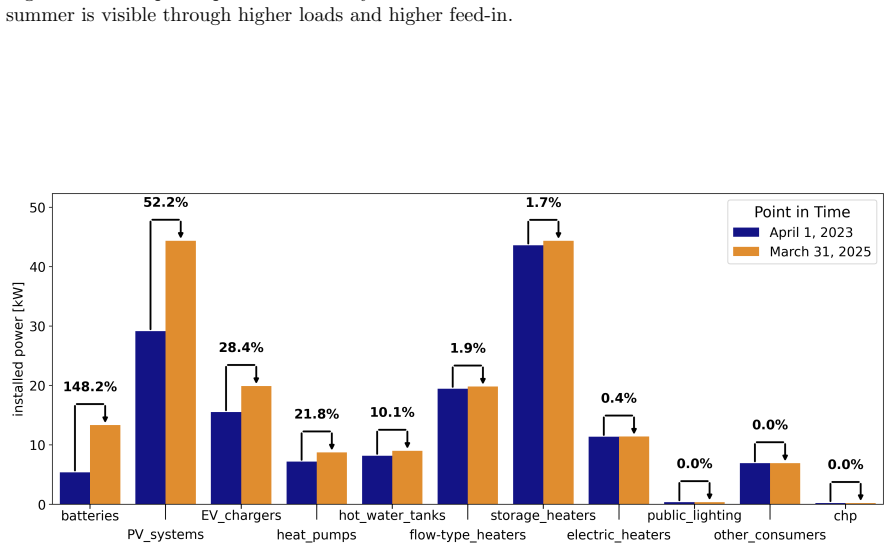
FeederBW is a dataset of 200 low-voltage feeders in Baden-Württemberg, Germany, containing 209,189,649 rows of one-minute feeder measurements plus hourly weather data and 1,608 rows of event-driven metadata. The measurements include voltage (one phase), active/reactive/apparent power, phase currents, and power factors, with about 99.36% completeness. The metadata records housing units, industry/commerce counts, installed power of PV, batteries, EV chargers, heat pumps, storage heaters, and other equipment, updated when customer connections change. The paper demonstrates plausible patterns—weekly load shapes, seasonal feed-in, and a clear two-year increase in installed PV and battery capacity
Load-bearing premise
The feeder metadata from the utility's customer management system accurately reflects the actual equipment, housing units, and industrial loads connected to each feeder, despite acknowledged unregistered devices and registration delays.
Editorial extensions
If this is right
- Researchers can train and benchmark load forecasting models on real, minute-level feeder data with weather context, improving reproducibility in low-voltage research.
- Feeder-level non-intrusive load monitoring becomes feasible on aggregated residential/commercial loads, potentially identifying the operation of heat pumps, EV chargers, and PV systems.
- The combination of weather and metadata allows studying how solar irradiance, temperature, and installed low-carbon capacity drive feeder load and feed-in patterns.
- The two-year span with recorded PV installation events provides a natural experiment for estimating the grid impact of rooftop solar and battery adoption.
- The dataset can serve as a realistic basis for generating synthetic low-voltage grid scenarios, supporting power flow simulations without exposing topology.
Reading between the lines
- The metadata accuracy is the key risk: unregistered equipment, registration-to-operation delays, and topology changes not documented in the data could systematically bias any model trained on FeederBW, especially for feeders where such events are common.
- Because only one phase voltage is measured and the formula S = sqrt(P² + Q²) fails under opposing phase flows, users should treat apparent power as the safer thermal indicator, a nuance the paper explicitly notes but which might be overlooked in practice.
- The recommended locational and temporal splits could become a de facto benchmark, but the paper does not validate them across many algorithms; users may need to test sensitivity to split choice.
- Combining FeederBW with publicly available synthetic grid topologies (not included) could enable full power-flow studies, but such integration is left for future work.
Signed reviews
Editorial analysis
A structured set of objections, weighed in public.
Referee Report
Summary. The paper describes FeederBW, a public dataset of real-world measurements from 200 low-voltage feeders in Baden-Württemberg, Germany, over two years (April 2023–March 2025). The dataset comprises 209,189,649 rows of one-minute feeder measurements (voltage, phase currents, active/reactive/apparent power, power factors, PEN current), event-driven feeder metadata (housing units, installed capacities of PV, batteries, heat pumps, EV chargers, etc., and aggregated industry/commerce consumption), and hourly weather data from the ICON-D2 NWP model. The authors describe the measurement hardware and accuracy, selection criteria, data records, technical validation using quantile profiles, and detailed limitations. The dataset is available on Zenodo with a DOI, and the paper recommends train-test splits for ML applications.
Significance. If the dataset exists as described, FeederBW fills a clear gap in publicly available low-voltage grid data: it combines a relatively large number of feeders (200), one-minute resolution, weather data, and detailed consumer/producer metadata, which is rare in existing datasets. The paper is commendably transparent about hardware limitations (3% accuracy, single-phase voltage, PEN measurement issues), metadata error sources, and selection biases. The public Zenodo release with a DOI and the explicit train-test split recommendations are practical strengths that support reproducibility and comparability of ML studies. No code is provided, and the technical validation is qualitative, but the availability of the data itself makes this a useful community resource.
minor comments (6)
- [Limitations in the feeder measurement data] The definition of λ_tot is garbled in the sentence: 'filtered based on the total power factor λ_tot = P λL1 +λL2 +λL3'. It should presumably read λ_tot = λ_L1 + λ_L2 + λ_L3. In the same paragraph, the active currents for feeder F127 are listed as I_L1,act = −43 A, I_L2,act = −48 A and I_L1,act = 84 A; the third current should be I_L3,act. Please correct these typographical errors.
- [Limitations in the feeder metadata] The text contains several wording errors: 'this is not necessary the case' should be 'not necessarily the case'; 'for shops and hairdresser' should be 'shops and hairdressers'; 'F181 has only around two third' should be 'two thirds'. These are minor but should be fixed.
- [Limitations in the weather data] The sentence 'Null values only occur in columns now height m' contains a typo: 'now height' should be 'snow height'. Also consider rephrasing the following sentence 'In applications and models you can assume 0 m' to a more formal style, e.g., 'A value of 0 m can be assumed'.
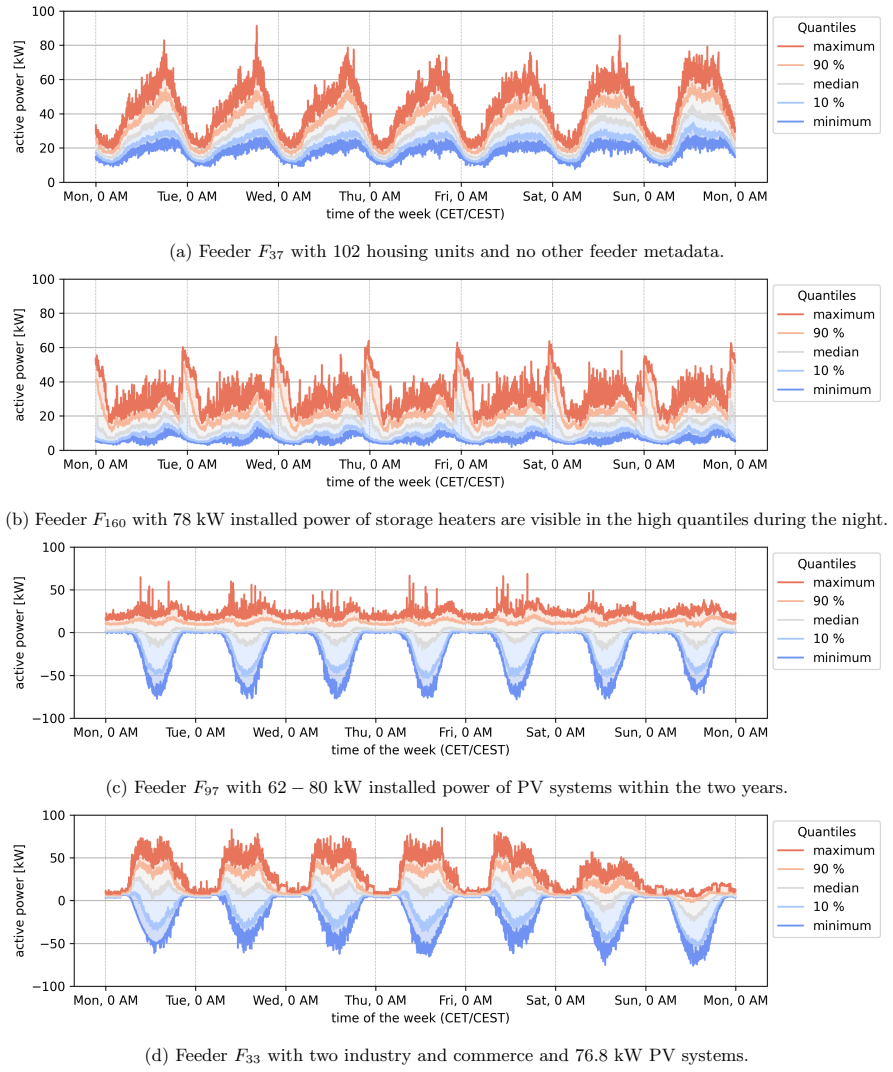
- [Technical Validation] The validation is largely qualitative, based on four weekly quantile plots and two time-series plots. The statement 'we conducted extensive checks and validation to all of them' is not backed by concrete numbers. Consider adding a small table of summary statistics (e.g., per-feeder ranges of active power, missing-data rates) or a short quantitative description of the checks performed on current, voltage, and power-factor plausibility. This would strengthen the data quality assessment without requiring exhaustive validation.
- [Methods / Data Records] The weather data are outputs of the numerical weather prediction model ICON-D2, not ground-based station measurements. This is stated in the Methods, but readers may overlook it in Table 1 and the Data Records. Please explicitly note in the weather data section or as a footnote to Table 1 that these are NWP model outputs, not direct observations.
- [Further background information] There are several language issues in this section: 'a obligation' should be 'an obligation', 'prized' should be 'priced', and 'shortly summarize' should be 'briefly summarize'. Also, the sentence 'The data is collected after accounting for grid losses in the LV grid' is ambiguous; if the measurements are at the feeder, they include network losses, so consider rephrasing to clarify the relationship between measured values and customer consumption.
Circularity Check
No significant circularity: the paper is a data descriptor whose central claim is the existence and properties of FeederBW, not a derived prediction; self-citations are illustrative, not load-bearing.
full rationale
FeederBW is a dataset descriptor, and its central claim is empirical existence: real-world feeder measurements, metadata, and weather data are collected, filtered, and published on Zenodo. There is no derivation chain in which an output quantity is defined by, or fitted to, an input quantity. The 'Technical Validation' section compares measured active-power weekly profiles to feeder metadata (e.g., storage heaters in F160, PV feed-in in F97); this is a consistency check of real measurements against independent registry data, not a prediction obtained from a fitted parameter. The selection criteria (radial grids, time period, measurement completeness, privacy thresholds, capacity utilization) are curation filters, not circular definitions of the dataset's content. The paper cites prior work by overlapping authors ([22] on pseudo-measurements, [26] on the data platform), but these citations are used as example applications or internal infrastructure, not as evidence that defines or validates the dataset itself. The manuscript explicitly and prominently discloses limitations in feeder measurement data and feeder metadata (unregistered equipment, inaccurate assignment, registration/operation date mismatches, undocumented switching events), which are honest caveats rather than hidden circularity. The only remaining check is external: confirming that the Zenodo deposit matches the stated row counts and schemas. Absence of that verification is not a circularity defect. Therefore the appropriate score is low, with no specific circular step identified.
Assumptions & free parameters
assumptions (5)
- domain assumption The SMIGHT Grid 2 sensor measurements are accurate to the stated 3% tolerance for currents between 5 and 400 A.
- domain assumption The voltage measured on one phase at the busbar is representative enough to compute three-phase power values.
- domain assumption The feeder metadata from the DSO's customer management system correctly describes the downstream customers and equipment.
- domain assumption Weather data from the ICON-D2 model, aggregated by zip code, is representative of the local conditions at each feeder.
- domain assumption The selection criteria (radial grids, ≥90% completeness, ≥5 housing units, capacity utilization threshold) yield a dataset appropriate for the claimed applications.
Cite this review
Pith. "Pith review of Real-world energy data of 200 feeders from low-voltage grids with metadata in Germany over two years." pith.science (2026). https://pith.science/paper/JADOWCBY
@misc{pith2026260203521,
  author       = {Pith},
  title        = {Pith review of: Real-world energy data of 200 feeders from low-voltage grids with metadata in Germany over two years},
  year         = {2026},
  howpublished = {\url{https://pith.science/paper/JADOWCBY}},
  note         = {Machine review of arXiv:2602.03521}
}
read the original abstract
The last mile of the distribution grid is crucial for a successful energy transition, as more low-carbon technology like photovoltaic systems, heat pumps, and electric vehicle chargers connect to the low-voltage grid. Despite considerable challenges in operation and planning, researchers often lack access to suitable low-voltage grid data. To address this, we present the FeederBW dataset with data recorded by the German distribution system operator Netze BW. It offers real-world energy data from 200 low-voltage feeders over two years (2023-2025) with weather information and detailed metadata, including changes in low-carbon technology installations. The dataset includes feeder-specific details such as the number of housing units, installed power of low-carbon technology, and aggregated industrial energy data. Furthermore, high photovoltaic feed-in and one-minute temporal resolution makes the dataset unique. FeederBW supports various applications, including machine learning for load forecasting, conducting non-intrusive load monitoring, generating synthetic data, and analyzing the interplay between weather, feeder measurements, and metadata. The dataset reveals insightful patterns and clearly reflects the growing impact of low-carbon technology on low-voltage grids.
Figures
Figures from the paper (3 more)
Forward citations
Cited by 2 Pith papers
-
A Benchmark for Electrical Load Forecasting Across Grid Levels: Time-Series Transformers Outperform Established Methods
Transformers—especially a standard encoder-decoder—yield the lowest hourly load forecast errors across TSO, low-voltage feeder, and client-level datasets, with 6.6–10.7% error reduction over the best non-Transformer baseline.
-
FETS Benchmark: Foundation Models Enable Scalable and Generalizable Energy Time Series Forecasting
Foundation models outperform dataset-specific machine learning in energy time series forecasting across 54 datasets in 9 categories.
Reference graph
Works this paper leans on
-
[1]
Rolnick, D. et al. Tackling Climate Change with Machine Learning. ACM Comput. Surv.55, 1–96 (2023), doi:10.1145/3485128
doi:10.1145/3485128 2023
-
[2]
Haben, S., Arora, S., Giasemidis, G., Voss, M. & Vukadinovi´ c Greetham, D. Review of low volt- age load forecasting: Methods, applications, and recommendations.Applied Energy304, 117798, doi:10.1016/j.apenergy.2021.117798 (2021)
arXiv 2021
-
[3]
Altamimi, E., Al-Ali, A., Malluhi, Q. M. & Al-Ali, A. K. Smart grid public datasets: Characteristics and associated applications.IET Smart Gridstg2.12161, doi:10.1049/stg2.12161 (2024)
-
[4]
Elahe, M. F., Jin, M. & Zeng, P. Review of load data analytics using deep learning in smart grids: Open load datasets, methodologies, and application challenges.Intl. J. of Energy Research45, 14274–14305, doi:10.1002/er.6745 (2021)
-
[5]
Pereira, L., Costa, D. & Ribeiro, M. A residential labeled dataset for smart meter data analytics. Sci. Data9, 134, doi:10.1038/s41597-022-01252-2 (2022)
-
[6]
Trivedi, R., Bahloul, M., Saif, A., Patra, S. & Khadem, S. Comprehensive Dataset on Electrical Load Profiles for Energy Community in Ireland.Sci. Data11, 621, doi:10.1038/s41597-024-03454-2 (2024)
-
[7]
Athanasoulias, S. et al. The Plegma dataset: Domestic appliance-level and aggregate electricity demand with metadata from Greece.Sci. Data11, 376, doi:10.1038/s41597-024-03208-0 (2024)
-
[8]
Zhou, K., Hu, D., Hu, R. & Zhou, J. High-resolution electric power load data of an industrial park with multiple types of buildings in China.Sci. Data10, 870, doi:10.1038/s41597-023-02786-9 (2023)
Show all 37 references
-
[9]
& Sperstad, I
Sandell, S., Bjerkehagen, D., Birkeland, B. & Sperstad, I. B. Dataset for a Norwegian medium and low voltage power distribution system with industrial loads.Data in Brief48, 109121, doi:10.1016/j.dib.2023.109121 (2023)
2023
-
[10]
Bischof, S. et al. HIPE: An Energy-Status-Data Set from Industrial Production.In Proceedings of the Ninth International Conference on Future Energy Systems599–603. doi:10.1145/3208903.3210278 (ACM, 2018)
2018
-
[11]
Meinecke, S. et al. SimBench—A Benchmark Dataset of Electric Power Systems to Compare Innovative Solutions Based on Power Flow Analysis.Energies13, 3290, doi:10.3390/en13123290 (2020)
2020 doi
-
[12]
Dang-Ha, T.-H., Bianchi, F. M. & Olsson, R. Local short term electricity load forecasting: Automatic approaches. In2017 International Joint Conference on Neural Networks (IJCNN), 4267–4274, doi:10.1109/IJCNN.2017.7966396 (2017)
2017
-
[13]
Weave Smart Meter Data https://weave.energy/ [Accessed on: 23 October 2025]
Centre for AI and Climate & CEIMIA. Weave Smart Meter Data https://weave.energy/ [Accessed on: 23 October 2025]
2025
-
[14]
& Blaabjerg, F
Peyghami, S., Davari, P., Fotuhi-Firuzabad, M. & Blaabjerg, F. Standard Test Systems for Modern Power System Analysis: An Overview.IEEE Ind. Electron. Mag.13, 86–105, doi:10.1109/MIE.2019.2942376 (2019)
2019
-
[15]
Engan, L. M. et al. Reference dataset for semi-urban and rural Norwegian low voltage distribution grids.Data in Brief59, 111453, doi:10.1016/j.dib.2025.111453 (2025). 18
2025
-
[16]
S., Wadi Al-Fatlawi, A., Kumar, L., Fang, Y
Hossain, M. S., Wadi Al-Fatlawi, A., Kumar, L., Fang, Y. R. & Assad, M. E. H. Solar PV high- penetration scenario: an overview of the global PV power status and future growth.Energy Syst. doi:10.1007/s12667-024-00692-6 (2024)
2024 doi
-
[17]
& Hong, T
Shukla, S. & Hong, T. BigDEAL Challenge 2022: Forecasting peak timing of electricity demand. IET Smart Grid7, 442–459, doi:10.1049/stg2.12162 (2024)
2022 doi
-
[18]
OPSCI dataset.Website Elektro Ljubljanahttps://www.elektro- ljubljana.si/projekti/ArtMID/1374/ArticleID/2156/OPSCI-Open-SCI (2023) [Accessed on: 23 October 2025]
Elektro Ljubljana. OPSCI dataset.Website Elektro Ljubljanahttps://www.elektro- ljubljana.si/projekti/ArtMID/1374/ArticleID/2156/OPSCI-Open-SCI (2023) [Accessed on: 23 October 2025]
2023
-
[19]
NTVV Substation dataset.CEDA Archive https://data.ceda.ac.uk/edc/Electricity/NTVV/Substations/Secondary Substations (2012) [Ac- cessed on: 23 October 2025]
Scottish and Southern Energy Power Distribution. NTVV Substation dataset.CEDA Archive https://data.ceda.ac.uk/edc/Electricity/NTVV/Substations/Secondary Substations (2012) [Ac- cessed on: 23 October 2025]
2012
-
[20]
Flexible Networks for a Low Carbon Future dataset.Website SP Energy Networkshttps://www.spenergynetworks.co.uk/pages/flexible network data share.aspx [Accessed on: 23 October 2025]
SP Energy Networks. Flexible Networks for a Low Carbon Future dataset.Website SP Energy Networkshttps://www.spenergynetworks.co.uk/pages/flexible network data share.aspx [Accessed on: 23 October 2025]
2025
-
[21]
& Sossan, F
Nespoli, L., Medici, V., Lopatichki, K. & Sossan, F. Hierarchical Demand Forecasting Benchmark for the Distribution Grid.Zenododoi:10.5281/ZENODO.4549296 (2019)
2019 doi
-
[22]
Treutlein, M. et al. Generating peak-aware pseudo-measurements for low-voltage feeders using metadata of distribution system operators.IET Smart Grid8, e12210, doi:10.1049/stg2.12210 (2025)
2025 doi
-
[23]
Wilkinson, M. D. et al. The F AIR Guiding Principles for scientific data management and stew- ardship.Sci. Data3, 160018, doi:10.1038/sdata.2016.18 (2016)
2016 doi
-
[24]
Betriebsanleitung SMIGHT Grid 2
SMIGHT GmbH. Betriebsanleitung SMIGHT Grid 2. https://smight.com/wp- content/uploads/Grid2 Betriebsanleitung DE-23.07.28.pdf (2022) [Accessed on: 23 October 2025]
2022
-
[25]
Reinert, D. et al. DWD Database Reference for the Global and Regional ICON and ICON- EPS Forecasting System. https://dwd.de/DWD/forschung/nwv/fepub/icon database main.pdf [Accessed on: 23 October 2025]
2025
-
[26]
B¨ ottcher, A. Professionelles Datenmanagement in Form eines digitalen Zwill- ings.ew - Magazin f¨ ur Energiewirtschaft7-8, 2024, https://emagazin.ew- magazin.de/de/profiles/a21024e15cd4/editions/e247bfbdbbe6edd3e6b5/pages/page/27 (2024) [Accessed on: 23 October 2025]
2024
-
[27]
Treutlein, M. et al. (2025). Real-world energy data of 200 feeders from low-voltage grids with metadata in Germany over two years (v1.0). Zenodo. 10.5281/zenodo.17831177
2025 doi
-
[28]
Apache Parquet
Vohra, D. Apache Parquet. inPractical Hadoop Ecosystem325–335, doi:10.1007/978-1-4842-2199- 0 8 (Apress, Berkeley, CA, 2016)
2016 doi
-
[29]
Repr¨ asentative VDEW-Lastprofile
VDEW. Repr¨ asentative VDEW-Lastprofile. https://www.bdew.de/energie/standardlastprofile- strom/ (1999) [Accessed on: 23 October 2025]
1999
- [30]
-
[31]
Energy-charts
Burger, B. Energy-charts. https://www.energy-charts.info/index.html?l=en&c=DE [Accessed on: 23 October 2025]
2025
-
[32]
& Schmidt, F
Schill, W.-P., Roth, A., Gu´ eret, A. & Schmidt, F. Ampel-Monitor Energiewende: ambitionierte Ziele, aber zu geringe Dynamik.Wirtschaftsdienst104, 427–430, doi:10.2478/wd-2024-0110 (2024)
2024 doi
-
[33]
Major factors affecting cable ampacity.In Power Engineering Society General Meeting 6 pp
De Leon, F. Major factors affecting cable ampacity.In Power Engineering Society General Meeting 6 pp. doi:10.1109/PES.2006.1708875 (IEEE, 2006). 19
2006
-
[34]
Ma, C. et al. Evaluation of energy losses in low voltage distribution grids with high penetration of distributed generation.Applied Energy256, 113907, doi:10.1016/j.apenergy.2019.113907 (2019)
2019
-
[35]
& Grandel, M
K¨ ubler, C., Essers, J., Niehs, E., Engel, B. & Grandel, M. Ereignisvariable Tarife zur Lastver- schiebung von steuerbaren Verbrauchseinrichtungen im Prosumer-Haushalt.HMD61, 958–990, doi:10.1365/s40702-024-01084-1 (2024)
2024 doi
-
[36]
& Schulz, D
Heuck, K., Dettmann, K.-D. & Schulz, D. inElektrische Energieversorgung: Erzeugung, ¨Ubertra- gung und Verteilung elektrischer Energie f¨ ur Studium und Praxis, 667-668, doi:10.1007/978-3-8348- 2174-4 (Springer Fachmedien Wiesbaden, Wiesbaden, 2013)
2013 doi
-
[37]
Heizungsmarkt in Deutschland.https://de.statista.com/statistik/studie/id/ 25528/dokument/heizungsmarkt-in-deutschland/(2024) [Accessed on: 23 October 2025]
Statista. Heizungsmarkt in Deutschland.https://de.statista.com/statistik/studie/id/ 25528/dokument/heizungsmarkt-in-deutschland/(2024) [Accessed on: 23 October 2025]. 20
2024
Reviewed August 3, 2026 · model on record in the stance chip above.
Discussion (0). Continue with ORCID to comment.