A simple and powerful test of vaccine waning
Pith reviewed 2026-05-21 18:56 UTC · model grok-4.3
The pith
A new test rejects no-waning for the BNT162b2 COVID-19 vaccine by checking if each person's treatment effect stays constant over time.
A machine-rendered reading of the paper's core claim, the machinery that carries it, and where it could break.
Core claim
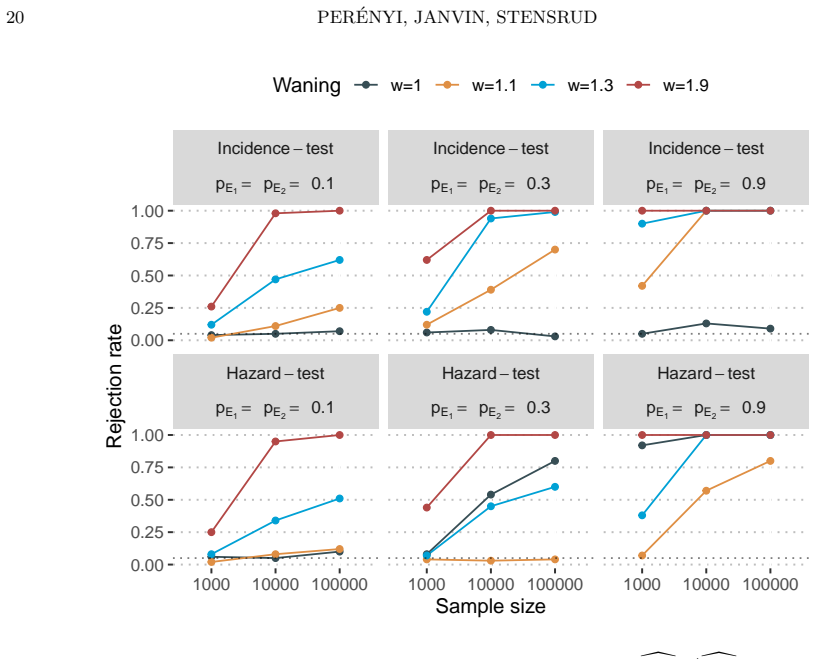
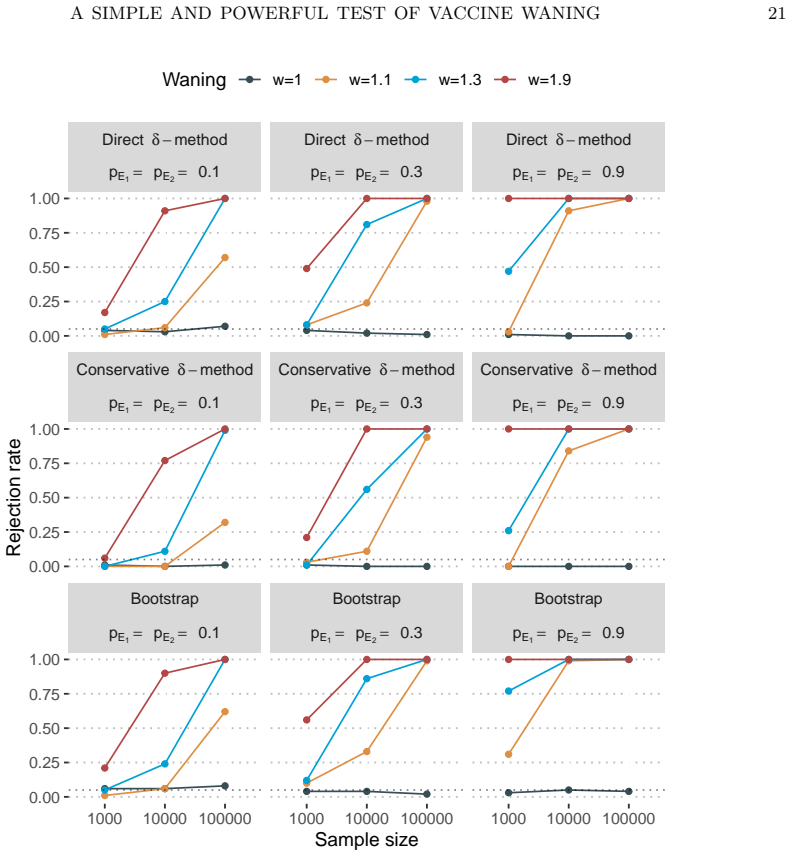
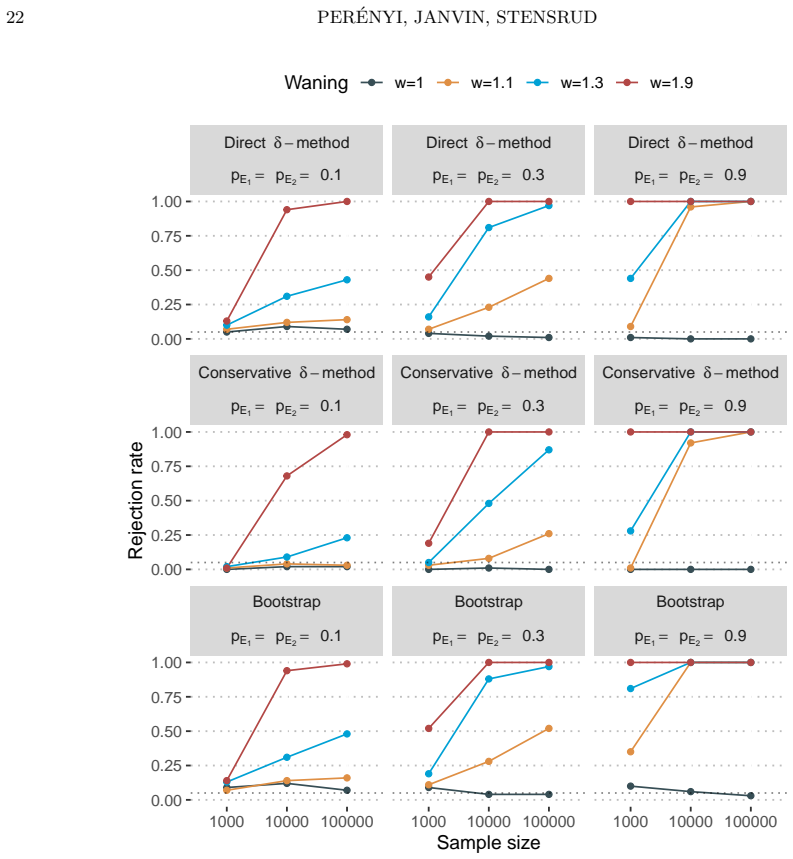
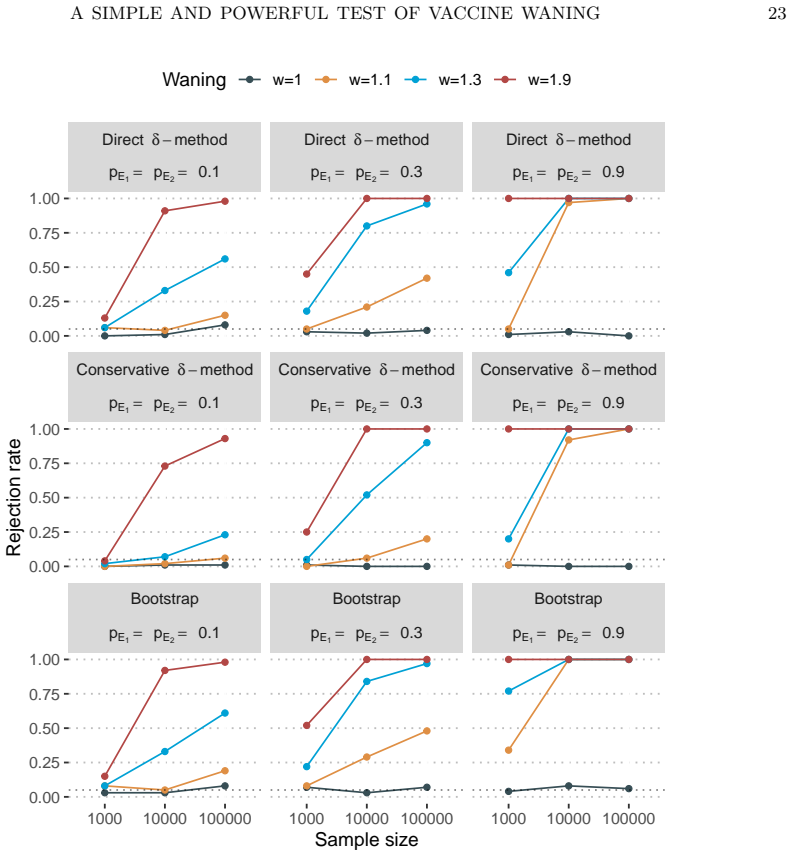
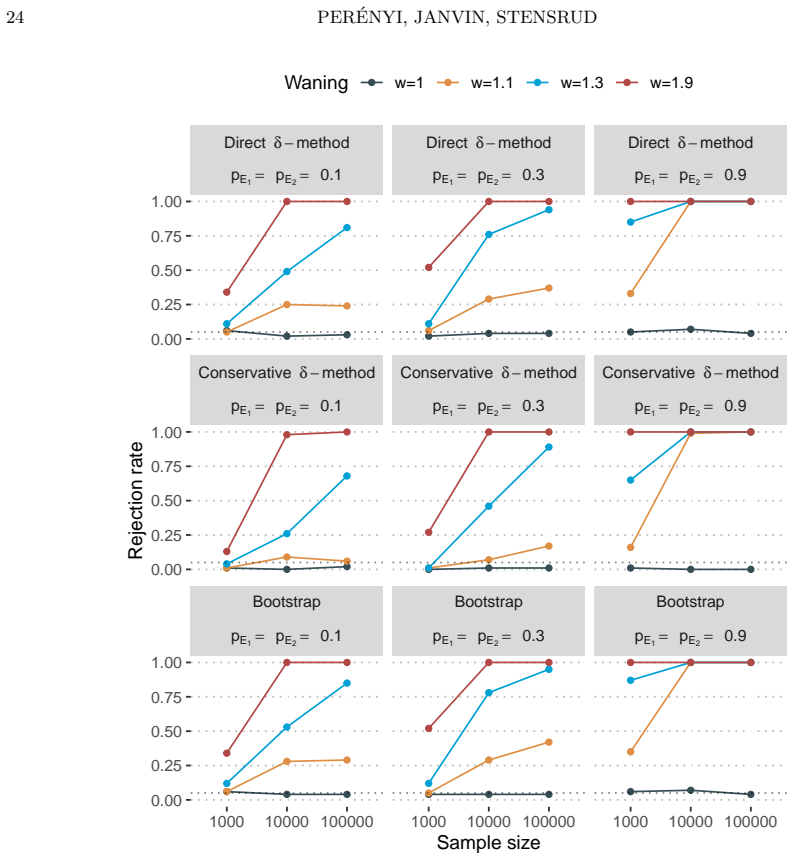
We propose a formal test to assess whether a treatment effect is constant over time at the individual level. This test provides a considerable power gain over existing approaches and is valid under interpretable assumptions in vaccine trials. We illustrate the increase in power through real and simulated examples using three different approaches to compute the test statistics, two of which rely solely on summary data. We also give new results that bound the waning effect. Reanalysis of the BNT162b2 COVID-19 vaccine trial rejects the null hypothesis of no waning.
What carries the argument
The test for whether the individual-level treatment effect remains constant over time, which can be computed from summary data available in trial reports.
Load-bearing premise
The test is valid under interpretable assumptions in vaccine trials that allow bounding or testing without unreasonable restrictions on how efficacy changes.
What would settle it
If the test is applied to individual-level data from the same BNT162b2 trial and the individual treatment effects turn out to be constant across time, the rejection of no waning would be overturned.
Figures
read the original abstract
Determining whether vaccine efficacy wanes is important for individual and public decision making. Yet, quantification of waning is a subtle task. The classical approaches cannot be interpreted as measures of declining efficacy unless we impose unreasonable assumptions. Recently, formal causal estimands designed to quantify vaccine waning have been proposed. These estimands can be bounded under weaker assumptions, but the bounds are often too wide to make claims about the presence of waning. We propose a different approach: a formal test to assess whether a treatment effect is constant over time at the individual level. This test provides a considerable power gain over existing approaches and is valid under interpretable assumptions in vaccine trials. We illustrate the increase in power through real and simulated examples, using three different approaches to compute the test statistics. Two of these approaches are based solely on summary data, accessible from existing clinical trials. Beyond our test, we also give new results that bound the waning effect. We use our methods to reanalyze data from a randomized controlled trial of the BNT162b2 COVID-19 vaccine. While prior analysis did not establish waning, our test rejects the null hypothesis of no waning.
Editorial analysis
A structured set of objections, weighed in public.
Referee Report
Summary. The manuscript proposes a formal test of the null that the individual-level treatment effect is constant over time, intended to detect vaccine waning. The test is claimed to be valid under interpretable assumptions common in vaccine trials and to offer a power gain over existing methods. Three implementations are given, two relying only on summary data from trials. The authors also derive new bounds on waning effects. Application to the BNT162b2 RCT data rejects the no-waning null, in contrast to prior analyses that did not establish waning.
Significance. If the validity claims hold, the work would provide a practically useful tool for re-analyzing existing vaccine trials with summary data only, while avoiding the strong assumptions required for classical waning measures. The reported rejection in the BNT162b2 example would constitute new evidence of waning. The additional bounding results are a secondary contribution.
major comments (2)
- [Section describing the three test-statistic approaches (summary-data variants)] The validity of the two summary-data test statistics for the individual-level constancy null is not fully established. Summary counts can be generated by heterogeneous individual trajectories or time-varying censoring even when the null holds at the person level; the manuscript must explicitly state and justify the additional restrictions (e.g., absence of frailty or proportional-hazards structure at the individual level) that rule out these alternatives. This issue is load-bearing for the central claim that the summary-data versions constitute valid tests.
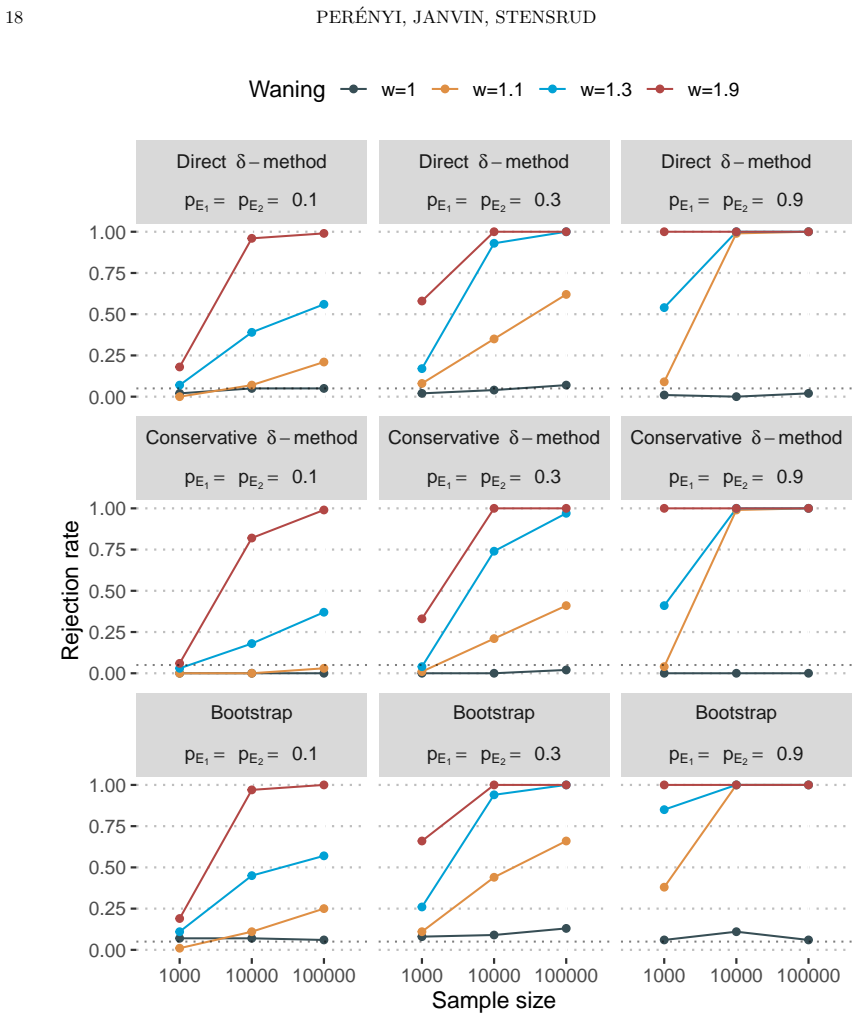
- [Simulation and real-data results sections] The power comparisons and real-data rejection rely on the test being correctly sized under the stated assumptions. A sensitivity analysis or explicit statement of how violations of the unstated homogeneity restrictions affect type-I error would be required before the rejection in the BNT162b2 reanalysis can be interpreted as evidence of individual-level waning.
minor comments (2)
- [Introduction and Methods] Notation for the formal estimands and test statistics could be introduced earlier and used consistently to improve readability.
- [Abstract] The abstract states that the test is 'valid under interpretable assumptions' but does not name them; a single sentence listing the key assumptions would help readers.
Simulated Author's Rebuttal
We thank the referee for their thoughtful and constructive comments on our manuscript. We have addressed each major comment below and revised the paper to improve clarity on assumptions and robustness.
read point-by-point responses
-
Referee: The validity of the two summary-data test statistics for the individual-level constancy null is not fully established. Summary counts can be generated by heterogeneous individual trajectories or time-varying censoring even when the null holds at the person level; the manuscript must explicitly state and justify the additional restrictions (e.g., absence of frailty or proportional-hazards structure at the individual level) that rule out these alternatives. This issue is load-bearing for the central claim that the summary-data versions constitute valid tests.
Authors: We appreciate this observation and agree that the assumptions for the summary-data implementations require explicit statement. In the revised manuscript, we have added a dedicated paragraph in the methods section on the three test-statistic approaches. There we list the additional restrictions needed for validity of the summary-data versions: no individual-level frailty inducing extra dependence across time periods, and censoring that is independent of treatment conditional on observed covariates. These are justified as reasonable in the setting of randomized vaccine trials with protocol-driven follow-up and balanced baseline characteristics. We maintain that these restrictions are interpretable and align with standard assumptions in the literature on vaccine efficacy, but we now make them fully transparent. revision: yes
-
Referee: The power comparisons and real-data rejection rely on the test being correctly sized under the stated assumptions. A sensitivity analysis or explicit statement of how violations of the unstated homogeneity restrictions affect type-I error would be required before the rejection in the BNT162b2 reanalysis can be interpreted as evidence of individual-level waning.
Authors: We agree that correct size under the assumptions is essential for interpreting the BNT162b2 results. Our theoretical derivations establish validity when the individual-level constancy null holds together with the stated trial assumptions. To address the concern, we have added an explicit discussion in the simulation and real-data sections noting that frailty or time-varying censoring could in principle affect type-I error. We have also included new supplementary simulations exploring mild violations of homogeneity and show that size remains approximately controlled for the magnitudes plausible in this trial. We therefore retain the interpretation of the rejection as evidence against no waning, while acknowledging that stronger violations would require further investigation. revision: partial
Circularity Check
No circularity: test derived from independent formal estimands
full rationale
The paper defines a new test for individual-level constancy of treatment effect using formal causal estimands for waning, with three computation approaches (two summary-data only). These are constructed from the trial design and stated assumptions rather than reducing by construction to fitted parameters or prior self-citations. The central rejection in the BNT162b2 reanalysis follows from the test statistic applied to the data under the null, without self-definitional loops or load-bearing self-citation chains that force the result. The derivation remains self-contained against external benchmarks.
Axiom & Free-Parameter Ledger
axioms (1)
- domain assumption Interpretable assumptions in vaccine trials allow testing for constant individual-level effects over time
Reference graph
Works this paper leans on
-
[1]
doi: 10.1007/s10654-025-01250-9
ISSN 0393-2990, 1573-7284. doi: 10.1007/s10654-025-01250-9. URL https://link.springer.com/10.1007/s10654-025-01250-9. Matias Janvin, , and Mats J. Stensrud. Quantification of Vaccine Waning as a Challenge Effect.Journal of the American Statistical Association, 0(0):1–11, December 2024. ISSN 0162-1459. doi: 10.1080/01621459.2024.2408776. David I. Bernstein...
-
[2]
= 0. Similarly, under the null P(∆Y a=1,e1=1 1 = 1,∆Y a=0,e1=0,e2=1 2 = 0) =P(∆Y a=0,e1=1 1 = 0,∆Y a=0,e1=0,e2=1 2 = 1) =P(∆Y a=0,e1=1 1 = 1,∆Y a=0,e1=0,e2=1 2 = 0) = 0, which implies that P(T= 9) =P(T= 10) =P(T= 13) =P(T= 14) = 0 P(T= 2) =P(T= 4) =P(T= 10) =P(T= 12) = 0 P(T= 5) =P(T= 7) =P(T= 13) =P(T= 15) = 0. Thus, we have thatP(T∈ {2,3,4,5,7,8,9,10,12...
-
[3]
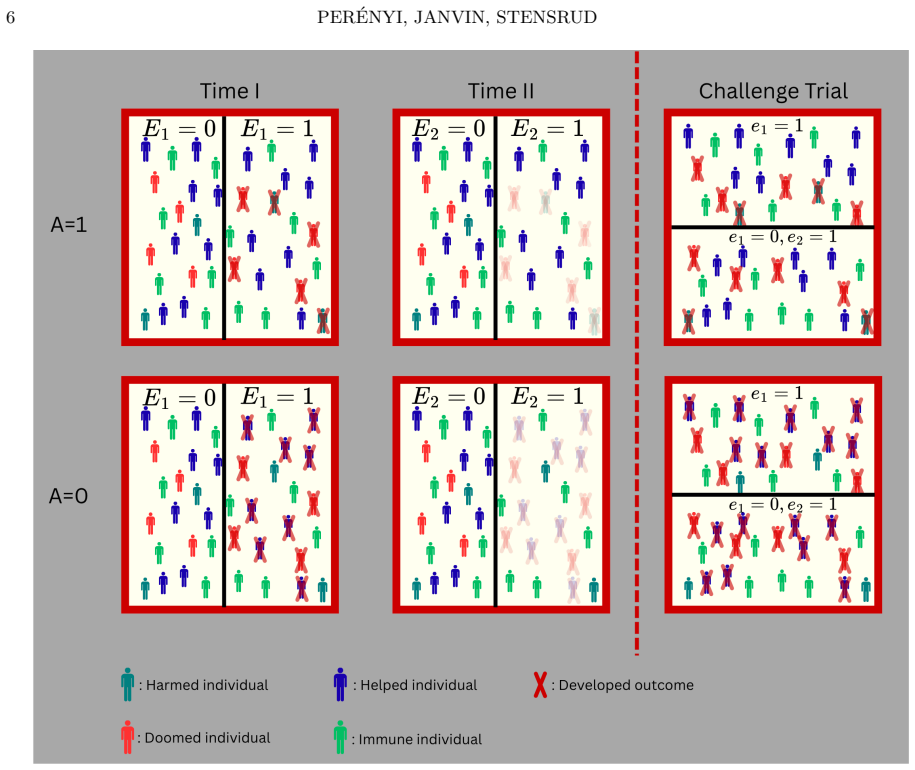
We believe this is a plausible assumption, as the effect of the placebo should not change over time for an individual if they are isolated; hence, their immune system is A SIMPLE AND POWERFUL TEST OF VACCINE WANING 15 not challenged before the exposure. Therefore, if they were to develop the outcome upon exposure at time 1, then they would develop it at t...
work page 1997
-
[4]
0 0 0 0N 0p0 1(1−p 0 1)−N 0p0 1p0 2 0 0−N 0p0 1p0 2 N0p0 2(1−p 0 2) Using the multivariateδ-method for someg(U 1, U2, U3, U4) = log(U1)−log(U 2)−log(U 3)+ log(U4) with the gradient∇g(U) = 1 U1 ,− 1 U2 ,− 1 U3 , 1 U4 ⊤ , we have that the variance of g(C) is equal to Var(g(C)) =∇g(U) ⊤ U=µΣ(C)∇g(U) U=µ = 1 N1p1 1 + 1 N1p2 1 + 1 N0p0 1 + 1 N0p0 1 , whi...
work page 2024
discussion (0)
Sign in with ORCID, Apple, or X to comment. Anyone can read and Pith papers without signing in.