REVIEW 3 major objections 5 minor 64 references
Quasar absorption outflows on galactic scales: Insights from DESI
T0 review · 3 major / 5 minor · reviewed 2026-08-07 · deepseek-v4-flash
Pith's one-line read DESI spectra show five quasar absorption outflows at kiloparsec distances from their nuclei, with the most energetic reaching about 0.47 percent of Eddington luminosity.
desk verdict Five new DESI-based outflow measurements, but the feedback headline is assigned to the wrong object in two sections and the SED systematic that sets the distance scale is never propagated. read the letter →
The pith
A machine-rendered reading of the paper's core claim, the machinery that carries it, and where it could break.
The reading
What carries the argument
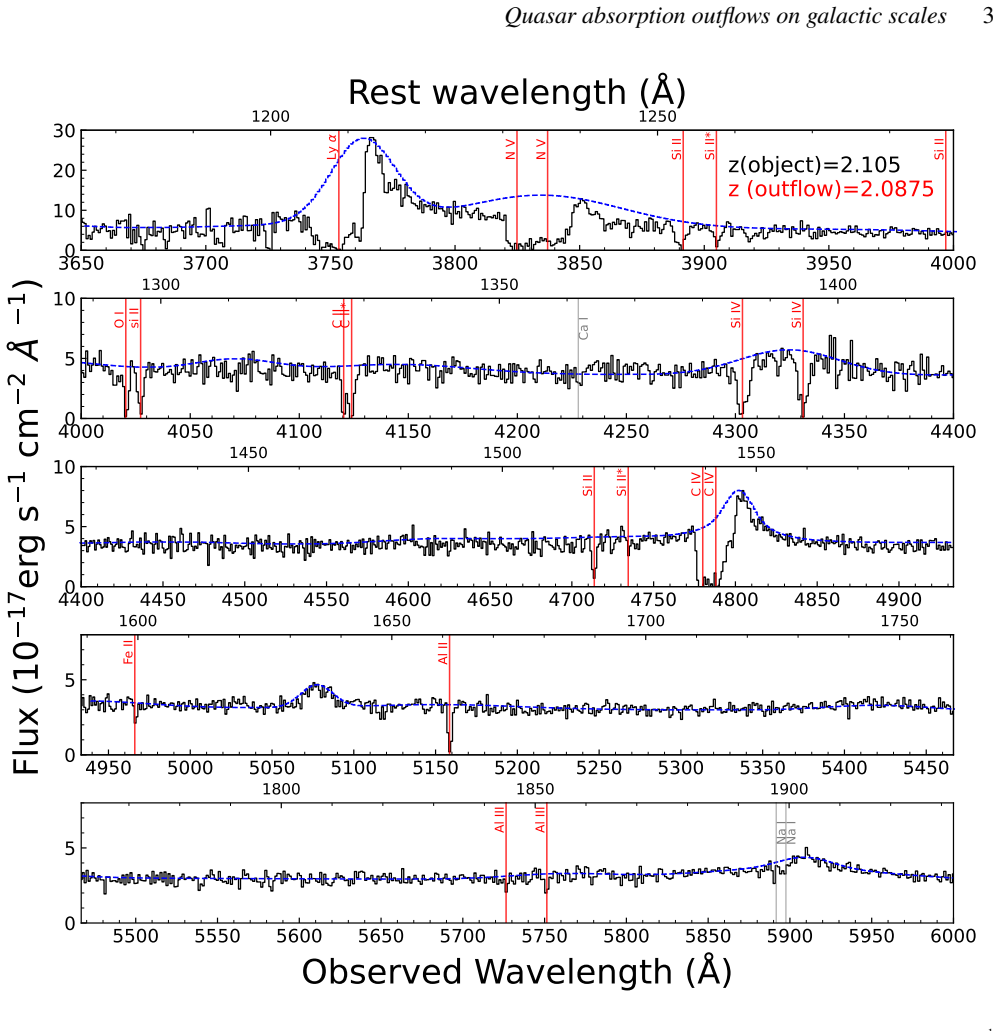
The load-bearing mechanism is the excited-to-resonance line ratio of Si II, combined with pairs of ions from the same element (Al II/Al III, C II/C II*) in a grid of photoionization models. The Si II* $\lambda1264.74$ to Si II $\lambda1260.42$ column ratio depends mainly on electron density rather than on column density or abundance, so atomic-data calculations convert it into $n_e$. The photoionization grid then fixes $N_H$ and $U_H$, and the geometric relation $R = (Q_H/(4\pi c n_H U_H))^{1/2}$ turns the SED-scaled ionizing photon rate $Q_H$ into a distance. Distance plus observed velocity and $N_H$ yields the mass-flow rate, momentum flux, and kinetic luminosity, which are compared with Eddington luminosity through a 0.5 percent threshold for feedback relevance. The five systems are mini-BALs, defined as outflow troughs 500 to 2000 km s$^{-1}$ wide, and their high measured $n_e$ together with their line widths argue for an AGN origin.
What would settle it
Measure the rest-frame 1250 to 1750 Å continuum and ionizing spectral energy distribution of J1407+5110 and the other three quasars, then redo the $Q_H$ scaling and the photoionization fits; if the true ionizing photon rate is lower by more than about 0.2 dex, J1407 S1's kinetic luminosity drops below the 0.5 percent Eddington feedback threshold.
Extended reading notes
Core claim
On its own terms, the paper establishes that each of the five absorption systems is a photoionized outflow powered by its quasar. Using the apparent optical depth and partial coverage methods on DESI Early Data Release spectra, the authors measure ionic columns of Al II, Al III, Si II, Si II*, C II, C II*, and Fe II. A grid of photoionization models finds $\log N_H = 20.0$ to $20.7$ cm$^{-2}$ and $\log U_H = -2.7$ to $-2.1$; the ratio of excited to ground Si II gives $\log n_e = 1.45$ to $2.85$ cm$^{-3}$. Scaling the UV-soft spectral energy distribution to the observed continuum gives the hydrogen-ionizing photon rate $Q_H$, and the relation $R = (Q_H/(4\pi c n_H U_H))^{1/2}$ yields distances of 4.5 to 31 kpc. From these the authors compute mass-flow rates of about 15 to 63 $M_\odot$ yr$^{-1}$ and kinetic luminosities from $1.8\times10^{-6}$ to $4.7\times10^{-3} L_{\rm Edd}$. The J1407 S1 system, with kinetic luminosity about 0.47 percent of Eddington (within errors of the 0.5 percent feedback threshold) and momentum flux ratio about 1.7, is the case the authors identify as plausibly contributing to feedback.
Load-bearing premise
The distances and Eddington ratios depend on assuming a particular unmeasured spectral shape, the UV-soft SED, and on scaling the ionizing photon rate to the observed continuum, so if the true spectrum is different, the kiloparsec distances and the 0.47 percent feedback claim for J1407 S1 could slide below the threshold.
Editorial extensions
If this is right
- DESI's moderate-resolution spectra can supply the ionic columns, densities, and distances needed to characterize low-ionization quasar outflows, extending this kind of measurement to very large samples.
- If the five systems are representative, kiloparsec-scale outflows with kinetic luminosities up to about 0.5 percent of Eddington exist in quasars at redshifts 2 to 3, tying AGN winds directly to galaxy-scale feedback.
- The measured electron densities, all above $\log n_e \approx 1.45$, separate these absorbers from circumgalactic and interstellar gas, supporting their identification as AGN outflows rather than unrelated intervening material.
- Outflows with much lower Eddington ratios, such as J1609 at about $1.8\times10^{-6}$, show that not every quasar outflow is feedback-efficient, so feedback models should allow a wide distribution of outflow powers.
Reading between the lines
- If the full DESI survey turns up ground-plus-excited Si II and C II troughs in even a small fraction of quasars, the handful of kiloparsec-scale outflows with measured energetics could grow into a statistical sample, letting feedback efficiency be mapped against quasar luminosity, redshift, and outflow velocity.
- The paper's own SED-sensitivity test implies an unquantified systematic error in the distances and Eddington ratios; measuring the true SEDs would be the direct way to decide whether J1407 S1 really crosses the feedback threshold.
- A high-resolution echelle spectrum of J1407 S1 could test the constant-density and partial-coverage assumptions directly, showing whether the derived $n_e$ and $R$ survive non-black saturation in the troughs.
- Because the mass-flow rate and kinetic luminosity scale linearly with the assumed global covering factor, the energetic results are only as secure as that geometric assumption; an independent estimate of the covering factor would tighten the feedback comparison.
Editorial analysis
A structured set of objections, weighed in public.
Referee Report
Summary. The paper analyzes five low-ionization mini-BAL outflow systems in four intermediate-redshift quasars (2<z<3) using DESI Early Data Release spectra. The authors measure ionic column densities via apparent optical depth and partial coverage methods, derive hydrogen column densities and ionization parameters with Cloudy photoionization modeling, and determine electron densities from Si II*/Si II ratios using the Chianti database. Combining these with a scaled UV-soft SED, they obtain outflow distances of 4.5-31 kpc, mass-flow rates, kinetic luminosities, and momentum flux ratios. The central claim is that these are kpc-scale quasar outflows, with J1407 S1 reaching Edot/LEdd ~ 0.47%, near the Hopkins & Elvis (2010) feedback threshold of 0.5%.
Significance. If the results hold, the paper demonstrates that DESI spectra can uncover kpc-scale quasar outflows and quantify their energetics, adding a small but useful sample to the still-limited census of resolved outflows at intermediate redshift. The measurement pipeline is standard and well-grounded in the quasar-outflow literature, and the paper explicitly discusses the SED and metallicity sensitivity of the photoionization results. However, the strongest conclusion---that one outflow significantly contributes to AGN feedback---is currently compromised by two issues: a clear misassignment of the 0.47% Edot/LEdd value to J0831 instead of J1407 S1 in the prose and conclusions, and an unquantified SED-induced systematic in the distance and energetics that sits exactly on the feedback threshold.
major comments (3)
- [Section 3.4 and Section 4(iii)] The claim that "the absorption outflow detected in J0831 with a ratio of 0.47 percent can significantly contribute to feedback processes" contradicts Table 3: J0831 has Edot/LEdd = 1.5e-3 (0.15%) and momentum ratio 0.37, while J1407 S1 has 4.7e-3 (0.47%) and momentum ratio 1.7. The conclusions repeat this misassignment, stating J0831 has a ratio of ~0.5% and momentum ratio of almost two, while Section 4(iv) simultaneously attributes feedback potential to J1407 S1. This internal inconsistency affects the central feedback claim and must be corrected throughout the text.
- [Section 3.6 vs Table 3] The centroid velocities listed in the object notes (J0831: -1700 km/s, J1032: -250 km/s, J1407 S1: -3200 km/s, J1407 S2: -300 km/s, J1609: -470 km/s) disagree with column (1) of Table 3 (J0831: -1100±280, J1032: -1000±400, J1407 S1: -3600±280, J1407 S2: -700±285, J1609: -230±290). Since the outflow velocity enters the kinetic luminosity quadratically in Eq. (9), the authors must reconcile these values and confirm which velocities were used to compute Edot.
- [Section 3.3 and Table 3] The SED-induced systematic is not propagated into the derived distances and energetics. Section 3.2.1 states that replacing the UV-soft SED with other common SEDs changes NH and UH by ~±0.2 dex, but Section 3.3 obtains QH by scaling the same UV-soft SED to the observed continuum, and Table 3 columns (5)-(9) quote only statistical errors. The resulting change in QH is not quantified, nor is the effect on R, Mdot, or Edot. For J1407 S1, Edot/LEdd = 4.7e-3 lies only 0.3e-3 above the 0.5% Hopkins & Elvis threshold, with a lower statistical bound of 3.0e-3; a ~0.2 dex shift in NH and UH plus an SED-dependent QH change can plausibly move the value below the threshold. The authors should either propagate the SED systematic into R and Edot or explicitly weaken the feedback conclusion.
minor comments (5)
- [Section 3.5] The text states that the measured electron densities are "log(ne) > 1.5 [cm^-3]", but Table 3 lists log(ne) = 1.45 for J1407 S2; please rephrase to "log(ne) ≥ 1.45" or otherwise adjust for consistency.
- [Figure 4 caption] The caption says "six outflow systems detected in our five quasars", but the paper presents five outflows in four quasars; please correct.
- [Section 3.6.1] The term "FeloBAL" appears to be a typo for "FeLoBAL" (Fe low-ionization broad absorption line).
- [Table 3 note] The table note says columns (5)-(9) do not include "the systemic velocity errors (given in column (1))", but column (1) lists centroid velocities, not the redshift uncertainties that are given in Table 1; please clarify which systematic is being excluded.
- [Section 3.4] The sentence "Note that since we use the corrected formulas that consider the Civ blue-shift, the large SED-dependent systematic error in BH masses is removed" is unclear because the SED sensitivity of QH is not addressed in that context; consider adding a reference or brief explanation.
Circularity Check
No significant circularity; the kpc-scale distances and energetics follow from independent diagnostics and do not reduce to the conclusions.
full rationale
The derivation chain is self-contained. Ionic column densities N_ion are measured from DESI spectra via AOD/PC methods (Section 3.1). Cloudy photoionization grids fitted to Al II/Al III and other ions yield N_H and U_H independently of any distance assumption (Section 3.2). Electron densities n_e come from Si II*/Si II ratios through Chianti, an independent atomic database (Section 3.3). Q_H is obtained by scaling the adopted UV-soft SED to the observed continuum flux, and Eq. (6), R = sqrt(Q_H/(4 pi c n_H U_H)), then gives the distance; this is not an input tautology because U_H is determined by the ionization balance rather than by R. Equations (7)-(9) for mass-flow rate, momentum flux, and kinetic luminosity follow from R, N_H, and v. The self-citations (Dehghanian et al. 2024a, 2025a,b; Byun et al. 2022a,b; Walker et al. 2022) are methodological or sensitivity references; none supplies the central distance or energetics values. The paper explicitly states the SED and metallicity sensitivity in Section 3.2.1 and in the Table 3 note, and it does not propagate those systematics into columns (5)-(9); that is a robustness caveat, not circularity. There is also an internal inconsistency about whether J0831 or J1407 S1 is the 0.47% L_Edd system (Section 3.4 versus the conclusions), but that is a correctness issue, not a circular-reasoning issue.
Assumptions & free parameters
free parameters (4)
- Ionization parameter log(U_H) per outflow =
J0831: -2.7; J1032: -2.1; J1407 S1: -2.6; J1407 S2: -2.7; J1609: -2.1
- Total hydrogen column density log(N_H) per outflow =
J0831: 20.1; J1032: 20.5; J1407 S1: 20.0; J1407 S2: 20.0; J1609: 20.7
- Electron density log(n_e) per outflow =
J0831: 2.35; J1032: 2.5; J1407 S1: 2.85; J1407 S2: 1.45; J1609: 2.35
- Global covering factor Omega =
0.2 (assumed)
assumptions (8)
- domain assumption The UV-soft SED (Dunn et al. 2010; Arav et al. 2013) describes the ionizing continuum of the quasars
- domain assumption Solar metallicity in the outflowing gas
- domain assumption Constant hydrogen density across the kinematic profile of the outflow
- domain assumption n_e = 1.2 n_H for the highly ionized plasma
- domain assumption Covering factor Omega = 0.2
- domain assumption The five absorbers are outflowing gas from the quasar, not intervening systems
- domain assumption The Wu & Shen (2023) systemic redshifts are correct
- domain assumption Q_H and bolometric luminosity are obtained by scaling the UV-soft SED to the observed continuum flux at 4500-5500 Angstrom
Cite this review
Pith. "Pith review of Quasar absorption outflows on galactic scales: Insights from DESI." pith.science (2026). https://pith.science/paper/JDJFDW5A
@misc{pith2026250521630,
  author       = {Pith},
  title        = {Pith review of: Quasar absorption outflows on galactic scales: Insights from DESI},
  year         = {2026},
  howpublished = {\url{https://pith.science/paper/JDJFDW5A}},
  note         = {Machine review of arXiv:2505.21630}
}
abstract
Absorption outflows in quasars play an important role in understanding active galactic nuclei (AGN) feedback and their influence on galaxy evolution. The unprecedented spectral data provided by the Dark Energy Spectroscopic Instrument (DESI) opens new avenues to explore these outflows. We analyze five low-ionization absorption outflow systems in four intermediate-redshift quasars ($2 < z < 3$) using the data obtained by DESI in order to characterize their physical properties and energetics, and also to assess their role in AGN feedback. We use the spectra from DESI's Early Data Release to determine the ionic column densities, total hydrogen column densities, electron number densities, and ionization parameters via photoionization modeling and absorption line analysis. We derive the outflows' distance from the AGN, and its kinematic properties: mass-flow rates, kinetic luminosity, and momentum flux. Our study identifies five distinct mini-broad absorption line outflow systems, hosted by four quasars. The identified outflows exhibit hydrogen column densities of $\log (N_H) = 20.0-20.7$[cm$^{-2}$], ionization parameters of $\log (U_H) = -2.7$ to $-2.1$, and electron number densities of $\log (n_e) =1.45-2.85$[cm$^{-2}$]. The distances of the outflows from the central source are between 4.5 to 31 kpc, and the kinetic luminosities range from $2\times10^{-6}$ to $5\times10^{-3}$ of the Eddington luminosity. The outflows in J1407 and J1032 show the largest kinetic luminosities, with momentum flux ratios ($\dot{p} / \dot{p}_{rad}$) of about 2 and 0.2, respectively. Our findings highlight the vital role of DESI data in uncovering the diversity and significance of quasar outflows in galaxy evolution.
Figures


Figures from the paper (2 more)


Reference graph
Works this paper leans on
- [1]
- [7]
-
[13]
Partial Coverage and Time Variability of Narrow-Line Intrinsic QSO Absorption Systems
doi:10.48550/arXiv.astro-ph/9705048 Ballero S. K., Matteucci F., Ciotti L., Calura F., Padovani P., 2008, A&A, 478,
work page Pith review arXiv doi:10.48550/arxiv.astro-ph/9705048 2008
-
[22]
doi:10.3847/1538-4365/ab05cf DESI Collaboration, Adame, A. G., Aguilar, J., et al. 2024, AJ, 168,
-
[23]
F., Elvis M., 2010, MNRAS, 401,
doi:10.1063/1.1433974 Hopkins P. F., Elvis M., 2010, MNRAS, 401,
-
[27]
doi:10.1086/307073 AravN.,BeckerR.H.,Laurent-MuehleisenS.A.,GreggM.D.,WhiteR.L., BrothertonM.S.,deKoolM.,1999b,ApJ,524,566.doi:10.1086/307841 AravN.,BrothertonM.S.,BeckerR.H.,GreggM.D.,WhiteR.L.,PriceT., Hack W., 2001, ApJ, 546,
doi:10.1086/307073 2001
-
[39]
doi:10.3847/1538-4365/ab5967 Misawa, T., Charlton, J. C., Eracleous, M., et al. 2007a, ApJS, 171,
-
[47]
C., Ganguly R., Tytler D., Kirkman D., Suzuki N., et al., 2007b, ASPC, 373,
doi:10.1086/513713 Misawa T., Eracleous M., Charlton J. C., Ganguly R., Tytler D., Kirkman D., Suzuki N., et al., 2007b, ASPC, 373,
Show all 64 references
-
[49]
doi:10.1088/0004-637X/762/1/49 Bowler, R. A. A., Hewett, P. C., Allen, J. T., et al. 2014, MNRAS, Line-driven radiative outflows in luminous quasars, 445, 1,
2014 doi
-
[51]
R., Hall, P
doi:10.1146/annurev- astro-082812-140951 Spitzer L., 1968, dms..book Trump, J. R., Hall, P. B., Reichard, T. A., et al. 2006, ApJS, 165,
1968 doi
-
[54]
doi:10.1086/343107 DunnJ.P.,BautistaM.,AravN.,MoeM.,KoristaK.,CostantiniE.,BennC., et al., 2010, ApJ, 709,
2010 doi
-
[57]
E., et al., 2021, ApJ, 919,
doi:10.1086/503834 VaynerA.,WrightS.A.,MurrayN.,ArmusL.,BoehleA.,CosensM.,Larkin J. E., et al., 2021, ApJ, 919,
2021 doi
-
[58]
T., Arav N., 2002, ApJ, 580,
doi:10.3847/1538-3881/ad3217 de Kool M., Korista K. T., Arav N., 2002, ApJ, 580,
2002 doi
-
[59]
doi:10.3847/1538-4357/ac2b9e Vestergaard M., 2003, ApJ, 599,
2003 doi
-
[62]
2024, submitted to ApJ Sharma, M., Arav, N., Korista, K
doi:10.1086/386542 Sharma M., Arav N., Zhao Q.,Dehghanian M., et al. 2024, submitted to ApJ Sharma, M., Arav, N., Korista, K. T., et al. 2025, A&A, 693, A254. doi:10.1051/0004-6361/202452735 Silk J., Rees M. J., 1998, A&A, 331, L1. doi:10.48550/arXiv.astro- ph/9801013 Somervil...
2024
-
[64]
doi:10.1086/170020 Wu Q., Shen Y., 2023, RNAAS, 7,
2023 doi
-
[69]
doi:10.1088/0004-637X/758/1/69 Borguet, B. C. J., Arav, N., Edmonds, D., et al. 2013, ApJ, 762, 1,
2013 doi
-
[74]
W., Schneider, D
doi:10.3847/1538-4357/ac61d9 Churchill, C. W., Schneider, D. P., Schmidt, M., et al. 1999, AJ, 117,
1999 doi
-
[90]
doi:10.1109/MCSE.2007.55 Itoh D., Misawa T., Horiuchi T., Aoki K., 2020, MNRAS, 499,
2007 doi
-
[99]
E., Ferland G
doi:10.3847/1538-3881/ace62c Osterbrock D. E., Ferland G. J., 2006, agna.book Prochaska J. X., Werk J. K., Worseck G., Tripp T. M., Tumlinson J., Burchett J. N., Fox A. J., et al., 2017, ApJ, 837,
2006 doi
-
[100]
B., 2022b, MNRAS, 517,
doi:10.1093/mnras/stac2194 Byun D., Arav N., Hall P. B., 2022b, MNRAS, 517,
- [102]
-
[105]
C., Guo F., 2018, ApJ, 857,
doi:10.3847/1538- 4357/ab164e Yuan F., Yoon D., Li Y.-P., Gan Z.-M., Ho L. C., Guo F., 2018, ApJ, 857,
2018 doi
-
[108]
doi:10.1086/592140 Krolik, J. H. 1999, Active galactic nuclei: from the central black hole to the galactic environment, Vol. 59 (Princeton University Press) Mathews W. G., Ferland G. J., 1987, ApJ, 323,
1999 doi
-
[115]
doi:10.1146/annurev-astro- 082214-122316 Korista,K.T.,Bautista,M.A.,Arav,N.,etal.2008,ApJ,PhysicalConditions in Quasar Outflows: Very Large Telescope Observations of QSO 2359- 1241, 688, 1,
2008 doi
- [116]
-
[121]
MNRAS000, 1–9 (2025)
doi:10.3847/1538-4357/aab8f8 This paper has been typeset from a TEX/LATEX file prepared by the author. MNRAS000, 1–9 (2025)
2025 doi
-
[122]
A., et al
doi:10.3847/1538-4357/ac0f56 Vayner, A., Zakamska, N., Wright, S. A., et al. 2021, ApJ, 923,
2021 doi
-
[123]
A., Hamann F., Sargent W
doi:10.3847/1538-3881/aabc4f Barlow T. A., Hamann F., Sargent W. L. W., 1997, ASPC, 128,
1997 doi
-
[133]
2019, MNRAS, 483,
doi:10.1093/mnras/stt1231 Hamann, F., Herbst, H., Paris, I., et al. 2019, MNRAS, 483,
2019 doi
-
[140]
doi:10.1086/318244 AravN.,KaastraJ.,KrissG.A.,KoristaK.T.,GabelJ.,ProgaD.,2005,ApJ, 620,
2005 doi
-
[141]
2025a, A&A, 693, A153
doi:10.3847/1538-4357/ad5ff4 Dehghanian, M., Arav, N., Sharma, M., et al. 2025a, A&A, 693, A153. doi:10.1051/0004-6361/202452115 Dehghanian, M., Arav, N., Sharma, M., et al. 2025b, A&A, 695, A4. doi:10.1051/0004-6361/202453384 Dere K. P., Landi E., Mason H. E., Monsignori Foss...
-
[149]
P., Del Zanna G., Young P
doi:10.1051/aas:1997368 Dere K. P., Del Zanna G., Young P. R., Landi E., Sutherland R. S., 2019, ApJS, 241,
2019 doi
-
[161]
& Sabra, B
doi:10.1023/A:1005161325181 Hamann, F. & Sabra, B. 2004, AGN Physics with the Sloan Digital Sky Survey, 311,
2004 doi
-
[167]
D., Sembach K
doi:10.1088/0004- 6256/141/5/167 Savage B. D., Sembach K. R., 1991, ApJ, 379,
1991 doi
-
[178]
R., Kraemer, S
doi:10.1086/345096 Gabel, J. R., Kraemer, S. B., Crenshaw, D. M., et al. 2005, ApJ, 631, 2,
2005 doi
-
[190]
2019, ApJ, 876,
doi:10.3847/2515-5172/acf580 Xu, X., Arav, N., Miller, T., et al. 2019, ApJ, 876,
2019 doi
- [203]
-
[207]
T., Kruczek N
doi:10.1086/589230 Richards G. T., Kruczek N. E., Gallagher S. C., Hall P. B., Hewett P. C., Leighly K. M., Deo R. P., et al., 2011, AJ, 141,
2011 doi
- [245]
-
[246]
& Brotherton, M
doi:10.3847/2515- 5172/ad0e75 Ganguly, R. & Brotherton, M. S. 2008, ApJ, 672,
2008 doi
-
[261]
doi:10.1038/s41592- 019-0686-2 Walker A., Arav N., Byun D., 2022, MNRAS, 516,
2022 doi
-
[291]
S., Eracleous M., Charlton J
doi:10.48550/arXiv.astro- ph/0612028 Misawa T., Kawabata K. S., Eracleous M., Charlton J. C., Kashikawa N., 2010, ApJ, 719,
2010 doi
-
[335]
doi:10.1051/0004-6361:20078663 BorguetB.C.J.,EdmondsD.,AravN.,BennC.,ChamberlainC.,2012,ApJ, 758,
2012 doi
-
[339]
C., Banerji, M., et al
doi:10.1038/s41550-021-01561-3 Coatman, L., Hewett, P. C., Banerji, M., et al. 2016, MNRAS, 461,
2016 doi
-
[359]
doi:10.1093/mnras/stu1730 Byun D., Arav N., Walker A., 2022a, MNRAS, 516,
-
[456]
R., Arav N., Xu X., Kriss G
doi:10.1086/165843 Miller T. R., Arav N., Xu X., Kriss G. A., Plesha R. J., 2020, ApJS, 247,
2020 doi
-
[611]
2024, MNRAS, 532,
doi:10.1088/0004-637X/709/2/611 Filbert, S., Martini, P., Seebaluck, K., et al. 2024, MNRAS, 532,
2024 doi
-
[647]
C., Banerji M., Richards G
doi:10.1093/mnras/stw1360 Coatman L., Hewett P. C., Banerji M., Richards G. T., Hennawi J. F., ProchaskaJ.X.,2017,MNRAS,465,2120.doi:10.1093/mnras/stw2797 Dai,X.,Shankar,F.,&Sivakoff,G.R.2012,ApJ,757,180.doi:10.1088/0004- 637X/757/2/180 Davidson, K., & Netzer, H. 1979, Reviews...
2017 doi
-
[665]
doi:10.1086/425560 Arav N., Borguet B., Chamberlain C., Edmonds D., Danforth C., 2013, MN- RAS, 436,
2013 doi
-
[689]
E., Haberland M., Reddy T., Courna- peau D., Burovski E., et al., 2020, NatMe, 17,
doi:10.1086/500572 Virtanen P., Gommers R., Oliphant T. E., Haberland M., Reddy T., Courna- peau D., Burovski E., et al., 2020, NatMe, 17,
2020 doi
-
[741]
R., Jiang, L., Brandt, W
doi:10.1086/432682 Gibson, R. R., Jiang, L., Brandt, W. N., et al. 2009, ApJ, 692,
2009 doi
-
[758]
M., van Hoof, P
doi:10.1088/0004-637X/692/1/758 Gunasekera, C. M., van Hoof, P. A. M., Chatzikos, M., et al. 2023, Research Notes of the American Astronomical Society, 7,
2023 doi
-
[860]
T., de Kool M., Junkkarinen V
doi:10.1111/j.1365-2966.2010.17489.x Arav N., Korista K. T., de Kool M., Junkkarinen V. T., Begelman M. C., 1999a, ApJ, 516,
2010
- [1048]
-
[1784]
doi:10.1086/368392 Holweger H., 2001, AIPC, 598,
2001 doi
-
[1808]
2022, Science Advances, 8, eabk3291 Hewett, P
doi:10.1093/mnras/sty2900 HarrisC.R.,MillmanK.J.,vanderWaltS.J.,GommersR.,VirtanenP.,Cour- napeauD.,WieserE.,etal.,2020,Natur,585,357.doi:10.1038/s41586- 020-2649-2 He Z., Liu G., Wang T., et al. 2022, Science Advances, 8, eabk3291 Hewett, P. C. & Foltz, C. B. 2003, AJ, 125,
2020 doi
-
[1890]
D., et al
doi:10.1088/0004-637X/719/2/1890 Napolitano, L., Pandey, A., Myers, A. D., et al. 2023, AJ, 166,
2023 doi
-
[2573]
C., Gu Q., Wang T., Zhuang M., Liu G., et al., 2022, NatAs, 6,
doi:10.1086/300884 Chen Z., He Z., Ho L. C., Gu Q., Wang T., Zhuang M., Liu G., et al., 2022, NatAs, 6,
2022 doi
- [3094]
-
[3286]
2018, ApJ,857, 60 Astropy Collaboration, Robitaille T
doi:10.1093/mnras/stt1812 Arav, N., Liu, G., Xu, X., et al. 2018, ApJ,857, 60 Astropy Collaboration, Robitaille T. P., Tollerud E. J., Greenfield P., Droettboom M., Bray E., Aldcroft T., et al., 2013, A&A, 558, A33. doi:10.1051/0004-6361/201322068 Astropy Collaboration, Price-...
2018 doi
-
[3669]
R., Crenshaw D
doi:10.1093/mnras/stae1610 Gabel J. R., Crenshaw D. M., Kraemer S. B., Brandt W. N., George I. M., Hamann F. W., Kaiser M. E., et al., 2003, ApJ, 583,
2003 doi
-
[3778]
J., Morris S
doi:10.1093/mnras/stac2349 Weymann R. J., Morris S. L., Foltz C. B., Hewett P. C., 1991, ApJ, 373,
1991 doi
-
[7825]
A., et al
doi:10.1093/mnras/stad3695 Dehghanian, M., Arav, N., Kriss, G. A., et al. 2024b, ApJ, 972,
Reviewed August 7, 2026 · model on record in the stance chip above.
Discussion (0). Sign in to comment.