REVIEW 4 major objections 6 minor 17 references
General Equilibrium Effects of Carbon Offsets
T0 review · 4 major / 6 minor · reviewed 2026-08-03 · deepseek-v4-flash
Pith's one-line read Raising the price of carbon offsets can raise total emissions, not just fail to cut them, because economy-wide price responses can overwhelm the direct renewable-energy gain.
desk verdict The question is timely and the qualitative story probably survives, but the printed closed-form solutions contain a genuine algebra error that needs fixing before this is citable. read the letter →
The pith
A machine-rendered reading of the paper's core claim, the machinery that carries it, and where it could break.
The reading
What carries the argument
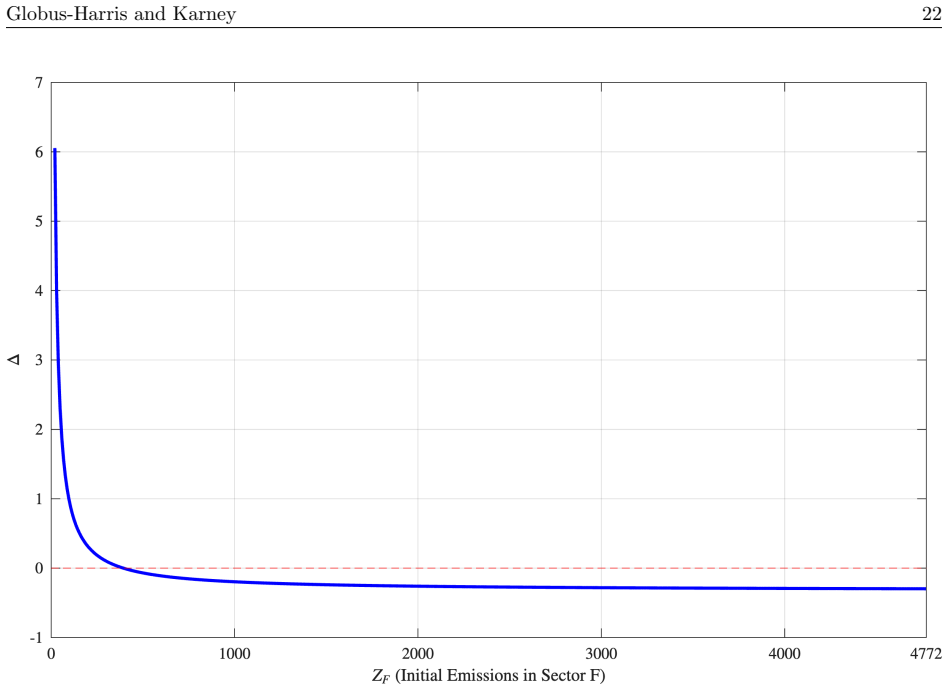
The engine is a log-linearized general equilibrium model with a fixed factor in renewable production, so renewables face diminishing returns and capital is drawn from the final goods and fossil sectors. Two carbon accounting metrics are compared through the ratio Δ = (Ω_A − Ω_C)/Ω_C: Ω_C credits only the direct emissions avoided by additional renewables, while Ω_A is the actual change in total emissions from fossil fuel and final-good production. The paper also introduces a four-way taxonomy of offsets — inframarginal non-additional, extensive-margin additional, and two intensive margins — where the fourth, dR_N, captures output response from projects that would have existed without the offs
What would settle it
Compare actual aggregate emissions changes from grid-level data with conventionally credited offsets for a large offset program that includes projects previously judged non-additional. If the Type 4 margin is real, plant-level output of non-additional wind or solar projects should rise with offset price increases, producing a measurable output response that conventional accounting ignores; if no such response exists, the under-crediting channel collapses. A second test is to estimate σ_E, the substitutability of renewable and fossil electricity, and check whether the sign of Δ tracks the model
Extended reading notes
Core claim
The central claim is that in a fully specified general equilibrium, the offset price is not a reliable lever for emissions reductions. The paper builds a three-sector economy (final good, renewable energy with a fixed factor, fossil energy) and shows in closed form that a higher offset price always raises renewable output and always lowers final-good consumption, but fossil output and aggregate emissions are ambiguous. It then defines conventional carbon accounting (direct emissions credited to additional renewables) and aggregate accounting (total economy-wide emissions change) and shows the ratio between them can be negative (over-crediting), positive (under-crediting), or less than -1 (ba
Load-bearing premise
The analytical results for the accounting comparison and the new intensive-margin channel assume the additional and non-additional renewable sub-sectors have identical cost functions, so both expand in the same proportion when the offset price changes; if non-additional projects are instead locked in by contracts or face different fixed-resource intensities, that equal-proportional-change result — and with it the under-crediting conclusion — can fail or reverse.
Editorial extensions
If this is right
- If the offset price rises, renewable output rises but final consumption falls in every parameterization; there is no free lunch from offsets.
- Aggregate emissions can rise even when all initial offsets are additional by traditional project-level tests, so project-level additionality screening cannot rule out backfire.
- Conventional carbon accounting over-credits offsets under many parameter values, sometimes crediting reductions where total emissions actually increase.
- Under-crediting also occurs: when initially non-additional projects expand output in response to the price change, the conventional metric misses real reductions; this can happen even when all initial offsets are non-additional.
- Welfare cannot be read off either accounting metric; the relevant comparison is the consumption cost (always negative) against the monetized emissions change, and the marginal value of public funds is the better welfare proxy.
Reading between the lines
- If the model's logic carries to real offset markets, crediting rules that ignore market spillovers are systematically biased in a direction that depends on local substitution elasticities: over-crediting where renewables and fossil fuels are poor substitutes, under-crediting where they are close substitutes.
- The Type 4 margin predicts a specific empirical signature: plants built without offset incentives should increase output when offset prices rise, visible in plant-level operational data even for projects deemed non-additional.
- A testable extension would compare Δ across geographies or sectors with different σ_E: high renewable penetration with low substitutability should show more over-crediting or backfire, while low-penetration, high-substitutability settings should approach conventional accounting.
- The model's logic applies beyond formal carbon offsets to output-based green subsidies such as production tax credits, which carry the same general equilibrium bias.
Signed reviews
Editorial analysis
A structured set of objections, weighed in public.
Referee Report
Summary. The paper constructs an analytical general-equilibrium model with a final good, a CES energy aggregate, a fixed-factor renewable sector, a fossil sector, and a balanced-budget offset subsidy, then derives closed-form comparative statics for an increase in the offset price. It introduces a taxonomy of four offset adjustment margins, defines conventional and aggregate carbon-accounting metrics, and derives welfare and MVPF formulas. The central claims are that the emissions and welfare responses are ambiguous; that conventional accounting generally over-credits offsets but can also under-credit them, including through a newly identified intensive-margin response of initially non-additional projects; and that under some parameters offsets backfire and increase aggregate emissions. The claims are supported by analytical propositions and by parameterized numerical tables for a U.S.-calibrated economy and a CCS case study.
Significance. If the derivation were correct, the paper would make a useful contribution: it provides a tractable general-equilibrium framework for offset policies, gives closed-form expressions, ranks four offset margins, and provides transparent parameter-grid numerics rather than fitting the conclusion. The distinction between conventional and aggregate accounting, the welfare non-sufficiency result, and the Type 4 intensive-margin channel are potentially valuable for the carbon-offset policy debate. However, the paper's quantitative and proposition-level results currently rest on an algebraically inconsistent closed-form denominator, so the significance can only be realized after a corrected derivation and re-run of the numerics.
major comments (4)
- [§5, Eqs. (24), (25), (27), (29)] The printed definition of C in Eq. (24), C = α_X θ_ER σ_X + (α_F + α_X θ_ER) σ_E, does not match an independent solution of the stated log-linear system (1)–(14). Re-solving the system gives the denominator θ_RQ/σ_R + AB/N with N = (α_X θ_EF + α_F)σ_E + α_X θ_ER σ_X (equivalently, since θ_EF + θ_ER = 1, the σ_E coefficient should be α_X θ_EF + α_F, not α_F + α_X θ_ER). The two expressions differ by α_X(1 − 2θ_ER)σ_E and coincide only if θ_ER = 1/2 or σ_E = 0. This error propagates into Eqs. (25), (27), and (29), and hence into Propositions 1–3 and every numerical row in Tables 1–4. The qualitative ambiguity may survive a corrected derivation, but the reported elasticities, backfire thresholds, Δ values, and welfare numbers are not currently supported. The referenced Online Appendix, which would let the reader check the algebra, is not included in the manuscript.
- [§6 and Table 1 notes] The calibration is internally inconsistent. The text states K_X = 0.92, K_F = 0.05, K_R = 0.01 and K̄ = 0.99, which with α_i = K_i/K̄ implies α_R ≈ 0.010, α_F ≈ 0.051, α_X ≈ 0.929. But Table 1 reports α_R = 0.020, α_F = 0.051, α_X = 0.929. The renewable capital share used in the numerics is thus not the share stated in the text; this affects R̂, F̂, Ẑ and all downstream columns. The authors should state the exact parameter vector used to produce each table and reconcile the text and table notes.
- [§3.1 and Appendix B] The Type 4 under-crediting result — the new intensive-margin response of initially non-additional offsets — relies critically on the assumption that the additional and non-additional renewable sub-sectors have identical cost functions, so that R̂_A = R̂_N. Appendix B itself acknowledges that unequal fixed-resource intensities make R̂_A ≠ R̂_N and can make the equal-proportion result fail. Since the Type 4 margin is a headline contribution, the paper should either prove a condition under which dR_N has the claimed sign when cost shares differ, or explicitly qualify the under-crediting claim as limited to that special case. As written, a central qualitative claim rests on an assumption the appendix shows is not robust.
- [§5 and §4.3] Several load-bearing derivations are relegated to a missing Online Appendix: the solution of the log-linear system in Eq. (24), the comparative-static proofs in Section 5, and the two-part instrument proofs in Section 4.3. Given that Eq. (24) contains an algebraic error, reliance on an unavailable appendix is not merely a presentation issue. The authors should include the full derivations in the main text or a public appendix so the results can be verified.
minor comments (6)
- [§6 and Table 1] The text says the offset price is increased by 10 percent and tables state ŝ = 10, but in the log-linear notation of Section 2, a 10 percent increase is ŝ = 0.10. Please clarify the percentage convention used in the tables.
- [§4.2, Eq. (23)] The elasticity ε is used in Eq. (23) before it is defined in Eq. (24). Define ε immediately before the MVPF expression.
- [§6, first paragraph] The stated capital values do not add up: K_X + K_F + K_R = 0.92 + 0.05 + 0.01 = 0.98, not 0.99. Please correct the reported totals and clarify the relationship between K̄ and Q̄.
- [§3.2, Eq. (15)] The text says 'conditional carbon accounting' where it should say 'conventional carbon accounting.'
- [Table 2 notes] 'For all row' should be 'For all rows.'
- [§6.2] The abbreviation 'CSS-enabled EGUs' should be 'CCS-enabled EGUs.'
Circularity Check
No circularity found; results are derived from the stated general-equilibrium system, with self-citations only illustrative.
full rationale
Walking the derivation chain, the paper's substantive results are not circular. Equations (1)-(14) define a log-linear GE system; Equation (24) and the subsequent closed forms are stated as solutions to that system. The signs and comparative statics used in Propositions 1-3 are algebraically derived from those closed forms, and the numerical section varies the exogenous elasticities and emission shares over grids rather than tuning a parameter to a target conclusion. The two accounting metrics are explicit definitions: Omega_C in Eq. (15) credits only the additional sub-sector's expansion, and Omega_A in Eq. (17) is the total emissions change; Eq. (18)'s Delta is then a definitional ratio, not an empirical prediction fitted to data. The Type 4 margin (dR_N) follows from the stated assumption that additional and non-additional sub-sectors have identical cost functions (Appendix B: Rhat = RAhat = RNhat), so the subsequent under-crediting comparison is a conditional model implication, not a result whose conclusion was baked into a fitted parameter. The self-citations (Karney 2019; Johnson-Karney 2026) are used only to illustrate the empirical plausibility of the intensive-margin response; they do not supply the analytical result. Two correctness/support caveats are outside the circularity definition: Section 5 refers to an omitted Online Appendix for derivations, and the consistency of the C denominator in Eq. (24) has been questioned. Neither makes a result equivalent to its inputs by construction.
Assumptions & free parameters
free parameters (6)
- Substitution elasticities σE, σR, σX =
σE ∈ {0.25, 3, 10000}; σR,σX ∈ {0.25,0.75,1.5}
- Initial capital shares αR, αF, αX =
Table 1 uses 0.020, 0.051, 0.929; text uses K_R=0.01, K̄=0.99
- Initial tax t and offset price s =
t=0.005, s=0.197 (baseline)
- Emission shares ρF, ρX =
ρF=0.299, ρX=0.701
- Social cost of carbon μ =
200 USD/tCO2
- Initial additionality share φ =
1 (baseline); varied over [0.05,1] in Figure 7
assumptions (6)
- standard math Log-linearization is a valid local approximation around the initial equilibrium.
- domain assumption All production sectors are CRTS with zero profits; aggregate capital K̄ is fixed and homogeneous.
- domain assumption The government runs a balanced budget: revenue from the ad valorem capital tax exactly funds the offset subsidy; the tax is effectively lump-sum because K̄ is fixed.
- domain assumption Fossil energy F is produced with capital only (perfectly elastic supply), while renewable energy R requires a fixed sector-specific resource Q̄.
- ad hoc to paper Additional and non-additional renewable sub-sectors have identical cost functions, so Rhat=RAhat=RNhat.
- domain assumption Emissions are linear in F and KX with constant emission factors ξF and ξX; no abatement intensity margin.
Cite this review
Pith. "Pith review of General Equilibrium Effects of Carbon Offsets." pith.science (2026). https://pith.science/paper/JDVAECRN
@misc{pith2026260625909,
  author       = {Pith},
  title        = {Pith review of: General Equilibrium Effects of Carbon Offsets},
  year         = {2026},
  howpublished = {\url{https://pith.science/paper/JDVAECRN}},
  note         = {Machine review of arXiv:2606.25909}
}
read the original abstract
We construct an analytical general equilibrium model of an economy with carbon offsets, and show that increasing the carbon offset price has an ambiguous effect on aggregate emissions and welfare. Using two carbon accounting metrics, we demonstrate that offsets are over-credited under many parameterizations; however, offset under-crediting can also occur. Due to general equilibrium effects, neither carbon accounting metric is a sufficient statistic for welfare. Furthermore, we define four margins whereby offsets can respond to payments, including a margin not previously identified. Our results suggest that market spillover effects warrant consideration when evaluating carbon offset policies.
Figures


Figures from the paper (7 more)



Reference graph
Works this paper leans on
-
[1]
Investment versus output subsidies: Implications of alternative incentives for wind energy,
Aldy , Joseph E, T odd D Gerarden, and Richard L Sweeney, “Investment versus output subsidies: Implications of alternative incentives for wind energy,”Journal of the Association of Environmental and Resource Economists, 2023,10(4), 981–1018. Alix-Garcia, Jennifer M, Elizabeth N Shapiro, and Katharine RE Sims, “Forest conservation and slippage: Evidence fr...
2023
-
[8]
Carbon offset demand hits record in 2023 off huge December,
Harrison, Kyle, “Carbon offset demand hits record in 2023 off huge December,”Bloomberg NEF,
2023
-
[9]
Reflections—What would it take to reduce US greenhouse gas emissions 80 percent by 2050?,
Heal, Geoffrey, “Reflections—What would it take to reduce US greenhouse gas emissions 80 percent by 2050?,”Review of Environmental Economics and Policy, 2017,11(2), 319–335. Heilmayr, Robert, Kimberly M Carlson, and Jason Jon Benedict, “Deforestation spillovers from oil palm sustainability certification,”Environmental Research Letters, 2020,15(7), 075002....
-
[11]
Emissions trading, firm heterogeneity, and intra-industry reallo- cations in the long run,
Konishi, Y oshifumi and Nori T arui, “Emissions trading, firm heterogeneity, and intra-industry reallo- cations in the long run,”Journal of the Association of Environmental and Resource Economists, 2015,2 (1), 1–42. Leonard, Matthew D, Efstathios E Michaelides, and Dimitrios N Michaelides, “Energy storage needs for the substitution of fossil fuel power pl...
2015
-
[12]
The additionality problem with offsets: Optimal contracts for carbon sequestration in forests,
(Accessed: March 25, 2026). Mason, Charles F and Andrew J Plantinga, “The additionality problem with offsets: Optimal contracts for carbon sequestration in forests,”Journal of Environmental Economics and Management, 2013,66(1), 1–14. McGuinness, Meghan and A Denny Ellerman, “The effects of interactions between federal and state climate policies,”MIT Cente...
2026
-
[14]
Optimal taxation of externalities interacting through markets: A theoretical general equilibrium analysis,
Globus-Harris and Karney 32 Ren, Xiaolin, Don F ullerton, and John B Braden, “Optimal taxation of externalities interacting through markets: A theoretical general equilibrium analysis,”Resource and Energy Economics, 2011,33 (3), 496–514. Sallee, James M, “The Trouble with Green Subsidies,”National Tax Journal, 2025,78(1), 171–199. Schneider, Lambert Richa...
2011
-
[15]
Annual Energy Outlook 2025,
U.S. Energy Information Administration, “Annual Energy Outlook 2025,” Technical Report
2025
-
[16]
U.S. Energy-Related Carbon Dioxide Emissions, 2024,
https://www.eia.gov/outlooks/aeo/. , “U.S. Energy-Related Carbon Dioxide Emissions, 2024,” Technical Report 2025.https://www.eia. gov/environment/emissions/carbon/. U.S. Environmental Protection Agency, “Report on the Social Cost of Greenhouse Gases: Estimates Incorporating Recent Scientific Advances,” Technical Report
2024
Show all 17 references
-
[1997]
Costs of energy efficiency mandates can reverse the sign of rebound,
and Chi L T a, “Costs of energy efficiency mandates can reverse the sign of rebound,”Journal of public economics, 2020,188, 104225. and , “What determines effectiveness of renewable energy standards? General equilibrium analytical model and empirical analysis,”Journal of the A...
2020
-
[2008]
Constructing carbon offsets: The obstacles to quantifying emission reductions,
Millard-Ball, Adam and Leonard Ortolano, “Constructing carbon offsets: The obstacles to quantifying emission reductions,”Energy Policy, 2010,38(1), 533–546. Montero, Juan-Pablo, “Optimal design of a phase-in emissions trading program,”Journal of Public Economics, 2000,75(2), 2...
2010
-
[2010]
Do carbon offsets offset carbon?,
Calel, Raphael, Jonathan Colmer, Antoine Dechezleprˆ etre, and Matthieu Glachant, “Do carbon offsets offset carbon?,”American Economic Journal: Applied Economics, 2025,17(1), 1–40. Carbon Credits, “Carbon Prices Today: Voluntary Carbon Market Overview,” Technical Report
2025
-
[2016]
An Impossible Goal: When Trade Ratios Cannot Achieve No-Net-Loss,
Globus-Harris, Isla, “An Impossible Goal: When Trade Ratios Cannot Achieve No-Net-Loss,”Southern Economic Journal, 2020,86(4), 1372–1392. Goulder, Lawrence and Marc Hafstead,Confronting the climate challenge: US policy options, Columbia University Press,
2020
-
[2017]
The cost of carbon leakage: Britain’s carbon price support and cross-border electricity trade,
Guo, Bowei, “The cost of carbon leakage: Britain’s carbon price support and cross-border electricity trade,” The Energy Journal, 2023,44(1), 9–32. Hafstead, Marc AC and Roberton C Williams III, “Unemployment and environmental regulation in general equilibrium,”Journal of Publi...
2023
-
[2022]
Scale and transfers in international emissions offset programs,
V an Benthem, Arthur and Suzi Kerr, “Scale and transfers in international emissions offset programs,” Journal of Public Economics, 2013,107, 31–46. V¨ ohringer, F rank, Timo Kuosmanen, and Rob Dellink, “How to attribute market leakage to CDM projects,”Climate Policy, 2006,5(5)...
2013
-
[2024]
Emissions reductions or green booms? General equilibrium effects of a renewable portfolio standard,
, T eevrat Garg, and Daniel Kaffine, “Emissions reductions or green booms? General equilibrium effects of a renewable portfolio standard,”Journal of Environmental Economics and Management, 2018, 90, 78–100. B¨ ohringer, Christoph, Knut Einar Rosendahl, and Halvor Briseid Storr...
2018
-
[2025]
Carbon Capture and Storage in the United States (#59832),
https://carboncredits.com/carbon-prices-today/(Accessed: March 22, 2026). Globus-Harris and Karney 30 Congressional Budget Office, “Carbon Capture and Storage in the United States (#59832),” Technical Report 2023.https://www.cbo.gov/publication/59832. , “The Section 45Q Tax Cr...
2026
-
[2026]
Electricity market deregulation and environmental regulation: Evidence from US nuclear power,
Karney , Daniel H, “Electricity market deregulation and environmental regulation: Evidence from US nuclear power,”Energy Economics, 2019,84, 104500. , Don F ullerton, and Kathy Baylis, “A Model of the Model: Unpacking CGE Results on Carbon Leakage from Climate Policy,”NBER Wor...
2019
Reviewed August 3, 2026 · model on record in the stance chip above.
Discussion (0). Continue with ORCID to comment.