REVIEW 3 major objections 4 minor 44 references
A Correlation in the Waiting-time Distributions of Solar Flares
T0 review · 3 major / 4 minor · reviewed 2026-08-14 · deepseek-v4-flash
Pith's one-line read In two isolated active regions, the time after a solar flare correlates with the flare's magnitude, while the time before it does not.
desk verdict A nice exploratory hint with an honest caveat, but the saturation correlation is not established; GOES obscuration alone can produce it. read the letter →
The pith
A machine-rendered reading of the paper's core claim, the machinery that carries it, and where it could break.
The reading
What carries the argument
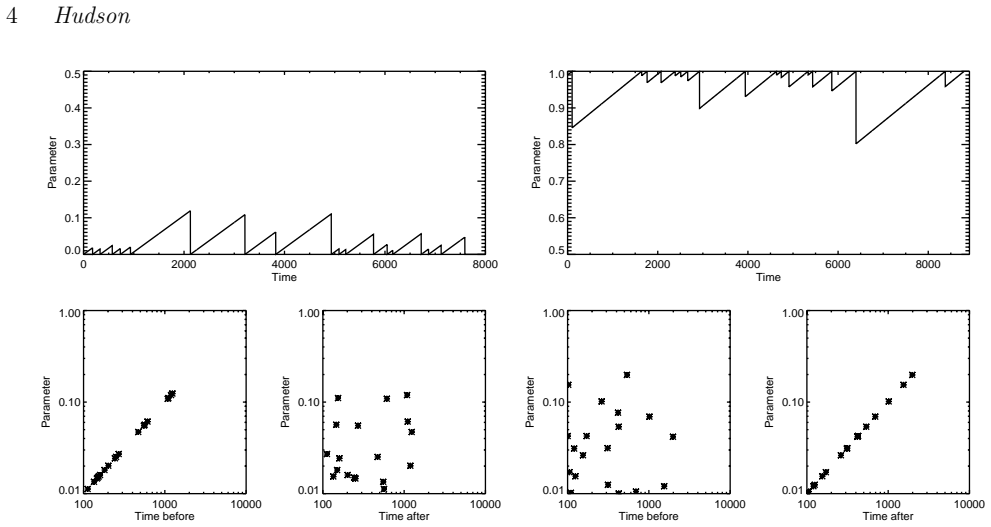
The load-bearing object is the distinction between two orderings of the waiting-time/magnitude relationship: the 'reset' limit, where an event empties the stored energy and the time before the event should correlate with its size, and the 'saturation' limit, where a fixed non-zero threshold triggers a partial release and the time after the event carries the correlation. The paper builds a one-parameter toy model of a relaxation oscillator with random triggering to illustrate these alternatives, then tests the data with Pearson correlation coefficients and power-law fits of the form $W \propto (\Delta t)^\alpha$, with $W$ the GOES peak flux and $\Delta t$ the waiting time after the flare. The 'saturation' ordering is the machinery that carries the argument: it produces strong correlations in the two selected intervals and several individual days, and the 'reset' ordering does not.
What would settle it
Recompute the interval-size correlations from the primary, background-subtracted GOES 1–8 Å time series with a fixed detection threshold for the same two active regions and dates; if the saturation correlation disappears while the reset correlation remains null, the claim is refuted. A cleaner check is to compare the same intervals against an independent hard X-ray flare list, which is far less affected by soft X-ray background obscuration and should reproduce the saturation correlation if it is real.
Extended reading notes
Core claim
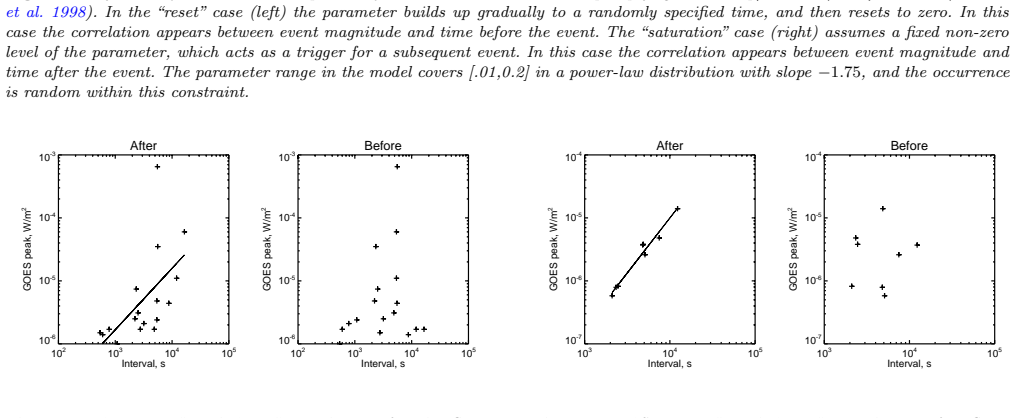
The central discovery claimed is an 'after' correlation in GOES soft X-ray flare waiting times: in the chosen intervals, the peak flux of a flare is strongly correlated with the waiting time until the next flare, with Pearson coefficients of about 0.78 for the 6 December 2006 sequence in AR 10930 and 0.93 for the 8–9 July 1996 sequence in AR 7978, while the 'before' (reset) correlations are not significant. The paper interprets this as the signature of a build-up-and-release mechanism in which a slowly growing store of magnetic free energy releases a fraction of itself when a threshold is reached, rather than being fully emptied. The full multi-day AR 10930 series shows no correlation (r = 0.06 ± 0.48), and the effect appears only intermittently on individual days, which the author reads as noise or a slowly varying driver masking the correlation on longer time scales. Because the same GOES database has a systematic obscuration bias, the paper treats the correlation as preliminary and proposes several ways to test it further.
Load-bearing premise
The result depends on the GOES event list being complete and unbiased enough that the saturation correlation is not manufactured by the obscuration bias the paper itself identifies, in which weak flares are missed against the bright background following large events; it also depends on the two selected intervals and the day-by-day choices being representative rather than post-hoc picks.
Editorial extensions
If this is right
- If real, the saturation correlation is the first observational evidence that a build-up-and-release process operates in solar flares, supporting the consensus view that coronal magnetic energy storage lies behind flare energy release.
- The ordering selects among BUR variants: because the correlation appears after the flare and not before, a flare does not empty the reservoir but releases a fraction when a threshold is reached.
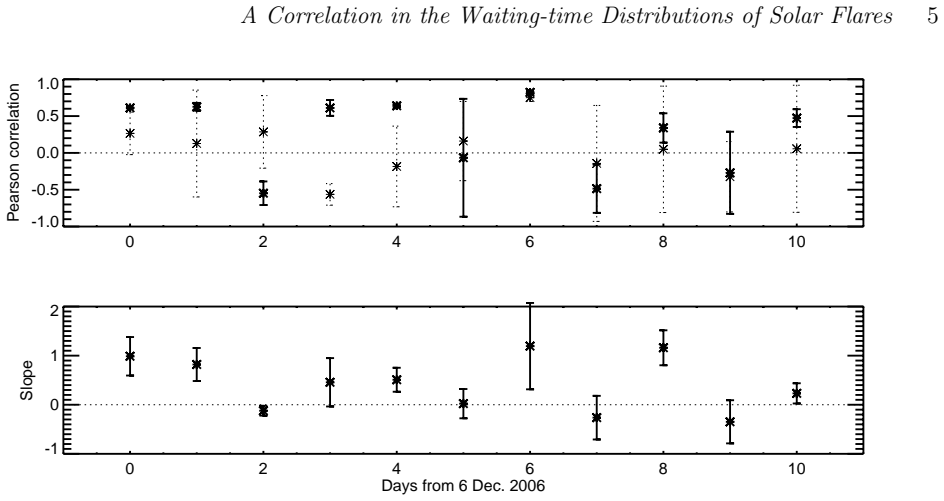
- The intermittency of the correlation, strong on some days but absent in the full month-long series, implies the effect operates on roughly day-long time scales and can be masked by a slowly varying energy input.
- If the correlation holds, the waiting time after a flare carries information about the stored free energy level, which could improve statistical forecasts of the next flare magnitude from catalog data alone.
- The result challenges avalanche-style models that predict no waiting-time/magnitude correlation, pushing them to account for a threshold-like saturation process.
Reading between the lines
- A natural next step the paper does not take is to search for the same 'after' correlation in stellar superflare waiting times or other repeating transient catalogs; if the mechanism is generic, the slope $\alpha \approx 1$ should reappear there.
- Because only selected intervals and individual days show the effect, a testable extension is to bin the AR 10930 data by background level or photospheric flux emergence; if the correlation strength tracks those drivers, the obscuration explanation weakens and the physical BUR interpretation strengthens.
- A formal stochastic model of a reservoir forced by random input with a fixed release threshold would predict the waiting-time distribution conditional on the preceding flare size; comparing that prediction with Table 1's day-by-day slopes would test the one-parameter toy model without new observations.
Signed reviews
Editorial analysis
A structured set of objections, weighed in public.
Referee Report
Summary. The paper claims to have found observational evidence for a 'saturation' build-up-and-release (BUR) process in solar flares: in two isolated active regions (NOAA 7978 and 10930), the waiting time after a flare correlates with the GOES soft X-ray peak flux of that flare, while the waiting time before a flare does not. The analysis uses the tabulated NOAA GOES event list, computes Pearson correlations for individual days or selected intervals, and reports several strongly positive 'after' correlations. The paper acknowledges that the GOES catalog suffers from under-reporting of weak flares during elevated background ('obscuration') and that no correction was applied, and it finds no correlation in the full AR 10930 time series.
Significance. If the claimed correlation were robust, it would be the first direct observational support for a BUR mechanism in flares, and the identification of the 'saturation' rather than 'reset' ordering would constrain theoretical models. The paper's strengths are the use of two well-isolated active regions, the clear presentation of the toy model (Figure 4), and the explicit discussion of catalog limitations and proposed follow-up observations. However, the current evidence is not convincing because of uncorrected catalog bias, post-hoc selection of intervals, and implausibly small quoted uncertainties.
major comments (3)
- [Section 3, Figures 5-6 and Table 1] The quoted uncertainties on the Pearson correlation coefficients are not physically plausible. For the 18-point sample of 6 December 2006, the standard error of r=0.779 under the usual normal approximation is (1-r^2)/sqrt(N) ≈ 0.09, not 0.0002 as reported. Similarly, Table 1 lists δRs=0.01 for r=0.61 with N=18, about an order of magnitude smaller than the normal-approximation value of ≈0.15. The significance statements throughout the paper therefore need to be recomputed with a correct estimator (e.g., Fisher z-transform or bootstrap), and all quoted uncertainties should be updated accordingly.
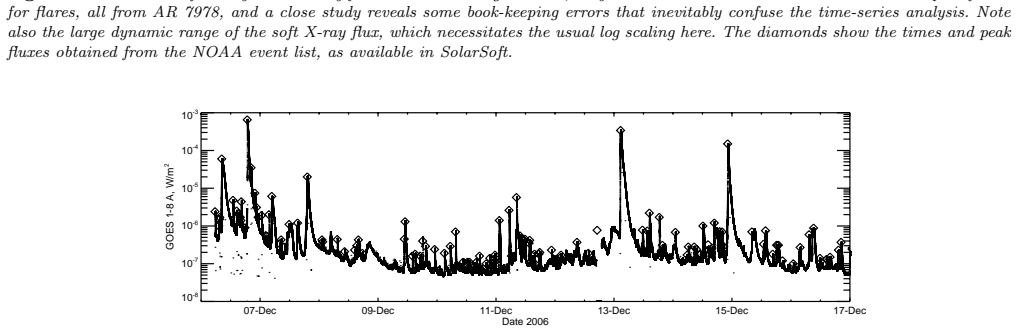
- [Sections 2 and 4] The 'obscuration' effect is acknowledged but never corrected. During the elevated GOES background after X-class flares, weak events are systematically missed, so the measured waiting time after a large flare is inflated. This produces precisely the saturation correlation claimed. The observation that the strongest daily correlations in AR 10930 occur on days with X-class flares (Table 1, Figure 8) and that the full 123-event series shows r=0.06±0.48 (Section 3) is consistent with the bias dominating the signal. The paper needs a quantitative treatment, e.g., analysis of the primary GOES light curves with a background model and injected synthetic flares to estimate detection completeness as a function of background level.
- [Section 3, Figures 5-8 and Table 1] The correlation is established only in post-hoc selected intervals: one 12-hour interval for AR 7978 (Figure 6) and the best days among an 11-day scan for AR 10930 (Figures 7-8, Table 1). Given that 22 correlation coefficients were computed (11 days times two orderings) plus the 12-hour window, the probability of finding a few nominally significant coefficients by chance is non-negligible, and the paper does not apply any multiple-testing correction. A robust claim requires either a pre-specified analysis plan or a global statistic (e.g., a permutation test over the full time series) rather than reporting the best-selected windows.
minor comments (4)
- [Section 3, lower panel of Figure 7] The fitting method for the power-law slope α is not described; state whether the fit is in log-log space, how the uncertainties are obtained, and whether the slopes are consistent with α=1.
- [Section 6] There is an incomplete citation in the bulleted list of further work: 'e.g., ?' should be replaced with a proper reference for homologous flare sequences.
- [Throughout] There are several typographical errors, including 'relase' (Section 4), 'Theoreticawork' (Section 6), and 'results from' in the abstract; a careful proofread is needed.
- [Figure 1] The caption says 'File magnetograms'; please clarify the instrument and wavelength (e.g., full-disk HMI or MDI magnetograms) and acknowledge the data source properly.
Circularity Check
No significant circularity: the central claim is an empirical correlation test against external GOES data, and the author's self-citations are not load-bearing.
full rationale
The paper's central claim is a measured correlation between GOES peak flux and waiting time in two isolated active regions. The data are external (NOAA/SolarSoft GOES event list), and the analysis computes Pearson correlations directly from the tabulated event times and fluxes. The toy model in Figure 4 is explicitly illustrative ('We construct a toy model with these alternative features... Figure 4 illustrates the two alternatives schematically'), and no parameters are fitted to the GOES data, so the observed correlations are not 'predictions' recovered from a fit. The two orderings ('reset' before, 'saturation' after) are both tested, and the paper reports that the saturation ordering correlates while the reset ordering does not; that asymmetry is an empirical outcome, not a definitional tautology. The author's own prior work is cited as motivation (Hudson et al. 1998 suggested the saturation possibility), and the Acknowledgment notes the study 'follows on from preliminary work,' but the confirmation rests on the new GOES measurements, not on that citation. The 'obscuration' effect that could mimic the correlation is openly discussed as a systematic data-selection issue ('no background corrections, and no correction made for the obscuration effect'), which is a correctness risk rather than a circularity: the paper does not define the correlation in terms of the bias, nor does it rename a fitted input as a prediction. There is no uniqueness theorem imported from the authors, no ansatz smuggled in by citation, and no known result merely renamed. Accordingly, no circular step can be quoted or exhibited, and the circularity score is 0.
Assumptions & free parameters
free parameters (2)
- toy model power-law slope =
-1.75
- fitted slope alpha in day-by-day W vs Delta t fits =
around 1
assumptions (4)
- domain assumption GOES soft X-ray peak flux is a usable proxy for flare energy release
- domain assumption The two active regions, NOAA 7978 and NOAA 10930, are isolated and are the sources of all GOES flares during the studied intervals
- domain assumption The NOAA GOES event list is complete enough that missed weak events do not generate the observed correlation
- domain assumption Flare energy release follows a build-up and release (BUR) scenario based on coronal magnetic free energy
Cite this review
Pith. "Pith review of A Correlation in the Waiting-time Distributions of Solar Flares." pith.science (2026). https://pith.science/paper/JFK43FIO
@misc{pith2026190808749,
  author       = {Pith},
  title        = {Pith review of: A Correlation in the Waiting-time Distributions of Solar Flares},
  year         = {2026},
  howpublished = {\url{https://pith.science/paper/JFK43FIO}},
  note         = {Machine review of arXiv:1908.08749}
}
read the original abstract
In isolated solar active regions, we find that the waiting times between flares correlate with flare magnitudes as determined by the GOES soft X-ray fluxes. A "build-up and release" scenario (BUR) for magnetic energy storage in the solar corona suggests the existence of such a relationship, relating the slowly varying subphotospheric energy sources to the sudden coronal energy releases of flares and CMEs. Substantial amounts of research effort had not previously found any obvious observational evidence for such a BUR process. This has posed a puzzle since coronal magnetic energy storage represents the consensus view of the basic flare mechanism. We have revisited the GOES soft X-ray flare statistics for any evidence of correlations, using two isolated active regions, and have found significant evidence for a "saturation" correlation. Rather than a "reset" form of this relaxation, in which the time \textit{before} a flare correlates with its magnitude, the "saturation" relationship results in the time \textit{after} the flare showing the correlation. The observed correlation competes with the effect of reduced GOES sensitivity, in which weaker events can be under-reported systematically. This complicates the observed correlation, and we discuss several approaches to remedy this.
Figures


Figures from the paper (4 more)

Reference graph
Works this paper leans on
-
[1]
Aschwanden M. J., et al., 2016, @doi [ ] 10.1007/s11214-014-0054-6 , https://ui.adsabs.harvard.edu/abs/2016SSRv..198...47A 198, 47
-
[2]
A., 1994, PhD thesis, University of New Hampshire
Biesecker D. A., 1994, PhD thesis, University of New Hampshire
work page 1994
-
[3]
Biesecker D. A., Ryan J. M., Fishman G. J., 1994, in Ryan J., Vestrand W. T., eds, American Institute of Physics Conference Series Vol. 294, High-Energy Solar Phenomena - a New Era of Spacecraft Measurements. pp 183--186, @doi 10.1063/1.45188
-
[4]
Cargill P. J., Chen J., Garren D. A., 1994, @doi [ ] 10.1086/173863 , http://adsabs.harvard.edu/abs/1994ApJ...423..854C 423, 854
-
[5]
Crosby N., Vilmer N., Lund N., Sunyaev R., 1998, , http://adsabs.harvard.edu/abs/1998A
work page 1998
-
[6]
Emslie A. G., et al., 2012, @doi [ ] 10.1088/0004-637X/759/1/71 , http://adsabs.harvard.edu/abs/2012ApJ...759...71E 759, 71
-
[7]
Energy Balance in Avalanche Models for Solar Flares
Farhang N., Wheatland M. S., Safari H., 2019, arXiv e-prints, https://ui.adsabs.harvard.edu/abs/2019arXiv190900195F p. arXiv:1909.00195
work page Pith review arXiv 2019
-
[8]
Fishman G. J., Meegan C. A., Wilson R. B., Paciesas W. S., Pendleton G. N., 1992, in NASA Conference Publication. pp 26--34
work page 1992
Show all 44 references
-
[9]
L., Handy B
Freeland S. L., Handy B. N., 1998, @doi [ ] 10.1023/A:1005038224881 , https://ui.adsabs.harvard.edu/abs/1998SoPh..182..497F 182, 497
1998 doi
-
[10]
Gaizauskas V., Svestka Z., 1987, @doi [ ] 10.1007/BF00167354 , http://adsabs.harvard.edu/abs/1987SoPh..114..389G 114, 389
1987 doi
-
[11]
K., Titov V
Georgoulis M. K., Titov V. S., Miki \'c Z., 2012, @doi [ ] 10.1088/0004-637X/761/1/61 , http://adsabs.harvard.edu/abs/2012ApJ...761...61G 761, 61
2012 doi
-
[12]
Ginoux J.-M., Letellier C., 2012, @doi [Chaos] 10.1063/1.3670008 , https://ui.adsabs.harvard.edu/abs/2012Chaos..22b3120G 22, 023120
2012 doi
-
[13]
S., 2007, in Heinzel P., Dorotovi c I., Rutten R
Hudson H. S., 2007, in Heinzel P., Dorotovi c I., Rutten R. J., eds, Astronomical Society of the Pacific Conference Series Vol. 368, The Physics of Chromospheric Plasmas. p. 365 ( @eprint arXiv 0704.0823 )
2007 arXiv
-
[14]
S., Labonte B
Hudson H. S., Labonte B. J., Sterling A. C., Watanabe T., 1998, in Watanabe T., Kosugi T., eds, Astrophysics and Space Science Library Vol. 229, Observational Plasma Astrophysics: Five Years of Yohkoh and Beyond. p. 237
1998
-
[15]
Hudson H., Fletcher L., McTiernan J., 2014, @doi [ ] 10.1007/s11207-013-0384-7 , http://adsabs.harvard.edu/abs/2014SoPh..289.1341H 289, 1341
2014 doi
-
[16]
W., 1982, @doi [ ] 10.1029/JA087iA05p03439 , http://adsabs.harvard.edu/abs/1982JGR....87.3439K 87, 3439
Kahler S. W., 1982, @doi [ ] 10.1029/JA087iA05p03439 , http://adsabs.harvard.edu/abs/1982JGR....87.3439K 87, 3439
1982 doi
-
[17]
L., Zaitsev V
Khodachenko M. L., Zaitsev V. V., Kislyakov A. G., Stepanov A. V., 2009, @doi [ ] 10.1007/s11214-009-9538-1 , https://ui.adsabs.harvard.edu/abs/2009SSRv..149...83K 149, 83
2009 doi
-
[18]
G., Zharkova V
Kosovichev A. G., Zharkova V. V., 1998, @doi [ ] 10.1038/30629 , http://adsabs.harvard.edu/abs/1998Natur.393..317K 393, 317
1998 doi
-
[19]
Kubo Y., 2008, @doi [ ] 10.1007/s11207-008-9135-6 , https://ui.adsabs.harvard.edu/abs/2008SoPh..248...85K 248, 85
2008 doi
-
[20]
A., Dennis B
Kucera T. A., Dennis B. R., Schwartz R. A., Shaw D., 1997, @doi [ ] 10.1086/303532 , https://ui.adsabs.harvard.edu/abs/1997ApJ...475..338K 475, 338
1997 doi
-
[21]
Lewin W. H. G., et al., 1976, @doi [ ] 10.1086/182188 , https://ui.adsabs.harvard.edu/abs/1976ApJ...207L..95L 207, L95
1976 doi
-
[22]
W., 1996, @doi [ ] 10.1007/BF00153836 , https://ui.adsabs.harvard.edu/abs/1996SoPh..169...91L 169, 91
Longcope D. W., 1996, @doi [ ] 10.1007/BF00153836 , https://ui.adsabs.harvard.edu/abs/1996SoPh..169...91L 169, 91
1996 doi
-
[23]
T., 1995, @doi [ ] 10.1086/175885 , https://ui.adsabs.harvard.edu/abs/1995ApJ...447..416L 447, 416
Lu E. T., 1995, @doi [ ] 10.1086/175885 , https://ui.adsabs.harvard.edu/abs/1995ApJ...447..416L 447, 416
1995 doi
-
[24]
T., Hamilton R
Lu E. T., Hamilton R. J., 1991, @doi [ ] 10.1086/186180 , http://adsabs.harvard.edu/abs/1991ApJ...380L..89L 380, L89
1991 doi
-
[25]
Lund N., 1981, @doi [ ] 10.1007/BF00651391 , https://ui.adsabs.harvard.edu/abs/1981Ap&SS..75..145L 75, 145
1981 doi
-
[26]
Melatos A., Howitt G., Fulgenzi W., 2018, @doi [ ] 10.3847/1538-4357/aad228 , https://ui.adsabs.harvard.edu/abs/2018ApJ...863..196M 863, 196
2018 doi
-
[27]
B., 1995, @doi [ ] 10.1086/176228 , http://adsabs.harvard.edu/abs/1995ApJ...451..391M 451, 391
Melrose D. B., 1995, @doi [ ] 10.1086/176228 , http://adsabs.harvard.edu/abs/1995ApJ...451..391M 451, 391
1995 doi
-
[28]
B., 2017, @doi [Journal of Geophysical Research (Space Physics)] 10.1002/2017JA024035 , https://ui.adsabs.harvard.edu/abs/2017JGRA..122.7963M 122, 7963
Melrose D. B., 2017, @doi [Journal of Geophysical Research (Space Physics)] 10.1002/2017JA024035 , https://ui.adsabs.harvard.edu/abs/2017JGRA..122.7963M 122, 7963
2017 doi
-
[29]
A., et al., 2009, @doi [ ] 10.1088/0004-637X/693/1/L11 , http://adsabs.harvard.edu/abs/2009ApJ...693L..11M 693, L11
Mewaldt R. A., et al., 2009, @doi [ ] 10.1088/0004-637X/693/1/L11 , http://adsabs.harvard.edu/abs/2009ApJ...693L..11M 693, L11
2009 doi
-
[30]
E., Wang Q
Middleditch J., Marshall F. E., Wang Q. D., Gotthelf E. V., Zhang W., 2006, @doi [ ] 10.1086/508736 , http://adsabs.harvard.edu/abs/2006ApJ...652.1531M 652, 1531
2006 doi
-
[31]
W., Parnell C
Reid J., Hood A. W., Parnell C. E., Browning P. K., Cargill P. J., 2018, @doi [ ] 10.1051/0004-6361/201732399 , https://ui.adsabs.harvard.edu/abs/2018A&A...615A..84R 615, A84
2018 doi
-
[32]
S., 1978, @doi [ ] 10.1086/156227 , http://adsabs.harvard.edu/abs/1978ApJ...222.1104R 222, 1104
Rosner R., Vaiana G. S., 1978, @doi [ ] 10.1086/156227 , http://adsabs.harvard.edu/abs/1978ApJ...222.1104R 222, 1104
1978 doi
-
[33]
M., 1994, @doi [ ] 10.1029/94GL00003 , https://ui.adsabs.harvard.edu/abs/1994GeoRL..21..241R 21, 241
Rust D. M., 1994, @doi [ ] 10.1029/94GL00003 , https://ui.adsabs.harvard.edu/abs/1994GeoRL..21..241R 21, 241
1994 doi
-
[34]
Shimizu T., 1995, , http://adsabs.harvard.edu/abs/1995PASJ...47..251S 47, 251
1995
-
[35]
T., Liu Y., Wiegelmann T., Hayashi K., Chen Q., Thalmann J., 2012, @doi [ ] 10.1088/0004-637X/748/2/77 , http://adsabs.harvard.edu/abs/2012ApJ...748...77S 748, 77
Sun X., Hoeksema J. T., Liu Y., Wiegelmann T., Hayashi K., Chen Q., Thalmann J., 2012, @doi [ ] 10.1088/0004-637X/748/2/77 , http://adsabs.harvard.edu/abs/2012ApJ...748...77S 748, 77
2012 doi
-
[36]
S., 2009, @doi [ ] 10.1007/s11207-009-9387-9 , http://adsabs.harvard.edu/abs/2009SoPh..258..141T 258, 141
Tranquille C., Hurley K., Hudson H. S., 2009, @doi [ ] 10.1007/s11207-009-9387-9 , http://adsabs.harvard.edu/abs/2009SoPh..258..141T 258, 141
2009 doi
-
[37]
Wang H., Ewell M. W. J., Zirin H., Ai G., 1994, @doi [ ] 10.1086/173901 , https://ui.adsabs.harvard.edu/abs/1994ApJ...424..436W 424, 436
1994 doi
-
[38]
S., 2000a, @doi [ ] 10.1023/A:1005240712931 , http://adsabs.harvard.edu/abs/2000SoPh..191..381W 191, 381
Wheatland M. S., 2000a, @doi [ ] 10.1023/A:1005240712931 , http://adsabs.harvard.edu/abs/2000SoPh..191..381W 191, 381
-
[39]
S., 2000b, @doi [ ] 10.1086/312739 , http://adsabs.harvard.edu/abs/2000ApJ...536L.109W 536, L109
Wheatland M. S., 2000b, @doi [ ] 10.1086/312739 , http://adsabs.harvard.edu/abs/2000ApJ...536L.109W 536, L109
-
[40]
S., 2001, , http://adsabs.harvard.edu/abs/2001SoPh..203...87W 203, 87
Wheatland M. S., 2001, , http://adsabs.harvard.edu/abs/2001SoPh..203...87W 203, 87
2001
-
[41]
S., 2010, @doi [ ] 10.1088/0004-637X/710/2/1324 , http://adsabs.harvard.edu/abs/2010ApJ...710.1324W 710, 1324
Wheatland M. S., 2010, @doi [ ] 10.1088/0004-637X/710/2/1324 , http://adsabs.harvard.edu/abs/2010ApJ...710.1324W 710, 1324
2010 doi
-
[42]
M., Thomas R
White S. M., Thomas R. J., Schwartz R. A., 2005, @doi [ ] 10.1007/s11207-005-2445-z , http://adsabs.harvard.edu/abs/2005SoPh..227..231W 227, 231
2005 doi
-
[43]
V., Stepanov A
Zaitsev V. V., Stepanov A. V., Urpo S., Pohjolainen S., 1998, , http://adsabs.harvard.edu/abs/1998A
1998
-
[44]
van der Pol B., van der Mark J., 1927, @doi [ ] 10.1038/120363a0 , https://ui.adsabs.harvard.edu/abs/1927Natur.120..363V 120, 363
1927 doi
Reviewed August 14, 2026 · model on record in the stance chip above.
Discussion (0). Continue with ORCID to comment.